Departamento de Física
Neural Correlations during Brain Activation in
Arithmetical tasks
–
an approach using
Electroencephalographic data
Leonor Lopes Ribeiro da Silva Girão
Resumo
Este trabalho tem por objectivo o estudo da correlação entre diferentes regiões cerebrais durante
a realização de uma tarefa de cálculo mental, e de como estas relações variam comparativamente a
uma situação de repouso. Para tal, foram utilizados métodos lineares bem como não lineares, i.e.,
métodos que calculam a correlação linear entre dois sinais e métodos que calculam a correlação
entre sinais sem partir de qualquer pressuposto a nível do tipo de relação que se encontra presente.
O primeiro algoritmo implementado foi a função de correlação cruzada, que estima a
correlação linear entre dois sinais e o desfasamento entre estes, permitindo fazer inferências a nível
de causalidade. Este algoritmo foi validado com a técnica de surrogation, de modo a testar a sua
aplicabilidade neste tipo de sinais. Seguidamente, foram implementados dois algoritmos análogos
entre si, o coeficiente de determinação e o coeficiente de regressão não linear. Ambos estes
coeficientes medem a proporção de redução na variância que pode ser obtida estimando a relação
entre ambas as variáveis através de uma determinada curva de ajuste, sendo que o primeiro método
assume uma relação linear entre as variáveis e o segundo não parte de qualquer tipo de pressuposto
relativamente à correlação entre as mesmas.
As principais diferenças observadas entre a situação de repouso e a situação de cálculo
consistiram em que na situação de repouso verificou-se que havia mais zonas correlacionadas e
durante a tarefa a sincronia entre regiões tornava-se localizada principalmente nas regiões frontais e
parietais. Além disso, as estimativas obtidas através dos métodos lineares e do método não linear
foram bastante semelhantes, o que sugere que neste caso as relações entre os diferentes circuitos
cerebrais são maioritariamente lineares, e deste modo justifica-se a aplicação de algoritmos lineares
neste tipo de análises em determinados casos.
Relativamente ao estudo dos atrasos e estimativas de causalidade, não foram obtidos
resultados conclusivos.
Abstract
The present study aims at examining the correlation among different brain areas while the
subjects performed an arithmetical task, and how these differ from the mental relations in the same
subjects during a resting state. In order to this, both linear and nonlinear methods were used, i.e.,
both algorithms capable of detecting linear relations and algorithms capable of detecting correlations
without assuming any type of parametric relationship between the signals were implemented.
The first algorithm that was implemented was the cross-correlation function, which gives an
estimate of how much two signals are linearly correlated, and estimates the delay between them,
thus permitting to make inferences on causality. Furthermore, this algorithm was validated using the
statistic method called surrogation, in order to test for the applicability of the algorithm on the signals
that were to be processed. The next part of the study consisted on implementing two analogous
algorithms, the coefficient of determination and the nonlinear regression coefficient. These
coefficients both measure the fraction of reduction of variance that can be obtained by estimating the
relationship between two signals according to a fitted line, the difference being that the former assumes a linear relation between both sets of samples and the latter doesn‟t previously assume any type of relationship between the signals.
The main differences in correlation that were observed between the state of mental rest and
between the arithmetic task performance were that in the former more brain sites were correlated,
whereas during the task this synchrony was mainly verified between frontal and parietal areas,
showing a decrease in the other locations. Furthermore, the estimates provided by the linear and
nonlinear algorithms were very similar, suggesting that in this case the relationships among different
neural networks were mainly linear, and thus validating the application of linear methods in this
type of analysis in particular cases.
Regarding the estimation of delays between signals and inferences on causality, no
conclusive results were attained.
Acknowledgments
First of all, I would like to thank my thesis advisor, Professor Carla Quintão Pereira, not only for
her precious advice, but also for all the availability and comprehension demonstrated in all
moments.
I would also like to thank Professor Mário Forjaz Secca, for all his support throughout the
course, and in particular in this final stage.
A special thank you to Professor Maria João Trindade, for the sympathy demonstrated towards
my present condition.
I would also like to thank Filipa Borges, for having shared her knowledge with me.
To all my family, who has always supported and helped me in all possible ways.
A very special thank you to my friends. You know how much you mean to me.
Contents
Introduction
1
1
Introduction to the Brain and Arithmetical thinking
3
1.1
Anatomy of the Brain
3
1.1.1
The central nervous system
3
1.1.2
The Brain
5
1.2
Functional organization of the cerebral cortex
7
1.2.1
Sensory and motor areas
8
1.2.2
Association areas
10
1.3
Arithmetics and the Brain
–
mental processes under number comprehension,
production and calculation
11
1.3.1
Mental representation of numbers
11
1.3.2
Cognitive models for the processing of mental calculation
13
1.3.3
Arithmetic and brain activity
14
2
Brain imaging methods
–
the special case of EEG
17
2.1
Methods of brain imaging
–
The EEG method
17
2.1.1
EEG
–
Electroencephalography
20
2.1.2
Multi-modal approach
27
2.2
EEG processing
28
2.2.1
Linear methods
29
2.2.2
Nonlinear methods
32
2.3
EEG processing
–
methods used in the present study
34
2.3.1
Cross-correlation function validation
–
surrogation method
34
2.3.2
Coefficient of determination and nonlinear regression coefficient
35
3
Methodology
39
3.1
Methods
–
Data acquisition, participants, and experimental paradigm
39
3.1.1
EEG Acquisition
39
3.1.2
Participants and experimental paradigm
40
3.2
EEG Processing
–
Mathematical algorithms
41
3.2.1
Cross-Correlation
41
3.2.2
Surrogation for the validation of the algorithm used to compute
cross-correlation
42
3.2.4
Validation of the algorithms used to compute r2 and h2
45
4
Results and Discussion
49
4.1
Results obtained by applying the cross-correlation function algorithm
49
4.1.1
Basal condition
–
Eyes closed
51
4.1.2
Task condition
–
Mental calculation
55
4.1.3
Basal condition vs. Task condition
61
4.2
Results obtained by applying the coefficient of determination (r2) association
function algorithm and the nonlinear regression coefficient (h2) association function
algorithm
61
4.2.1
Coefficient of determination, r2
63
4.2.2
Nonlinear regression coefficient, h2
66
4.3
Estimation of the delays between signals
71
4.4
Discussion of the results
72
5
General Conclusions
75
Bibliography
77
Appendix A
81
Appendix B
95
List of Figures
FIGURE 1-1:THE SEVEN MAIN PARTS OF THE CENTRAL NERVOUS SYSTEM (ADAPTED FROM (SHEPHERD 1994) ... 5
FIGURE 1-2:THE LOBES OF THE BRAIN:SUPERIOR,LATERAL AND SAGITTAL VIEWS (ILLUSTRATIONS 2005). ... 6
FIGURE 1-3:THE LOBES OF THE BRAIN:LATERAL AND SUPERIOR VIEWS (ILLUSTRATIONS 2005). ... 7
FIGURE 1-4:ANATOMY AND FUNCTIONS OF THE BRAIN (ILLUSTRATIONS 2005) ... 8
FIGURE 1-5:SENSORY AND MOTOR AREAS.(ADAPTED FROM (SNELL 2001)). ... 9
FIGURE 1-6:SCHEMATIC REPRESENTATION OF NUMBER-PROCESSING AND CALCULATION SYSTEMS (ADAPTED FROM (M. CARAMAZZA 1985) ...12
FIGURE 1-7:SCHEMATIC REPRESENTATION OF THE SUBSYSTEMS COMPRISED IN NUMBER-COMPREHENSION AND NUMBER -PRODUCTION (ADAPTED FROM (M.CARAMAZZA 1985)). ...13
FIGURE 2-1:BASIC STRUCTURE OF A NEURON (ADAPTED FROM (K.B.DURKA 2006) ...21
FIGURE 2-2:EXAMPLE OF CHEMICAL SYNAPSE AND RESPECTIVE EXCITATORY POSTSYNAPTIC POTENTIAL (ADAPTED FROM (K.B. DURKA 2006) ...21
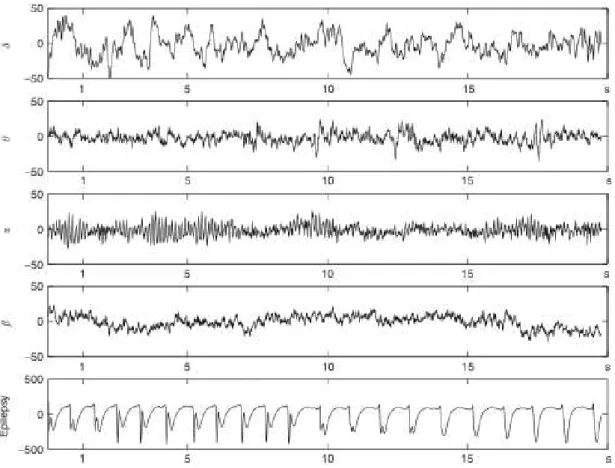
FIGURE 2-3:CHARACTERISTIC EEG RHYTHMS.FROM TOP TO BOTTOM: DELTA RHYTHM, THETA RHYTHM, ALPHA RHYTHM, BETA RHYTHM AND DURING AN EPILEPTIC SEIZURE (NOTE THAT THE AMPLITUDE SCALE OF THE LAST SIGNAL IS AN ORDER OF MAGNITUDE BIGGER)(ADAPTED FROM BLINOWSKA ET AL.,2006) ...25
FIGURE 2-4:INTERNATIONAL 10/20 SYSTEM FOR ELECTRODE PLACING IN EEG RECORDING (ADAPTED FROM (K.B.DURKA 2006) ...26
FIGURE 2-6:EXAMPLE OF A FUNCTION WITH THE SHAPE OF A ‘PLATEAU’.IN THIS PARTICULAR CASE, IS PLOTTED AS A
FUNCTION OF THE NUMBER OF BINS ... 37 FIGURE 3-1:DISTRIBUTION OF THE ELECTRODES IN THE PRESENT STUDY.(ADAPTED FROM BORGES,2009) ... 40
FIGURE 3-2:FIRST 21ST
ELEMENTS OF THE SEQUENCE OF NUMBERS.NOTICE THE PATTERN FOR EACH 10 ELEMENTS OF THE
SEQUENCE. ... 41 FIGURE 3-3:GRAPHS SHOWING AN EXAMPLE OF THE RESULTS OF THE SURROGATION PROCEDURE.(A)RESULTS OF THE
SIMULATION REGARDING THE ESTIMATION OF THE (NEGATIVE VALUES) FROM WHICH TWO SIGNALS CAN BE CONSIDERED TO BE INVERSELY LINEARLY CORRELATED.(B)RESULTS OF THE SIMULATION REGARDING THE ESTIMATION OF THE VALUES
FROM WHICH TWO SIGNALS CAN BE CONSIDERED TO BE DIRECTLY LINEARLY CORRELATED.NOTICE THAT ALL THE VALUES ARE UNDER 0.1. THESE RESULTS WERE OBTAINED FROM SUBJECT BTL IN CALCULATION CONDITION... 44 FIGURE 3-4:GRAPH SHOWING THE VARIATION OF THE NONLINEAR REGRESSION COEFFICIENT, , ACCORDING TO THE NUMBER
OF BINS, .NOTICE THAT STANDS AT THE BEGINNING OF THE ‘PLATEAU’: LESS BINS UNDERESTIMATED THE VALUE OF WHEREAS MORE BINS REQUIRE MORE COMPUTATIONAL LOAD WITHOUT MAKING MUCH DIFFERENCE IN
List of Tables
TABLE 1-1:THE MAIN PARTS OF CENTRAL NERVOUS SYSTEM AND SHORT DESCRIPTION OF THEIR MAIN FUNCTIONS. ... 4 TABLE 2-1:CORTICAL AREAS UNDERLYING EACH ELECTRODE IN THE 10-20 SYSTEM (ADAPTED FROM (KAISER 2006) ...27 3-1TABLE SUMMARIZING THE MAIN CHARACTERISTICS AND PERFORMING DETAILS OF THE PARTICIPANTS (ADAPTED FROM
BORGES 2009)...47 TABLE 4-1:CORRELATION VALUES REGARDING THE DIFFERENT ELECTRODE PAIRS FOR THE 15 INDIVIDUALS.BASAL
CONDITION.(SEE TEXT FOR COLOUR INTERPRETATION) ...50 TABLE 4-2:MEAN VALUES FOR THE CROSS-CORRELATION BETWEEN ELECTRODE PAIRS CONSIDERING THE 15 INDIVIDUALS, AND
RESPECTIVE VARIANCES AND INDEXES OF DISPERSION.BASAL CONDITION.(SEE TEXT FOR COLOUR INTERPRETATION) ..51 TABLE 4-3:CORRELATION VALUES REGARDING THE DIFFERENT ELECTRODE PAIRS FOR THE 15 INDIVIDUALS (LEFT HEMISPHERE).
BASAL CONDITION.(SEE TEXT FOR COLOUR INTERPRETATION) ...53 TABLE 4-4:CORRELATION VALUES REGARDING THE DIFFERENT ELECTRODE PAIRS FOR THE 15 INDIVIDUALS (RIGHT
HEMISPHERE).BASAL CONDITION.(SEE TEXT FOR COLOUR INTERPRETATION) ...54 TABLE 4-5:MEAN VALUES FOR THE CROSS-CORRELATION BETWEEN ELECTRODE PAIRS CONSIDERING THE 15 INDIVIDUALS, AND
RESPECTIVE VARIANCES AND INDEXES OF DISPERSION (LEFT HEMISPHERE).BASAL CONDITION.(SEE TEXT FOR COLOUR INTERPRETATION) ...55 TABLE 4-6:MEAN VALUES FOR THE CROSS-CORRELATION BETWEEN ELECTRODE PAIRS CONSIDERING THE 15 INDIVIDUALS, AND
RESPECTIVE VARIANCES AND INDEXES OF DISPERSION (RIGHT HEMISPHERE).BASAL CONDITION.(SEE TEXT FOR COLOUR INTERPRETATION) ...55 TABLE 4-7:CORRELATION VALUES REGARDING THE DIFFERENT ELECTRODE PAIRS FOR THE 15 INDIVIDUALS.TASK CONDITION.
RED: SUBJECTS WHO USED ONLY CALCULUS;UNDERLINED: PHYSICAL ENGINEERS (SEE TEXT FOR REMAINING COLOUR
INTERPRETATION). ...56 TABLE 4-8.MEAN VALUES FOR THE CROSS-CORRELATION BETWEEN ELECTRODE PAIRS CONSIDERING THE 15 INDIVIDUALS, AND
RESPECTIVE VARIANCES AND INDEXES OF DISPERSION.TASK CONDITION.(SEE TEXT FOR COLOUR INTERPRETATION)...57 TABLE 4-9:CORRELATION VALUES REGARDING THE DIFFERENT ELECTRODE PAIRS FOR THE 15 INDIVIDUALS (LEFT HEMISPHERE).
TASK CONDITION.RED: SUBJECTS WHO USED ONLY CALCULUS;UNDERLINED: PHYSICAL ENGINEERS (SEE TEXT FOR
REMAINING COLOUR INTERPRETATION). ...58 TABLE 4-10:CORRELATION VALUES REGARDING THE DIFFERENT ELECTRODE PAIRS FOR THE 15 INDIVIDUALS (RIGHT
TABLE 4-11:MEAN VALUES FOR THE CROSS-CORRELATION BETWEEN ELECTRODE PAIRS CONSIDERING THE 15 INDIVIDUALS,
AND RESPECTIVE VARIANCES AND INDEXES OF DISPERSION (LEFT HEMISPHERE).TASK CONDITION.(SEE TEXT FOR COLOUR
INTERPRETATION) ... 60 TABLE 4-12:MEAN VALUES FOR THE CROSS-CORRELATION BETWEEN ELECTRODE PAIRS CONSIDERING THE 15 INDIVIDUALS,
AND RESPECTIVE VARIANCES AND INDEXES OF DISPERSION (RIGHT HEMISPHERE).TASK CONDITION.(SEE TEXT FOR COLOUR INTERPRETATION) ... 60 TABLE 4-13:COEFFICIENT OF DETERMINATION VALUES REGARDING THE DIFFERENT ELECTRODE PAIRS FOR THE 15
INDIVIDUALS.BASAL CONDITION. ... 62 TABLE 4-14:MEAN VALUES FOR THE COEFFICIENT OF DETERMINATION ESTIMATED BETWEEN ELECTRODE PAIRS CONSIDERING
THE 15 INDIVIDUALS, AND RESPECTIVE VARIANCES AND INDEXES OF DISPERSION.BASAL CONDITION. ... 63 TABLE 4-15:COEFFICIENT OF DETERMINATION VALUES REGARDING THE DIFFERENT ELECTRODE PAIRS FOR THE 15
INDIVIDUALS.TASK CONDITION. ... 65 TABLE 4-16:MEAN VALUES FOR THE COEFFICIENT OF DETERMINATIONESTIMATED BETWEEN ELECTRODE PAIRS CONSIDERING
THE 15 INDIVIDUALS, AND RESPECTIVE VARIANCES AND INDEXES OF DISPERSION.TASK CONDITION ... 66 4-17:NONLINEAR REGRESSION COEFFICIENT VALUES REGARDING THE DIFFERENT ELECTRODE PAIRS FOR THE 15 INDIVIDUALS.
BASAL CONDITION. ... 68 4-18:MEAN VALUES FOR THE NONLINEAR REGRESSION COEFFICIENT ESTIMATED BETWEEN ELECTRODE PAIRS CONSIDERING
THE 15 INDIVIDUALS, AND RESPECTIVE VARIANCES AND INDEXES OF DISPERSION.BASAL CONDITION. ... 69 TABLE 4-19:NONLINEAR REGRESSION COEFFICIENT VALUES REGARDING THE DIFFERENT ELECTRODE PAIRS FOR THE 15
INDIVIDUALS.TASK CONDITION. ... 70 TABLE 4-20:MEAN VALUES FOR THE NONLINEAR REGRESSION COEFFICIENTESTIMATED BETWEEN ELECTRODE PAIRS
Acronyms
BOLD blood oxygenation level dependence
CBF cerebral blood flow
DTT diffusion tensor tractography
ECoG electrocorticography
EEG electroencephalography
EPSP excitatory postsynaptic potential
fMRI functional magnetic resonance imaging
FT Fourier transform
HIPS horizontal segment of the intraparietal sulcus
IPSP inhibitory postsynaptic potential
MEG magnetoencephalography
MRI magnetic resonance imaging
NIRS near-infrared spectroscopy
OCD obsessive compulsive disorder
PET positron emission tomography
PSP postsynaptic potential
PTO parieto-occipital-temporal
SPECT single-photon emission computed tomography
TES transcranial electric stimulation
Introduction
The subject of brain and cognition has been the focus of the attention of many investigators.
From cognitive psychology to functional neuroimaging techniques, many have been the approaches
taken to get further insight into this question. Techniques having high spatial resolution such as
positron emission tomography (PET) and functional magnetic resonance imaging (fMRI) have
permitted to identify some structures which become active in several mental tasks. However, no
method has, until the present date, attained the high temporal resolution of the electrophysiological
methods of electroencephalography (EEG) and magnetoencephalography (MEG), which permit to
monitor the activity of the brain in a time-scale in the order of milliseconds. This characteristic of
EEG and MEG makes them extremely useful tools particularly in studying relations among different
brain areas, being it the reason why the EEG method has been selected for this study.
The present study consisted of processing EEG signals coming from 15 subjects both in an
arithmetic task condition and in a resting state condition, and to compare the results obtained from
both. With this protocol, the objective is to obtain further insight into mental activation in this type
of cognitive activity.
This thesis is organized in five chapters: two theoretical chapters introducing the main
aspects regarding this work, one chapter describing the methodology, one chapter presenting and
discussing the results that were obtained, and a final conclusion.
In the first chapter, Introduction to the Brain and Arithmetical thinking, a brief description of the
anatomy and physiology of the brain is presented. This is followed by an outline of the main theories
regarding arithmetical thinking that have been presented until the present date by other authors.
The second chapter, Brain Imaging methods – the special case of EEG, summarizes the main imaging techniques that are available for the functional study of the brain, focusing, in particular, on
EEG.
the procedures used in the present study and the results they have yielded. In the end of the fourth
chapter these results will be discussed.
Finally, in the last chapter, General Conclusions, this work will be put in context with the state of
1
Introduction to the Brain and Arithmetical
thinking
This chapter is aimed at introducing the theme of brain mechanisms underlying mental
calculation, describing the main theories and findings on this subject until the present date, and to relate these to the present study. In order to this, a brief description of the brain‟s anatomy will be presented, followed by a section about the functional organization of the cerebral cortex and a
section about brain activity during arithmetic processing. Finally, a brief description of the paradigm
used in the present study will be presented, linking this with the findings previously outlined.
1.1
Anatomy of the Brain
1.1.1
The central nervous system
The brain is the centre of the nervous system in all vertebrate and most invertebrate animals
(Shepherd 1994).
The nervous system and the endocrine system control the functions of the body. It is composed
basically of specialized cells that receive sensory stimuli and which transmit them to effector organs,
so that these work harmoniously together for the well-being of the individual. In addition to these
functions, the nervous system of higher species has the ability to store sensory information received
from past experiences. It is divided into two parts, the central nervous system and the peripheral
nervous system. The first is formed by the brain and spinal cord whereas the latter consists of the
cranial and spinal nerves and their associated ganglia.
The central nervous system is the main centre where correlation and integration of nervous
supported by specialized tissue called neuroglia. The long processes of a nerve cell are called axons
or nerve fibres and the substance consisting of nerve fibres embedded in neuroglia is called white
matter. The remaining part of the neurons embedded in neuroglia is called gray matter. These two
substances form the interior of the central nervous system(Snell 2001).
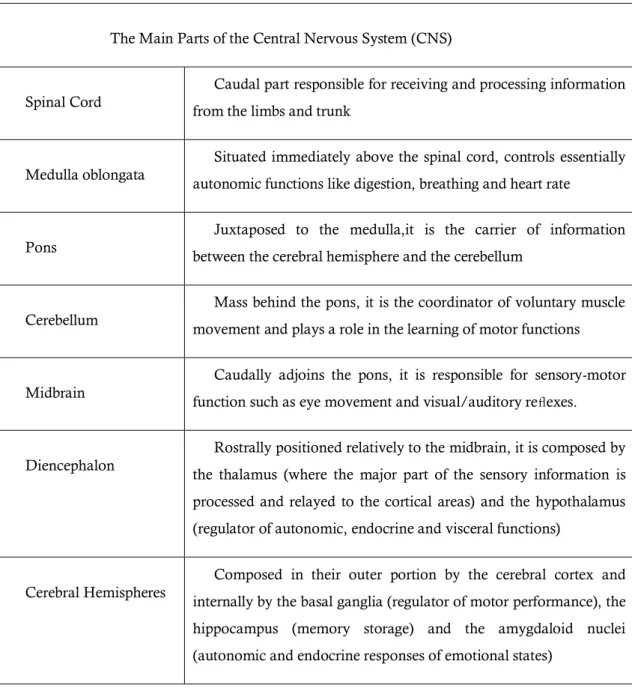
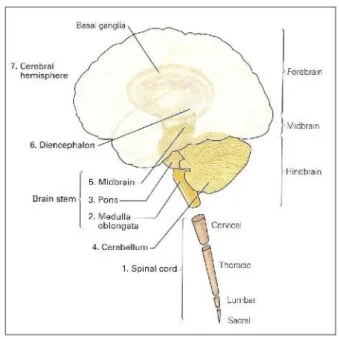
As reported by Borges (2009), the central nervous system is composed by seven main parts,
which are summarized in table1.1. and represented in figure1.1.
Table 1-1: The main parts of Central Nervous System and short description of their main functions.
The Main Parts of the Central Nervous System (CNS)
Spinal Cord
Caudal part responsible for receiving and processing information
from the limbs and trunk
Medulla oblongata
Situated immediately above the spinal cord, controls essentially
autonomic functions like digestion, breathing and heart rate
Pons
Juxtaposed to the medulla,it is the carrier of information
between the cerebral hemisphere and the cerebellum
Cerebellum
Mass behind the pons, it is the coordinator of voluntary muscle
movement and plays a role in the learning of motor functions
Midbrain
Caudally adjoins the pons, it is responsible for sensory-motor
function such as eye movement and visual/auditory reflexes.
Diencephalon
Rostrally positioned relatively to the midbrain, it is composed by
the thalamus (where the major part of the sensory information is
processed and relayed to the cortical areas) and the hypothalamus
(regulator of autonomic, endocrine and visceral functions)
Cerebral Hemispheres
Composed in their outer portion by the cerebral cortex and
internally by the basal ganglia (regulator of motor performance), the
hippocampus (memory storage) and the amygdaloid nuclei
1.1.2
The Brain
The brain is divided in three parts (figure 1.1): the hindbrain, the midbrain and the forebrain.
Within the forebrain we can further distinguish the diencephalon and the cerebrum, which is the
largest part of the brain and is formed by the two cerebral hemispheres (Snell 2001). The cerebral
hemispheres are composed by an inner layer of white matter coated with a layer of grey matter, the
cortex, which is the cerebral structure which is most related to the highest cognitive, perceptional
and motor functions (Pereira 1998). In order to increase the surface of the cortex, the latter is thrown
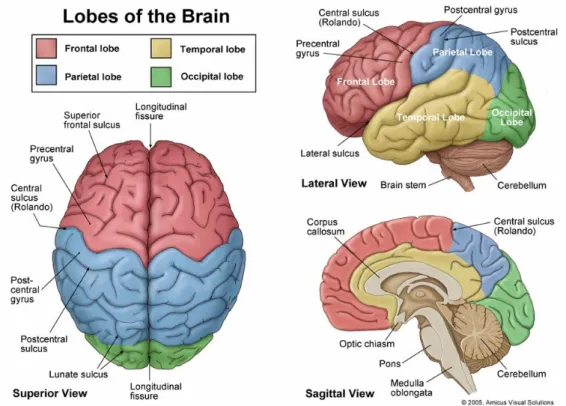
into folds, called gyri, separated by fissures, or sulci. A number of large sulci are used to separate the
brain into lobes. The lobes are named according to the cranial bones under which they lie, and
consist of: frontal, parietal, temporal and occipital lobes (see figure 1.2). The sulcis which serve as
boundaries for this division are the central and parieto-occipital sulci and the lateral and calcarine
sulci. Within each lobe, further structures can be distinguished. Because the lobes of the cerebral
hemisphere are not clearly defined on the medial and inferior surfaces, a description will be
presented of the divisions in the superolateral surface of each hemisphere, followed by an outline of
some important areas in the medial and inferior surfaces of the hemispheres. These structures will be
referred to in the following chapters.
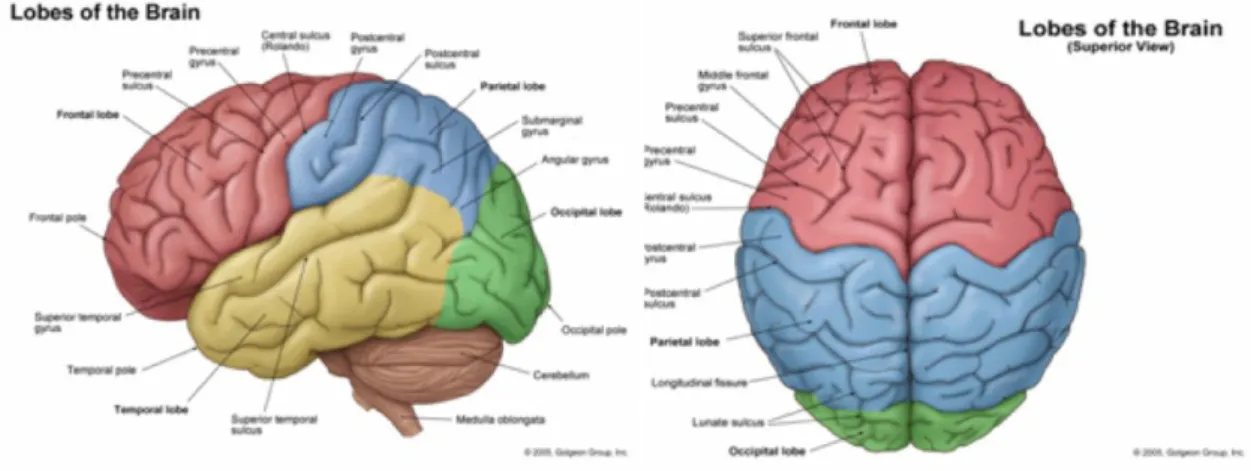
The frontal lobe is divided by three sulci into four gyri. These are the precentral sulcus, the
superior frontal sulcus, the inferior frontal sulcus, the precentral gyrus, the superior frontal gyrus, the
middle frontal gyrus and the inferior frontal gyrus (figure 1.2, figure 1.3).
The parietal lobe is divided by two sulci into three gyri. The intraparietal sulcus and the
postcentral sulcus divide the lateral surface of the parietal lobe into superior parietal gyrus, inferior
parietal gyrus and postcentral gyrus (figure 1.2, figure 1.3).
The temporal lobe is also divided by two sulci into three gyri. The superior temporal sulcus and
the middle temporal sulcus divide the lateral surface of the temporal lobe into superior temporal
gyrus, middle temporal gyrus and inferior frontal gyrus (figure 1.2, figure 1.3).
In the occipital lobe no similar divisions are considered. The occipital lobe occupies a small
area behind the parieto-occipital sulcus (figure 1.2, figure 1.3).
In the medial and inferior surfaces of the hemisphere it is worth outlining the cingulate
gyrus, which is separated from the superior frontal gyrus by the cingulate sulcus, and the precuneus,
which is bounded anteriorly by the upturned posterior end of the cingulate sulcus and posteriorly by
the parieto-occipital sulcus (Snell 2001).
1.2
Functional organization of the cerebral cortex
Many studies carried out in the past century have suggested that the brain is divided into
functional specialized areas (Shepherd 1994), although they all work interactively in order to carry
out the higher cognitive functions of the human brain (Eric R. Kandel 2000). Some functional
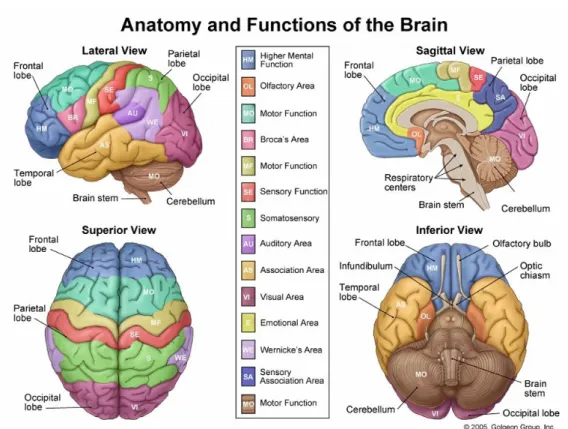
regions are represented in figure 1.4. In this section the main functional divisions of the cortex
within each lobule will be outlined.
First of all, a distinction can be made between the sensory and motor areas and the
association areas. Within the former we can further distinguish the primary sensory and motor areas
and the secondary sensory and motor areas. Within the latter we can distinguish the prefrontal, the
inferior temporal and the parietal-temporal-occipital areas.
The primary sensory and motor areas occupy about 20% of the cortex and are where most
of the sensory information first arrives. Primary motor areas send commands to the muscles. The
secondary sensory and motor areas are where the sensory information is further processed
(Physpharm 2009).
The sensory and motor areas only occupy a small part of the brain. The remaining areas are
known as the association areas, or association cortex. These areas have multiple inputs and outputs
and are very much concerned with behaviour, discrimination and interpretation of sensory
experiences (Snell 2001).
In the next section a brief description of the sensory and motor areas in each lobule will be
presented, followed by an outline of the association areas.
1.2.1
Sensory and motor areas
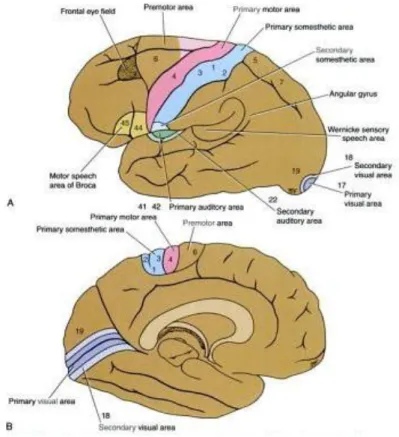
In the frontal lobe, the precentral area is situated in the precentral gyrus and comprises the motor
or primary motor area in the posterior region and the premotor or secondary motor area in the
anterior region (figure 1.5). The primary motor area is responsible for carrying out movements of
different parts of the body. The area of cortex controlling a particular movement is proportional to
the skill involved in performing the movement and not to the mass of muscle which participates in
the movement. The function of the secondary motor area is to program the activity of the primary
motor cortex. In the medial frontal gyrus is located the supplementary motor area, which is also
responsible for producing movement. However its removal does not cause permanent loss of
movement. The frontal eye field extends forward from the facial area of the precentral gyrus into the
middle frontal gyrus and is considered to be related to the voluntary movements of the eyes,
independently of visual stimuli. Finally, located in the inferior frontal gyrus is the motor speech area of Broca, or Broca‟s area. This area is very important in the language dominant hemisphere (which is the left hemisphere, in 90% of the population (Eric R. Kandel 2000) since it brings about the
formation of words by its connections with the adjacent primary motor areas. The ablation of this
area will result in paralysis of speech.
In the parietal lobe, two sensory areas can be distinguished. These are the primary somesthetic area
(or primary somatic sensory cortex) and the secondary somesthetic area (secondary somatic sensory
cortex). The primary somesthetic area lies across the central sulcus and occupies the precentral gyrus
behind the primary motor area. It receives sensory information from nerve projections from the
body. Analogously to the primary motor area, the area controlling a particular part of the body is
related to its functional importance rather that to its size. The face, lips, thumb and index finger have
particularly large areas assigned to them. The secondary somesthetic area is located in the superior
bank of the lateral fissure. It is much smaller and seems to be less important than the primary
sensory area, and it responds to transient stimuli. However, the exact function of this area is not
fully understood.
In the temporal lobe, we can distinguish the primary and secondary auditory areas and the sensory speech area of Wernicke (or Wernicke‟s area). The primary auditory area is located in the inferior wall of the lateral sulcus. The secondary auditory area lies posterior to the primary auditory
necessary for the interpretation of sounds and for the association of the auditory input with other
sensory information. The sensory speech area of Wernicke lies mainly in the superior temporal gyrus of the dominant hemisphere for language and is connected to Broca‟s area (on the same hemisphere) by a bundle of nerve fibres called the arcuate fasciculus. It permits the understanding of
the written and spoken language.
In the occipital lobe lie the primary and secondary visual areas and the occipital eye field.
The primary visual area is located in the walls of the posterior part of the calcarine sulcus and is
surrounded by the secondary visual area on the medial and lateral surfaces of the hemisphere. The
secondary area is responsible for the integration of the visual information received by the primary
visual area to past visual experiences, enabling one to recognize and appreciate what one is seeing.
The occipital eye field is thought to exist in the secondary visual area in humans and its function is
believed to be reflex and associated with movements of the eye when it is following an object (Snell
2001).
1.2.2
Association areas
The prefrontal cortex is an association area that lies anterior to the precentral area and is
concerned with the individual‟s personality. It is responsible for associating experiences that are necessary for the production of abstract ideas, judgment, emotional feelings and planning. After lesions in this region, patients‟ emotions become altered. The planning function is carried out through the use of working memory (Physpharm 2009). Working memory is, as Baddeley (1992) defined it, “a brain system that provides temporary storage and manipulation of the information necessary for such complex cognitive tasks as language comprehension, learning and reasoning”. It requires simultaneously both storage and processing of information, and can be divided into three
subcomponents: the main component is the central executive component, which is an
attentional-controlling system, and the other two slave systems are the visuospatial sketch pad, responsible for
the manipulation of visual images, and the phonological loop, which stores and rehearses
speech-based information in order to keep the contents in working memory. The frontal lobes have been
reported to be important in the process of maintenance of the contents of working memory through
verbal rehearsal mechanisms due to their relationship with working memory and attention
(Baddeley 1992; Thalía Harmony 1999).
The inferior temporal association areas are large areas located on the underside of the cortex and
are very much related to memory functions. The inferior and medial portions of the temporal lobe
are involved in long term memory. The right side is more involved with pictorial memory
(Physpharm 2009) and the left side in verbal memory (in individuals in which the left hemisphere is
The parieto-occipital-temporal (PTO) areas are where the convergence of senses and attention
occur. They are responsible for, as an example, locating objects in space by touch, sight, sound, etc
(Physpharm 2009).
1.3
Arithmetics and the Brain
–
mental processes under number
comprehension, production and calculation
The question of how the brain perceives, produces numbers and calculates is highly complex. It
has been argued by many investigators, and is now widely assumed, that there is a tight relation
between numerical abilities and language mechanisms (M. Caramazza 1985; Stanislas Dehaene
1992; Juliana V. Baldo 2006; Baldo and Dronkers 2007). However, there is strong evidence that
numerical competence cannot be reduced to syntax and language skills. Thus, it has been proposed
that there exists a numerical sense which enables one to understand the semantic of numbers and
operations in terms of numerical quantities (Stanislas Dehaene 1992; Rochel Gelman 2005). To
what extent this number sense is innate or developed in the course of life is another question in
debate (S. Dehaene 1999; Simon 1999; Laure Zago 2001).
1.3.1
Mental representation of numbers
Before analyzing the process of mental calculation, let us focus on the way numbers are
represented mentally. These two aspects have been considered as being separate by many authors
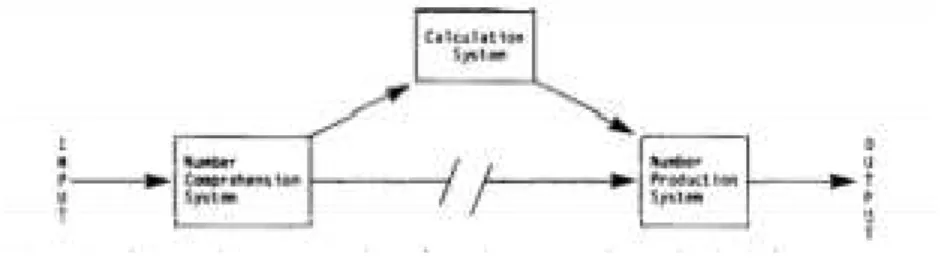
(M. Caramazza 1985; Stanislas Dehaene 1992). In 1985, McCloskey and Caramazza proposed a
model for the brain circuits used in arithmetic involving two different systems: a number-processing system and a calculation system, where the former “comprises the mechanisms for comprehending and producing numbers, whereas the calculation system consists of the facts and procedures required specifically for carrying out calculations”. Tests carried out on brain-damaged patients who showed impairment at performing arithmetical tasks provided further insight into the organization and the
functioning of these two systems (M. Caramazza 1985). McCloskey (1985) argued that we can
distinguish the capacity to comprehend from the capacity to produce numbers, being that a patient
with some impairment might be able to perform the former without being able to perform the latter
Within each of these capacities, we can further distinguish the components for processing Arabic
numbers (in digit form, e.g. 32) from the components for processing verbal numbers (either spoken
or written, e.g. thirty-two). Within each of these subsystem there is a distinction between
lexical-processing and syntactic-lexical-processing components, where lexical-lexical-processing refers to the capacity to
comprehend or produce single digits (e.g. 2 or two) and syntactic-processing refers to the relations
among the digits in order to comprehend or produce a number as a whole (e.g. 253 ortwo hundred
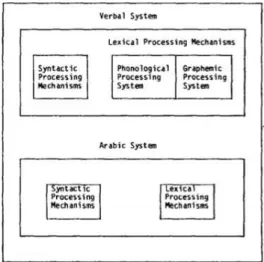
fifty three involves understanding and processing 2x100+5x10+3).Finally, within the
lexical-processing mechanisms of the verbal system (but not the Arabic system) a distinction has been made
between the components for producing and comprehending spoken numbers and the components
for producing and comprehending written numbers (figure 1.7). In any of the subsystems mentioned,
it can occur that someone is impaired at processing one of them while the other remains intact, i.e,
they are considered to be independent (M. Caramazza 1985). McCloskey and Caramazza (1985)
reported several cases of impaired patients observed by previous investigators which illustrate these
distinctions.For example, a patient was described who when presented an arithmetical problem
visually or orally he could consistently chose the correct answer from a set of possible answers.
However, when this patient was asked to say or write down the answer, he almost always answered
incorrectly. This shows an ability to comprehend but not to produce Arabic or verbal numbers
(comprehension/production dissociation). Another patient made no errors in judging which Arabic
number was larger (e.g., 3 vs 8) but performed at chance on the same task involving verbal numbers
(e.g. three vs eight) (Arabic/verbal dissociation). Cases of lexical/syntactic dissociation were also
reported. In one patient, when verbal numbers were presented aurally and the patient was asked to
write down the Arabic equivalents, the digits were correct but the order of magnitude was incorrect
(e.g., two thousand five hundred as 2000500). This demonstrated lexical intact processing with
syntactic impairment. Other patients are able to perform magnitude comparisons involving spoken
number words but are unable to perform the same task with written number words
(phonological/graphemic dissociation). From these examples, one can already start to imagine that since different circuits are related to different competences, there will be a wide variability in brain‟s activation amongst individuals depending on the mental strategy which is preferred.
However, it has been argued that these components are neither enough to characterize human
adult perception of numbers nor to explain the competences of quantification or approximation.
Therefore, it was suggested that there are separate non-verbal/analogical quantification processes
which provide a sense of numerical quantity, i.e, are associated with the semantic of numbers itself
(Stanislas Dehaene 1992). In order to prevent ambiguities the “number sense” can be called numerosity and the mental representation of a number can been called numeron (Gelman & Gallistel,
1978). In this analogue representation the numbers would be manipulated recurring to mental
representation of a number line (Stanislas Dehaene 1992).
1.3.2
Cognitive models for the processing of mental calculation
Calculating involves the integration of various systems, not only those referring to the mental
representation of numbers but also those involved in the various stages and processes involved in
calculation itself (Sifis Micheloyannis 2005). If one suffers from some kind of impairment of number
comprehension/production ability this should lead to a deficit in the performance of a calculation
which uses that competence. However, there are systems that concern specifically the process of
calculation and one can have no impairment regarding mental representation of numbers but still
not be able to calculate (M. Caramazza 1985).
Several models have been proposed which attempt to systematically characterize and interrelate
the various mechanisms involved in calculation. M. Caramazza (1985) suggested that the various
stages involved in calculation consist of: (1) processing numerical information (numbers and
arithmetic symbols); (2) retrieval of basic arithmetic facts (e.g. table facts as 5x4=20); (3) execution
of calculation procedures. These operations are held upon an amodal representation of numbers,
never directly on numerals or Arabic notation. The conversion between these two modalities is Figure 1-7: Schematic representation of the subsystems comprised in number-comprehension and
performed by the number comprehension/production systems mentioned in the previous section.
Others have suggested that calculation procedures are accessed through a preferred code (verbal
code, visuospacial code, etc) to which all the numerals are initially converted and that can vary from
individual to individual (Noel and Seron 1993). This would explain the fact that people tend to
perform calculations in the language in which they acquired and practiced arithmetic facts.
Campbell and Clark have proposed an encoding complex model according to which several codes are
integrated and any calculation can be performed according to the input format of the operands.
Another suggested model is the triple-code model (Stanislas Dehaene 1992). This model is based on
the theory that numbers can be represented and manipulated using three different but interconnected
codes: the auditory verbal code or auditory verbal word frame, which uses general-purpose language
modules and where numbers are treated in a way similar to word sequences, a visual Arabic number
form, where numbers are treated in Arabic format and an analogue magnitude code, in which numbers
are represented as quantities in an abstract manner similar to a visuo-spatial representation of a
number-line. According to Dehaene, each code can be used according to the numerical procedure
one wishes to accomplish. In this sense, it totally contradicts the calculation model proposed by McCloskey‟s, and is more in line with Campbell‟s model, although in the latter it is argued that the code is selected according to individual‟s idiosyncratic preferences and in the triple-code model the dependence relies on the calculation performed. For example, it was suggested that multiplication
tables and counting are stored as verbal associations which are retrieved from memory (e.g. 3x4=12 is stored in a similar manner as a phrase, one doesn‟t perform the arithmetical calculation to obtain the result), in numerical comparison and approximate calculation the Arabic input is transformed
into an analogue magnitude code before the operation can be performed and in multi-digit
operations we make use of a spatial image of the operation in Arabic notation. Each representation
is interfaced by input-output procedures similar to those presented in McCloskey‟s model (Stanislas
Dehaene 1992).
1.3.3
Arithmetic and brain activity
As stated previously, arithmetical thinking involves the integration of many processes. Many of
them are not specific to numbers and also take part in the performance of other tasks, like attention,
visual memory, linguistic processing or internal concentration (Thalía Fernández 1995; Laure Zago
2001; O. Gruber 2001; Stanislas Dehaene 2003). In the recent years, brain-imaging techniques have
been used in order to get further insight into the anatomical substrate of the various mechanisms
involved in arithmetical thinking.
Many studies using brain-imaging techniques reveal predominant activation of the left
Funnell 2007). However, this predominance is not always statically significant, showing a great deal
of individual variation. This variability may be related to the strong correlation that exists between
strength of handedness and cortical functional asymmetry (Linda Rueckert 1996; Zhang Yun-ting
2005). In fact, previous studies have revealed a strong lateralization of the left hemisphere in
right-handed subjects, while left-right-handed frequently show bilateral activation (Linda Rueckert 1996). In
particular, the left parietal cortex area usually shows predominant activity (Thalía Harmony 1999).
As the left parietal cortex has been related with storage of verbal information, this activity might be
reflect the retrieval of procedural rules and arithmetic facts as well as being involved in the
production of internal speech of the sort required for the maintenance of numerical information in
working memory (Thalía Harmony 1999). However, the right hemisphere also shows some degree
of activation and is believed to be involved in the more semantic aspects of calculation (Gregory A.
Troup 1983).
The frontal and prefrontal areas also have been reported as being important in mental calculation
processes (J. Cohen 1994; Kazuo Sasaki 1996; Thalía Harmony 1999). Frontal lobes have been
described as playing a fundamental role in working memory and attention processes, therefore their
activity is probably related to these functions (Thalía Harmony 1999). The Broca‟s area (located in
the left frontal lobe) is strongly associated with the production of speech and often shows activation
in arithmetic tasks, therefore it is also suggested that it is involved in the production of internal
speech (Thalía Harmony 1999).
Although some structures, as the left parietal cortex and the frontal and prefrontal areas,
generally show consistent activation, other structures show varying activation patterns in different
tests (Linda Rueckert 1996). Following the fact that the existing models that attempt to explain the
process of arithmetical thinking consider different brains systems for different arithmetical tasks, it
would not be surprising that different calculations would yield different activation patterns (Linda
Rueckert 1996). Various studies have been carried out in order to try to make the link between the
theoretical models and the observed activation patterns of the brain. However, the exact
interpretation of the results appears difficult since many of the structures which become active are
also taking part in other functions as well as in lower levels of numerical processing (O. Gruber
2001). In order to support the triple-code model, Dehaene carried out several studies which aimed at
identifying the brain regions associated with the different systems involved in calculation e.g. (S.
Dehaene 1999; Stanislas Dehaene 2003; Stanislas Dehaene 2004). Based on results obtained by testing individual‟s performance on several types of arithmetical tasks (as exact calculation, approximate calculation and number comparison), on animal models of the cerebral bases of
number sense and on developmental psychology of basic numerical abilities and their disorders,
calculation. According to Dehaene et al., exact calculation, namely single-digit multiplication, is
more related to retrieval of arithmetical facts in a language-specific format as compared to
approximation and number comparison tasks, which should rely mostly on non-verbal quantity
representation and manipulation networks. In agreement with this, they found that in fact these
tasks activated different circuits: exact calculation activated preferably left inferior frontal areas and
angular gyrus (traditionally related to language-processing) whereas approximation showed
preferably bilateral intraparietal activation. Visual number competences were related to bilateral
posterior superior parietal system. Furthermore, within the parietal lobes, the horizontal segment of
the intraparietal sulcus (HIPS) was systematically activated whenever numbers were manipulated,
independently of number notation and was suggested to be a core quantity system, analogous to an
internal number line (S. Dehaene 1999; Stanislas Dehaene 2003; Stanislas Dehaene 2004). Other
authors have obtained results in similar experiments which are consistent with these (Zhang
Yun-ting 2005; Baldo and Dronkers 2007; Margaret G. Funnell 2007). There is an interesYun-ting idea which
suggests that this language-independent representation of numerical quantity is related to the
preverbal numerical abilities that have been independently established in various animal species and
in human infants (S. Dehaene 1999)(Biological foundations of numerical thinking).
On the other hand, Simon (1999) has argued that there is no such thing as an innate “number sense” and that mathematical thinking emerges from the development of nonspecific visuospatial and motor areas (representing a development trace of the finger-counting mechanism that mediates,
by extension, the numerical knowledge in adults) in a “brain without numbers”. Following this theory, the retrieval of arithmetical facts would engage mainly a left parieto-premotor (motor and
visuospacial network) circuit (Laure Zago 2001) and the left anterior insula and the right cerebellar
cortex (verbal association network), while computation would yield, in addition to these, mainly
activation in a left parieto-frontal network in charge of the holding of the multidigit numbers in
visuospatial working memory and a bilateral inferior temporal areas related to the visual mental
imagery resolution strategy (Laure Zago 2001). Other tests performed by authors supporting the
same model have observed a larger degree of bilateral activation. For example (Thorsten Fehr 2007)
observed a common activation of right parietal regions and bilateral frontal regions for all tasks and
in particular bilateral parietal activation for more complex tasks.
Finally, it is worth mentioning that an interesting result concerning information direction
has been reported by some authors. Based on animal studies, (Nieder 2005; Oana Tudusciuc 2007),
Sawamura et al., (2002) suggested that numerosity is first computed in the parietal cortex, and then
2
Brain imaging methods
–
the special case of
EEG
This chapter aims at providing a description of the methods used in the present study, both
regarding the acquisition and the processing of the data. It starts by introducing the topic of EEG in
the context of functional brain imaging techniques, outlining aspects such as the relation between
this technique and neural activity, the recording of the electroencephalographic signal and its main
characteristics, and some caveats of the method of EEG. This is followed by an outline of some of
the methods used in the processing of the EEG signal, focusing on the ones which were used in the
course of this work. Finally, the statistical method of surrogation will be introduced, as it was used for
the validation of one of the algorithms which were implemented.
2.1
Methods of brain imaging
–
The EEG method
In the last decades, the development of functional imaging techniques has permitted to get
further insight into the anatomy and physiology of the brain. The combination of the experimental
strategies of cognitive psychology with these techniques has led to the sprouting of cognitive
neuroscience, a science which aims at better understanding the functional organization of the
human brain (Raichle 1998).
The non-invasive techniques currently available for functional brain mapping are largely divided
into two groups based on their principles. In one hand we have the hemodynamic techniques, which
include the positron emission tomography (PET), the single-photon emission computed tomography
(SPECT), functional magnetic resonance imaging (fMRI), and the near-infrared spectroscopy
MEG, and the transcranial magnetic stimulation (TMS). Because each of the above has its unique
features in terms of temporal and spatial resolution, it is of special interest to combine them in order to complement each other‟s information. This multi-modal approach can be divided into two categories: either by using two methods in simultaneous or in separate sessions. The latter has the
disadvantage that the experimental conditions cannot be controlled between two sessions, therefore
presenting uncontrolled background. However, due to technical reasons, sometimes the
simultaneous approach is not feasible and therefore this option has to be taken (Shibasaki 2008).
In this section a brief outline of the above-mentioned techniques will be drawn, giving a
special emphasis on EEG, since it consists of the technique used in the present study. Finally, an
overview of the multi-modal approach will be presented.
Hemodynamic techniques
The question of neurovascular coupling, i.e., de degree to which brain hemodynamic activity is
related to neural activity, has been the subject of discussion for a long time. The experimental studies
that have been carried out suggest that the hemodynamic response is correlated to electrical activity
at least within a certain range, but showing a spatial spread (Shibasaki 2008).
In brain imaging by PET, positron-emitting isotopes incorporated in radiopharmaceuticals are
introduced into the subject intravenously. In the brain, the positrons collide and annihilate local
electrons, emitting two oppositely direct photons with the exact same energy. The photon pairs that
exit the subject can be detected with a PET scanner, and from a large number of such events it is
possible to reconstruct the original distribution of radioisotopes and to map an image of the areas
which are being activated either hemodynamically or metabolically. In this way, the PET scan can
reveal dynamic effects, such as blood flow. Two tracers that are commonly used are glucose labeled
with fluor-18 and water labeled with oxygen-15 (Krane 1988; Shibasaki 2008).
The technique of SPECT is, as PET, a nuclear technique based on the injection of
radiopharmaceuticals labeled with isotopes into the body. In SPECT, the common isotopes are
technetium 99 and iodine 123. Although SPECT presents lower resolution than PET, it shows other
advantages, as using isotopes of longer half-life, which permit to follow their tracing for a longer
period of time, and not requiring the presence of a cyclotron nearby.
The fMRI technique was developed in the early 1990‟s and is based on the principle of blood oxygenation level dependence (BOLD). The BOLD effect was first described in 1990 by
Ogawa and co-workers (Ogawa and Lee, 1990; Ogawa et al., 1990) and is based on the following
sequence of events: an increase of neural activity is accompanied by an increase of the cerebral
metabolic rate of oxygen consumption and a much larger increase in cerebral blood flow. This
reduction in the local deoxygenated hemoglobin. This variation will induce the magnetic changes
that rely on the basis of the fMRI BOLD signal. However, the precise relationship between neural
signals and BOLD is not yet fully understood, which makes the question of the „inverse problem‟ (the translation between the fMRI signal and neural activity related to function) complicated.
Nonetheless, some advances have been made in terms of formulating the mathematical relations
underlying neurovascular coupling. The technique of fMRI shows some advantages over the other
noninvasive human brain imaging techniques, which have turned it into a widely used method.
These advantages include whole brain coverage, noninterference of spatially separate activation sites
and good spatial resolution, which can attain a sub-millimeter scale. However, it does show as well
some important limitations, as poor temporal resolution, in the order of seconds, the problem of
reconstructing the underlying multi-dimensional neural activity from the scalar vascular fMR signal
and the above-mentioned inverse problem: the indirect character of the fMR signal requires a
mathematical model to generate functional maps from the signal (P. Ritter 2006). Still related to the
technique of MRI, a more recent topic which is revealing interesting results is a technique called
diffusion tensor tractography (DTT). This technique is based on the diffusion characteristics of water
molecules and has proven to be useful in following white matter tracks (Catani et al., 2005;
(Shibasaki 2008). Based on DTT, Catani et al. (2005) were able to detect, beyond the classical arcuate pathway connecting Broca‟s and Wernicke‟s areas directly, a previously undescribed, indirect pathway passing through the inferior parietal cortex (Catani et al., 2005).
Finally, there is the technique of NIRS, which has been developed mainly in Japan. The
NIRS signal depends on the different optical properties of oxyhemoglobin and deoxyhemoglobin. In
brain imaging by this technique, a source irradiates a near-infrared beam into the head through
optical fibres, and the signals coming out of the head are detected by optical detectors and
transmitted via optical fibres to a photodiode. The NIRS method has the advantages of being able to
measure the oxygenated hemoglobin as an index of cerebral blood flow (CBF) continuously and
non-invasively, and of not requiring the fixation of the subject‟s head, making it useful in applications regarding moving subjects and children. The disadvantages include the fact that it only
measures cortical activity, not providing a whole brain coverage, and that its spatial resolution is
limited to a lobar level (Shibasaki 2008).
Electrophysiological techniques
As stated previously, this group of methods based on electrophysiological principles includes
EEG, MEG and TMS.
Transcranial magnetic stimulation (TMS) is used to stimulate both nerve and cortex using
relatively to transcranial electric stimulation (TES), a similar previous technique but which is
controversial since it activates pain fibres in the scalp. In TMS, pulsed magnetic field creates current
flow in the brain, temporarily exciting or inhibiting specific areas. Depending on stimulation
parameters, it is therefore possible to activate or to create transient lesions affecting selective
functions of the brain, as vision, language or motor functions. This technique may also be useful for
therapy, including psychiatry. An important advantage of this method is its temporal resolution,
allowing researchers to assess function on a milli-second scale. It also can be repeated frequently
without harm for the patient (Hallett 2000).
Magnetoencephalography (MEG) is a noninvasive technique that detects the weak
magnetic fields generated by the large pyramidal neurons of the cerebral cortex using an extremely
sensitive magnetic field sensor, the SQUID. The main advantage of the MEG technique is that the
magnetic fields are not influenced by the difference in electrical conductivity of the tissues overlying
the cerebral cortex, thus, at least theoretically, not being influenced by the skull. However, it
presents the disadvantage of only being able to record the current flows from the neurons
tangentially oriented with respect to the head surface (Leif Sörnmo 2005; Shibasaki 2008).
Electroencephalography (EEG) is, as MEG, a functional brain imaging technique related to
the electrical activity of the apical dendrites of the pyramidal neurons of the cerebral cortex.
However, the EEG is the summation of the electrical fields generated by these neurons recorded
from the head surface (or from the cortical surface, in the case of electrocorticography (ECoG),
instead of the magnetic fields (Shibasaki 2008). As it consists of the technique used in the present
study, a more detailed description of the EEG will be presented in the next few paragraphs.
2.1.1
EEG
–
Electroencephalography
In 1929, Hans Berger recorded the first EEG from the human scalp surface. This was the first
step towards the development of a technique that later became an important noninvasive tool in
better understanding the human brain. In recent years, the development of the various imaging
modalities stated above has led to a decrease in the dominance of the EEG in clinical routine.
However, its high temporal resolution, unachieved by the techniques that rely on the hemodynamic
response, makes it still a powerful tool in the diagnosis of many diseases such as epilepsy, sleep
disorders, and dementia, as well as in the study of human brain physiology and in real-time
EEG and neural activity
As stated above, the EEG signal is related to the electrical activity of apical dendrites of large
pyramidal neurons in the cerebral cortex. The neuron (figure 2.1), or nerve cell, is the basic
functional unit of the nervous system (Leif Sörnmo 2005), and together with the glial cells
constitutes the two main classes of cells that compose the brain (K. B. Durka 2006). The structure of
a neuron is formed by a cell body, called soma, from which extend the dendrites and the axon. The
axon is usually a single branch that has a length ranging from 1mm to 1m, like the axons which run from the spinal cord to the feet. Dendrites don‟t usually have more than 2mm, but one single neuron
can have dendrites consisting of several thousands of branches, with each of them receiving a signal
from another neuron (Leif Sörnmo 2005), thus establishing contact with up to 10000neurons. In the
human brain, there are about neurons (K. B. Durka 2006). The contact between two neurons is
established trough synapses (figure 2.2), where the terminal part of the axon of one neuron reaches
the subsequent neuron, usually by the dendrites or cell body of the latter (Snell 2001). Figure 2-1: Basic structure of a neuron (adapted from (K. B. Durka 2006)
The plasma membrane of the neurons has, attached to it, carbohydrate molecules which form
the cell coat. These two structures are semipermeable, allowing selective diffusion of certain ions
through it. The difference of potential which is observed across the membrane is maintained mainly
by the diffusion of and cations (Snell 2001), although there is also a contribution from the
anions. ions are less abundant but have an important regulatory role (K. B. Durka 2006).
Due to the higher permeability of the membrane to ions than to , the passive efflux of to
the tissue fluid (where the concentration of this ion is lower) is greater than the influx of into
the cell (where the concentration of this ion is lower), resulting in a steady potential difference of
about -80mV, known as the resting potential. When a cell is stimulated by a certain depolarization,
the permeability of the membrane to the ions changes, resulting in a rapid influx of this ions
into the cell, progressively depolarizing and finally changing the polarity of the membrane to the
difference of potential of approximately +40mV. This is called the action potential and lasts about 5
milliseconds. After that, the permeability of the membrane to quickly ceases, and is
accompanied by an rapid augment of the permeability to ions, which flow from the cell body
into the tissue fluid, restoring the negative resting potential of the membrane (Snell 2001). It is important to refer that this action potential obeys the „all-or-nothing‟ rule, this is, for supra-threshold stimuli, a pulse is generated, for subthreshold excitation, the neuron doesn‟t fire (K. B. Durka 2006). Once generated, the action potential propagates along the axon away from the site of initiation, until
arriving at a synapse. At the synapse, the action potential is transmitted onto the following neuron
either electrically (electrical synapses), i.e., through gap junctions between the two cells, or, most
commonly, mediated by a chemical substance called neurotransmitter (chemical synapse) (figure
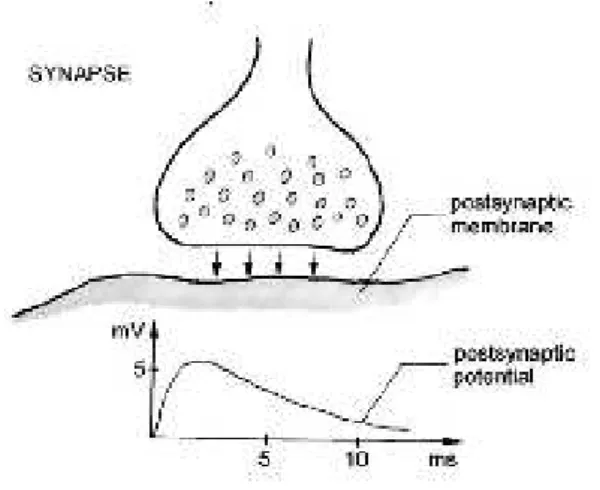
2.2) (Leif Sörnmo 2005). The neurotransmitters which arrive at the postsynaptic membrane generate
a postsynaptic potential (PSP) which can be excitatory (EPSP), when the postsynaptic membrane
becomes depolarized (figure 2.2), or inhibitory (IPSP), when the post-synaptic cell becomes
hyperpolarized. Unlike the action potential, the PSP are graded potentials, their amplitudes being
proportional to the amount of secreted mediator, which depends on the excitation of the input
neuron. EPSP have amplitudes comprehended between 5 to 10 mV and last for 10 to 50
milliseconds (K. B. Durka 2006). Since a neuron can have, as previously mentioned, up to 10000 synaptic contacts with other neurons, it is the summation of the PSP‟s coming from all these synapses that will determine the excitatory or inhibitory effect on the postsynaptic cell (Snell 2001).
The signal registered in an EEG comes from the summation of the postsynaptic potentials of the
neurons in a tissue volume. Although the activity of a single cortical neuron cannot be measured on
the scalp due to the thick layers of tissue (fluids, bone, skin) that lie between the cortex and the
electrode, the joint activity of millions of cortical neurons produces an electrical field which is