UNIVERSIDADE DE LISBOA
FACULDADE DE CIÊNCIAS
DEPARTAMENTO DE BIOLOGIA VEGETAL
A novel reporter of Fgf5
expression to monitor the
"stemness"ground state in
mouse Embryonic Stem cells
Inês Agapito Honório
Dissertação para obtenção do Grau de Mestre em
Biologia Molecular e Genética
UNIVERSIDADE DE LISBOA
FACULDADE DE CIÊNCIAS
DEPARTAMENTO DE BIOLOGIA VEGETAL
A novel reporter of Fgf5
expression to monitor the
"stemness"ground state in
mouse Embryonic Stem cells
Inês Agapito Honório
Dissertação orientada por:
Elsa Abranches, Investigadora pós-doutorada da Unidade de Biologia do Desenvolvimento, Instituto de Medicina Molecular
Júlio Duarte, Professor Auxiliar da Faculdade de Ciências da Universidade de Lisboa
Dissertação para obtenção do Grau de Mestre em
Biologia Molecular e Genética
Gostaria de agradecer ao Professor Domingos Henrique por me ter permitido realizar o projecto de tese de mestrado no seu grupo de trabalho, no Instituto de Medicina Molecular, que tanto me ensinou durante este ano de último ano. Agradeço a forma como me acolheu e me transmitiu a sua visão do que é fazer ciência de forma verdadeiramente inspiradora e sempre com boa disposição.
Um obrigado muito especial à Elsa Abranches, orientadora deste projecto, pela sua inteira disponibilidade e pelas suas preciosas sugestões, o seu rigor científico, persistência e profissionalismo sem os quais eu não teria conseguido realizar este trabalho.
Gostaria também de expressar a minha admiração pela sua dedicação e pelo optimismo e confiança que nem sempre são fáceis de manter quando os resultados não são os que esperamos.
Queria também agradecer ao Filipe que me ajudou principalmente a realizar o processo de clonagem e sempre que tinha dúvidas se mostrava preocupado e pronto para ajudar. Um grande obrigado a todos os membros da Unidade de Biologia do Desenvolvimento, especialmente à Catarina e à Sara, sempre simpáticas e prestáveis. Obrigada UBD por serem um grupo de investigação extremamente dedicado e do qual foi uma honra fazer parte. Agradeço também à Geni pelos seus sábios conselhos quando mais necessitei. Aos meus colegas de mestrado Ana, Joana e Ricardo um muito obrigado por me terem proporcionado grandes momentos de diversão durante estes últimos meses e “aturado” nos dias em que estava desanimada. Apesar de seguirmos cada um o seu caminho tenho a certeza que vamos manter o contacto e poder partilhar óptimas experiencias profissionais e pessoais que se avizinham.
Ao Professor Júlio Duarte agradeço ter aceite ser meu orientador interno e o apoio e interesse que demonstrou por este projecto logo desde o inicio.
Não posso deixar de agradecer a várias pessoas do IMM, que tanto apoio me deram em diversas áreas. Obrigada pelo apoio técnico na microscopia: José Rino e António Temudo e pelo apoio na citometria de fluxo que a Ana Luísa me deu.
Agradeço em especial à minha família, aos meus pais e à Bia que sempre me apoiaram incondicionalmente e nunca duvidaram das minhas capacidades. Sem eles eu nunca teria tido oportunidade de trabalhar naquilo que gosto e ser feliz. Muito obrigada por me tornarem aquilo que sou.
A todos os meus amigos, especialmente às Joanas, à Irina, à Primis, à Sofia e à Justino um grande abraço, obrigado por serem tão compreensivos e me darem tanto apoio tornando os meus dias mais luminosos e divertidos.
Embryonic stem (ES) cells are characterized by their self-renew and pluripotency properties – the stemness state. A complex gene regulatory network (GRN), with three core transcription factors, NANOG, OCT4 and SOX2 (NOS network), underlies this state, but despite extensive work on this GRN, little is still known about how these factors interact in order to maintain it.
Recent work has shown that NANOG expression is heterogeneous in ES cells, while OCT4 and SOX2 seem to be expressed more homogeneously. In addition, NANOG-negative ES cells have a reduced capacity to self-renew and a tendency to differentiate, while cells that constitutively express high levels of Nanog are apparently resistant to differentiation stimuli. These facts suggest that NANOG has a crucial functional role in stemness maintenance and show the necessity of understanding how different levels of Nanog expression control an ES cell’s response to differentiation cues.
Previous studies with FGF/ERK inhibitors have shown that the inhibition of this pathway enhance ES cells growth1. Thus, once activation of ERKs apparently impairs self-renewal, FGF/ERK pathway is one of the cues that has to be blocked in order to maintain ES cells in the stemness state and prevent differentiation.
Since both the NOS network and the FGF/ERK pathway play a decisive role in controlling the stemness potential of ES cells, it is essential to better understand the relationship between the two pathways. To achieve this, ES cell lines that allow the monitoring, in real-time, of the stemness and differentiation potentials are essential. In this work, I have developed novel ES cell lines that allow the real-time visualization of NANOG and FGF5 expression, the first as an indicator of stemness and the second as a marker of commitment to differentiation. These cell lines have been validated regarding their stemness potential and the adequacy of the reporters and shall help to unveil the complex gene network behind stemness by the analysis of movies in which the dynamic of the genes may be followed.
Células estaminais embrionárias são um tipo particular de células estaminais com origem no botão embrionário do blastocisto e que quando mantidas in vitro, sob condições de cultura
específicas, têm a capacidade de manter a sua “estaminalidade” que se resume a duas
características fundamentais: a competência para diferenciação em várias linhagens (pluripotencialidade), e a capacidade de auto-renovação. Estas células, devido às suas características têm um enorme potencial terapêutico, mas para que tal aconteça é imperativo perceber de que forma emergem estas células com propriedades tão específicas. Na origem da estaminalidade encontra-se uma rede genética complexa, cujo núcleo central pode ser reduzido a três genes codificando os factores de transcrição: NANOG, OCT4 e SOX2 (NOS). No entanto, continua por desvendar de que forma a interacção concertada destes factores mantém o estado estaminal. Sendo assim, actualmente, o desafio reside na compreensão do comportamento dinâmico da rede NOS, bem como nas propriedades emergentes que estão na base do estabelecimento e manutenção do estado “estaminal”.
Estudos recentes2 indicam que a sinalização FGF paralela pelas vias JAK/STAT e PI3K
mantêm a pluripotência nas ES enquanto a sinalização ERK a destabiliza. Isto sugere que as vias activadas por FGFs possam ter funções antagónicas, uma vez que a sinalização Erk é também uma das vias activadas por FGFs responsáveis pela saída para diferenciação. Dado que tanto a rede regulatória NOS como a via de sinalização FGF/ERK têm um papel fundamental na decisão das células ES iniciarem a diferenciação ou de se manterem num estado estaminal, torna-se evidente a necessidade da análise da interacção destas duas vias. Mais especificamente, torna-se essencial, compreender de que forma as flutuações dos níveis de expressão de Nanog conduzem a variações no estado de estaminalidade das células ES, bem como influenciam a sua receptividade aos diferentes estímulos de diferenciação, tais como os proporcionados pela via FGF/ERK.
Para atingir este objectivo, é crucial monitorizar, em tempo real, os níveis de expressão de
Nanog em células ES individualizadas e, simultaneamente, medir a capacidade de cada
célula para entrar em diferenciação. Para tal, é necessário monitorizar o gene Nanog (de modo a verificar o seu carácter oscilatório) e o gene Fgf5 (como repórter da actividade FGF/ERK e da decisão de diferenciação). A ferramenta utilizada foi a construção de duas novas linhas celulares (NdF e E14F) com repórteres fluorescentes dos dois genes de interesse.
Uma linha celular que contem um repórter fluorescente de NANOG (linha celular Nd), foi
anteriormente estabelecida e validada no laboratório27. Durante a realização deste projecto,
desenhou-se um BAC para o gene Fgf5, que possa ser electroporado na linha celular Nd, de forma a produzir uma linha celular que seja duplamente repórter da actividade de Nanog e
Para preparar o BAC foi inicialmente feita uma tripla ligação de duas metades da cassete FGF5 e do vector pKS. A cassete FGF5 completa foi posteriormente introduzida no BAC FGF5, onde se encontram os elementos promotores do gene, por recombinação homóloga. Anteriormente à introdução do BAC na linha celular Nd, teve que se proceder a um passo de remoção da cassete de selecção das células para que fosse possível, posteriormente, fazer uma selecção utilizando o antibiótico kanamicina cujo gene de resistência existe tanto na cassete do NANOG como na cassete do FGF5. O BAC foi introduzido nas linhas celulares Nd e E14tg2a por electroporação e novas linhas celulares foram estabelecidas e validadas. Por último, a linha celular dupla NdF foi utilizada para monitorizar, em tempo real a expressão dos genes Nanog e Fgf5 durante um período de 12 horas. Nos filmes realizados observam-se flutuações nos níveis de expressão do repórter Nanog:VNP (Venus-NLS-PEST), com células que inicialmente não expressam Nanog a aumentarem os seus níveis de expressão e novamente a voltarem a adquirir um nível basal de expressão. Estas observações indicam um comportamento dinâmico do gene Nanog endógeno, comportamento esse que pode ajudar a explicar o modo de funcionamento da intrincada rede de factores de transcrição subjacente ao estado estaminal. Relativamente aos níveis de expressão do gene Fgf5 inferidos pelos filmes que foram realizados em células NdF, estes parecem ser demasiado baixos para poderem ser monitorizados utilizando um repórter da actividade do gene. Outra hipótese possível é o repórter produzido ser demasiado instável e ocorrer uma degradação precoce do mRNA impedindo que este seja traduzido. Os dados obtidos sugerem que as linhas celulares criadas neste trabalho podem ser utilizadas para monitorizar a saída do estado estaminal, altura em que as células mES iniciam a diferenciação, no entanto, é necessário prosseguir com a completa validação do repórter para o comprovar.
CHAPTER I - INTRODUCTION
1) Embryonic stem cells 1
2) Stemness maintenance in ES cells 2
a) Extrinsic factors 2
b) Intrinsic factors 4
3) Project Goals 6
CHAPTER II - MATERIALS AND METHODS
I. MATERIALS 7
II. METHODS 7
1) BAC preparation 7
2) ES cell culture 13
3) Protein expression analysis 14
4) RNA Expression Analysis 15
5) DNA analysis 16
6) Movies 24
CHAPTER III - RESULTS
1) Cell line preparation 18
2) Establishment of Fgf5:ANP reporter cell lines 20
a) Construction of the Fgf5:ANP BAC 20
b) Establishment of NdF and E14F cell lines 22
c) Validation of the NdF and E14F cell lines 23
3) Live-imaging of NdF ES cells 26
CHAPTER IV - DISCUSSION AND CONCLUSIONS
27
CHAPTER V - REFERENCES
30
Figure 1 Stem cells properties 1
Figure 2 New concept of stemness 3
Figure 3 Principal pathways involved in the maintenance of stemness 5
Figure 4 Fluorescent reporter cell lines generated 6
Figure 5 BAC reporters used 7
Figure 6 Recombinant BAC vectors and screening PCRs 18
Figure 7 Validation of the stemness potential of the novel cell lines 20
Figure 8 Recombineering analysis 22
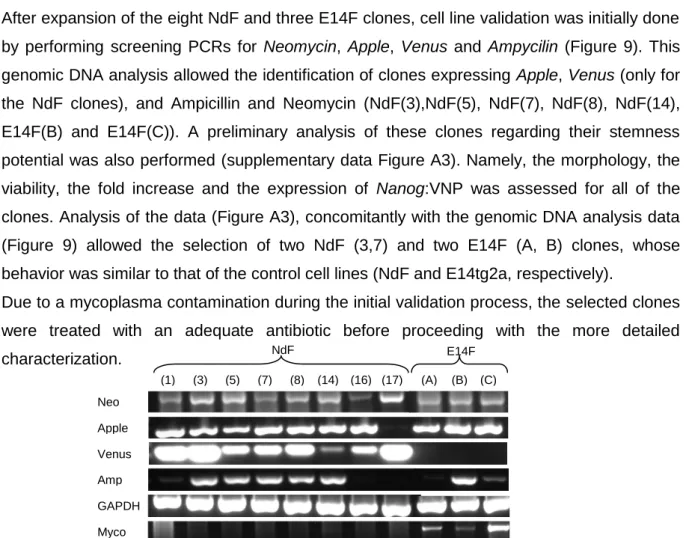
Figure 9 Genomic DNA analysis of novel NdF and E14F ES cell clones 23
Figure 10 Validation of E14F and NdF cell lines regarding their stemness potential 24
Figure 11 RT-PCR analysis of NdF and E14F cell lines 24
Figure 12 Analysis of the temporal expression of Nanog, Fgf5 and Apple at the RNA level 25 Figure 13 Fluorescence Intensity Variations of 3 NdF ES cells 26
Figure A1 Analytic digestions of the 5’HA and 3’HA clones 34
Figure A2 Scheme of the cloning process 35
Figure A3 Preliminary validation of the electroporated clones 35
Figure A4 Analytic gel of preparative digestions of 3’HA, 5’HA and pKS 36
Figure A5 Live-imaging of the expression of Nanog:VNP and Fgf5:ANP 36
Table 1 Cell lines used in this work 7
Table A1 Reagents used in this work 32
3’UTR – 3’ untranslated region Amp – Ampicillin
BAC – Bacterial artificial chromosome BMP – Bone Morphogenetic Protein bp – Base pair
cm – Centimetre
DAPI – 4',6-diamidino-2-phenylindole DMSO – Dymethyl sulfoxide
DNA – Deoxyribonucleic acid
EDTA – Ethylenediaminetetraacetic acid ES cells – Embryonic stem cells
FBS – Fetal bovine serum FGF – Fibroblast growth factor GFP – Green fluorescent protein h – Hours
Hes – Hairy and Enhancer of Split homologues
Kan – Kanamycin M – Molar mg – Milligram min – Minutes mL – Millilitre mm – Millimetre mM – Millimolar
mRNA – Messenger RNA Neo – Neomycin
NLS – Nuclear localization sequence nm – Nanometre
o/n – Overnight ºC – Degree Celsius
PBS – Phosphate buffered saline PCR – Polymerase Chain Reaction PFA – Paraformaldehyde
PFGE – Pulse field gel electrophoresis PTW – PBS and tween solution
Recombineering – Recombinogenic Engineering RNA – Ribonucleic acid
RT – Room Temperature s – Seconds
SSC – Saline-sodium citrate buffer
TBST – Tris-buffered saline and tween solution U – Unit of activity
UTR – Untranslated terminal region UV – Ultraviolet
V – Volt
V/cm – Volt per centimetre v/v – Volume per volume VNP – Venus-NLS-PEST vs – versus
λ – Lambda Phage μg – Microgram μL – Microlitre
Chapter I
1) Embryonic stem cells
Embryonic stem cells (ES cells) are one type of stem cells, derived from the inner cell mass (ICM) of the blastocyst that can be maintained in vitro under very specific culture
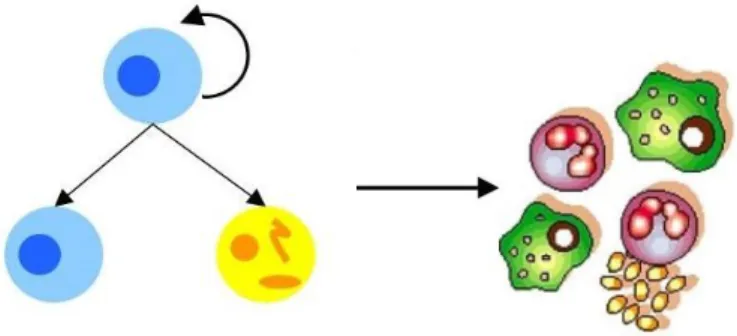
conditions3,4. They are characterized by their self-renewal and pluripotency properties (Figure
1) which are usually defined as “stemness”. Self-renewal entails proliferation with a
concomitant suppression of differentiation, which is revealed in the ES cells ability to generate identical cells5. Pluripotency is the potential of a cell to develop into mature cells from the 3 germ layers, depending on environmental cues. This means that ES cells can self-renew to produce more stem cells and can also divide and differentiate into diverse specialized cell types. In addition, an ES cell is able to functionally reconstitute a given tissue in vivo upon transplantation. Therefore, stem cells are important for the development of the organism and also for its sustained growth.
http://www.math.lsa.umich.edu/~tjacks/research.html
After fertilization, the zygote first divides in 2 cells and then 4 cells that are later asynchronously cleaved generating 8 cells, 16 cells and so on until the formation of the blastocyst, a structure with an internal cavity (blastocoel). The first studies that pointed to the existence of ES cells in mouse blastocyst-stage embryos were the studies of teratocarcinomas, which are germ cells tumors containing undifferentiated stem cells as well as different types of differentiated tissues, resembling a disorganized fetus6. In these initial studies, the undifferentiated stem cells isolated from teratocarcinomas were cultured (losing their malignancy), established and used as in vitro models for mammalian development. Later, the isolation of stem cells directly from mouse embryos without the formation of a
teratocarcionoma stage was attempted and mouse ES (mES) cells were derived4. Afterward,
in 1995, Thomson and co-workers derived non-human primate ES cells7 and only in 1998 the
first human ES cells (hES) were derived from the ICM of normal human blastocysts8. The long period of time between mES cells and hES cells derivation is thought to be due to the lack of information on the appropriate growth factors and cytokines required for hES cells,
Figure 1 Stem cells properties. Stem cells have the capacity to divide and give rise to a cell identical to itself
which results from an incomplete knowledge on the different characteristics of ES cells with different origins. Indeed, mES cells apparently represent a developmentally more naïve pre-implantation state than hES cells; this issue might become a problem when the goal is to extrapolate the results obtained in the mouse to what happens in the human embryos, probably a more primed post-implantation state similar to mouse epiblast-derived stem cells
(EpiSCs)9. However, the differences between mES cells and hES cells are not only on their
potency state but also about the conditions needed to propagate these two types of cells in
vitro. In vitro, ES cells are exposed to a rather different environment than in vivo, which
translates into the exhibition of properties not usually observed in the embryo. For instance, to culture mES cells it is essential the usage of LIF (leukemia inhibitory factor), while for human ES cells, the growth on feeder cells continues to be a requirement. These modifications to the culture conditions are inevitable for the in vitro culture but it is necessary to be careful in the interpretation of these events. Nevertheless, mES cells retain the developmental identity and potential of the epiblast even after prolonged culture. This has been shown convincingly by their complete integration into a developing embryo after being reintroduced into the blastocyst10. mES cells retain full responsiveness to developmental cues and show no intrinsic bias in the generation of different somatic lineages or germline cells upon reintroduction in the embryo, even when they are maintained for long periods of time in culture, which reflects their importance for potential future clinical applications, not only as a great model to study the behavior of ES cells in vitro but also as a model to test new pharmacological drugs. Thus, despite the observed differences, several aspects can be extrapolated between the different species and ES cells with different origins constitute extremely powerful tools to dissect the mechanism by which hES cells maintain their stemness characteristics.
2) Stemness maintenance in ES cells a) Extrinsic factors
Since ES cells were first described, they have been derived and maintained using various combinations of extrinsic factors. Initially the growth of ES cells was dependent on the presence of serum (usually fetal bovine serum (FBS)) and feeder cells, which provide important cytokines and growth factors to maintain ES cells undifferentiated. However, due to the drawbacks of using these supplements, namely variability and possible transmission of infection agents, extensive work has been performed to uncover their essential components. Initial studies were able to determine that the main component produced by feeder cells was the cytokine leukemia inhibitory factor (LIF). Another extrinsic factor that is well known and has been extensively analysed is the cytokine STAT3 (signal transducer and activator of transcription 3), a protein activated through phosphorylation of two residues in response to
various cytokines and growth factors, including LIF. Interestingly recent findings suggest an important role for FGF/Erk signaling in promoting the transition from a naïve to a primed state and in preventing primed cells from reverting to a naïve state, thereby stabilizing the primed state 11,12.
Subsequently, FBS was replaced by a serum free formulation from GibcoBRL (Serum Replacement); but, as this supplement still contains animal derived proteins and is not fully defined, other alternatives were pursued. In 2004, an alternative serum-free medium supplemented with a single growth factor (BMP4) and able to sustain pluripotency, became available (Stem Cell Sciences UK Ltd.). The development of this media took into account a previous report from Ying and co-workers, which showed that bone morphogenetic proteins (BMPs) act in combination with LIF to sustain self-renewal and preserve pluripotency13. Finally, five years later, the same authors showed that self-renewal occurs if differentiation-inducing signaling from mitogen-activated protein kinase (MAPK) are eliminated. By using a combination of two FGF/ERK inhibitors and by adding a glycogen synthase kinase 3 (Gsk3) inhibitor, extrinsic stimuli becomes dispensable for the derivation, propagation and
pluripotency of ES cells14. These factors (SU5402, PD184352 and CHIR99021, that inhibit,
respectively the fibroblasts growing factor receptors (FGFR) tyrosine kinase, the ERK cascade and GSK3) liberate ES cells from requirements of exogenous factors without compromising to developmental potency. The combination of both the SU5402 and PD184352 inhibitors greatly decreases phospho-ERK levels; therefore, this study suggests that the pathways required to sustain undifferentiated ES cells may be regulated by the components of the culture medium.
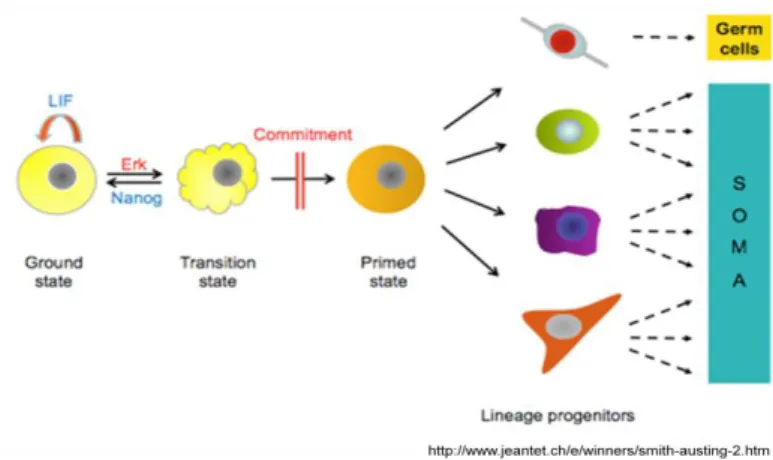
However, the discovery that the three inhibitors eliminate differentiation-inducing signaling from MAPK thereby enabling self-renewal lead to a new concept of stemness, as a ground state that is intrinsically self-maintained if ES cells are protected from differentiation stimuli (Figure 2). This hypothesis suggests that extrinsic stimuli could be dispensable for the derivation, propagation and pluripotency of ES cells14. This concept could point to more rational strategies to induce “stemness” in somatic cells, a technique first describe by Shinya Yamanaka and co-workers in 2006 when they generated Induced Pluripotent Stem (iPS) cells – pluripotent stem cells from differentiated mouse fibroblasts.In 2007, he and his team
were able to generate iPS cells from human adult fibroblasts15
Figure 2 New concept of stemness. ES Cells are kept in an “uninstructed ground state” that is intrinsically self-maintained if cells are protected from inductive differentiation stimuli. Erk is one of the pathways involved in the exit to differentiation while Nanog is a gene involved in the maintenance of the “stemness” state. When ES cells start the commitment process they lose their stemness properties and give rise of one particular progenitor type.
In summary, ES cell self-renewal is usually considered to be dependent on stimulation by several factors14, but underlying the activation of the transcriptional circuitries, triggered by extrinsic cues, is an intricate gene regulatory network that maintains ES cells in a pluripotent state (Figure 3). To discriminate what are the extrinsic or intrinsic factors in the maintenance of stemness is, however, not an easy task.
b) Intrinsic factors
The gene regulatory network (GRN) underlying “stemness” has been extensively dissected,
and a consensual view is that three core transcription factors NANOG, OCT4 and SOX2 (NOS network) function together at the top of this circuitry16(Figure 3). Despite extensive work on this GRN, little is known about the nature and sequence of events along the path to
recreate the “stemness” state, even with the extensive characterization of interacting
partners, downstream targets and auto/cross-regulations between the 3 factors that has been done.
Recent work has shown that NANOG expression is heterogeneous in ES cells17, while OCT4
and SOX2 seem to be expressed homogeneously. Nanog’s heterogeneity could be related to the existence of multiple and possibly interconvertible pluripotent stem cell states controlled by the integration of an intrinsic GRN and the extrinsic signaling environment. The confirmation of this “pluristability” could have a huge impact in developmental biology, but also for the field of reprogramming and induced pluripotency. Extensive characterization of the transcriptional program triggered by Nanog, Oct4 and Sox2 revealed that they function together to sustain the ES cell state by activating other pluripotency genes and repressing differentiation-promoting genes. Nevertheless this is a simplistic model as, for instance, OCT4 and SOX2 also induce FGF4 expression, which in turn acts as an autoinductive signal that drives ES cells to differentiation18.
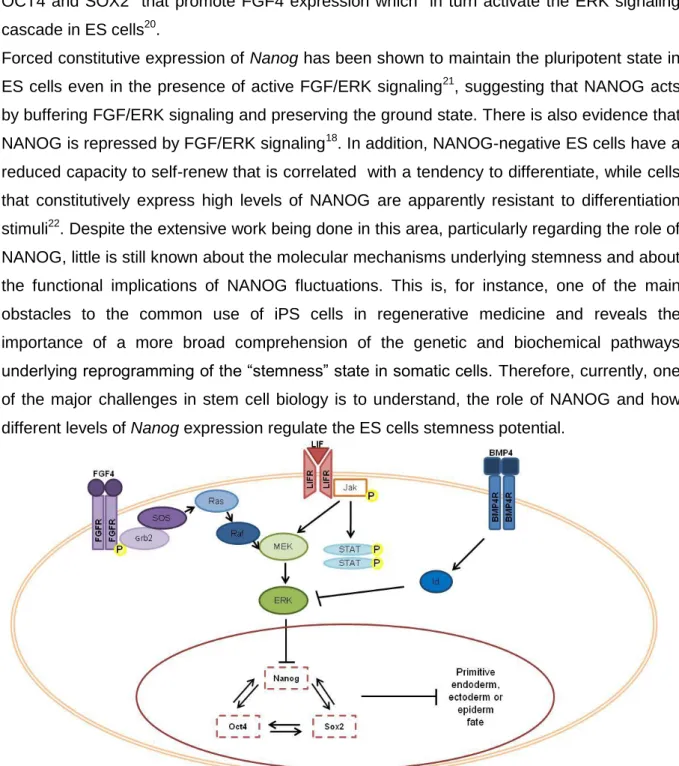
FGF signaling is another pathway that controls fundamental processes such as proliferation, differentiation and migration throughout development, which is activated by a ligand-receptor interaction (Figure 3). This results in the autophosphorylation of tyrosine residues in the intracellular region of an FGF receptor (FGFR), the signal may then be transmitted through four distinct pathways: the Janus kinase/signal transducer and activator of transcription (Jak/Stat); the phosphoinositide phospholipase C (PLCg); the phosphatidylinositol 3- kinase (PI3K); and the Erk pathways. FGF/ERK pathway is one of the signaling pathways recognized to be an essential differentiation stimuli19. It is currently known that the NOS circuitry interact with the FGF/ERK pathway by two of their essential transcription factors, OCT4 and SOX2 that promote FGF4 expression which in turn activate the ERK signaling cascade in ES cells20.
Forced constitutive expression of Nanog has been shown to maintain the pluripotent state in
ES cells even in the presence of active FGF/ERK signaling21, suggesting that NANOG acts
by buffering FGF/ERK signaling and preserving the ground state. There is also evidence that
NANOG is repressed by FGF/ERK signaling18. In addition, NANOG-negative ES cells have a
reduced capacity to self-renew that is correlated with a tendency to differentiate, while cells that constitutively express high levels of NANOG are apparently resistant to differentiation stimuli22. Despite the extensive work being done in this area, particularly regarding the role of NANOG, little is still known about the molecular mechanisms underlying stemness and about the functional implications of NANOG fluctuations. This is, for instance, one of the main obstacles to the common use of iPS cells in regenerative medicine and reveals the importance of a more broad comprehension of the genetic and biochemical pathways underlying reprogramming of the “stemness” state in somatic cells. Therefore, currently, one of the major challenges in stem cell biology is to understand, the role of NANOG and how different levels of Nanog expression regulate the ES cells stemness potential.
Figure 3 Principal pathways involved in the maintenance of stemness. Intrinsic and extrinsic factors are
3) Project goals
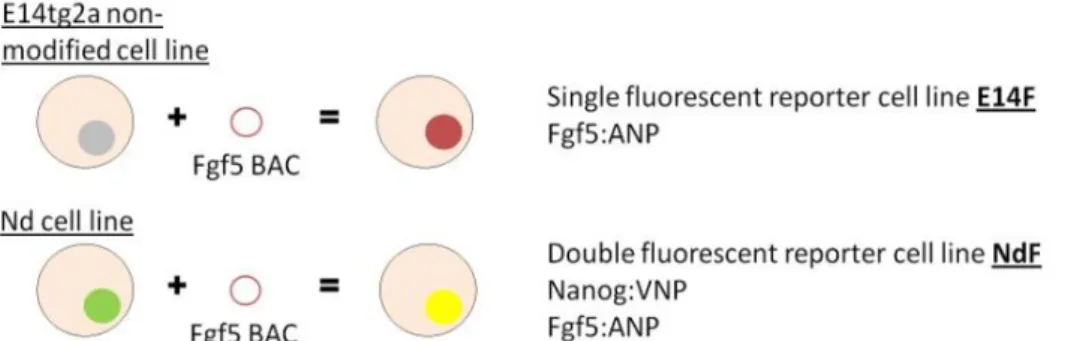
The main goal of this project is to contribute to understand the functional role of NANOG heterogeneous expression by establishing novel reporter ES cell lines. The starting point was the reported heterogeneity of Nanog expression levels in both ES cells and ICM cells from the blastocyst17,23. Additionally, studies that show the existence of fluctuations in Nanog expression levels point out to a possible oscillatory behavior of Nanog gene’s activity17. In order to unveil the functional role of Nanog in ES cells, ES cell lines that allow real-time visualization of NANOG and FGF5 expression, the first as an indicator of stemness and the second as a marker of commitment to differentiation were established. Two different cell lines were designed (Figure 4), a single reporter cell line that allows the monitoring of FGF5 expression levels and a double reporter cell line of NANOG and FGF5 expression. The parental cell lines used were: E14tg2a cells, a non-modified ES cell line24, and Nd cells, a
Nanog:VNP reporter ES cell line, previously established in the lab25. The designed FGF5 BAC was introduced into the E14tg2a cell line, in order to establish a single Fgf5 reporter cell line that could be useful in further studies of the Fgf/Erk pathway, and into the Nd cell line, to establish a double reporter of Nanog and Fgf5. In the FGF5 BAC the fluorescent reporter Apple” is unstable, to allow a faithfully analysis of the Fgf5 transcriptional activity, and is under the control of the Fgf5 promotor gene. The cell lines were validated and used for live imaging. By using confocal microscopy we were able to monitor the behavior of isolated cells for periods of approximately 12-24h, allowing the measurement in real time of the transcriptional activity of the fluorescent reporters.
With this approach, I hope to prove that NANOG expression levels do fluctuate in ES cells, reflecting the activity of the NOS network behind the stemness state and correlate these fluctuations with the FGF/ERK pathway.
Figure 4 Fluorescent reporter cell lines generated. In this project two cell lines have been generated as tools to
help assess the functional role of Nanog expression in ES cells; a single fluorescent reporter cell line E14F and a double fluorescent reporter cell line NdF.
Chapter II
I. MATERIALS
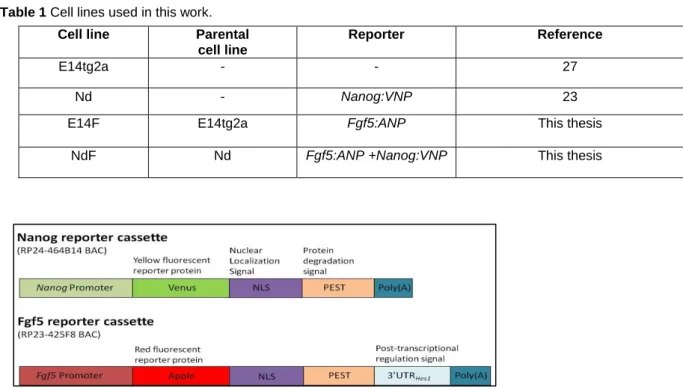
The cell lines used in this work are described inTable 1and the BAC reporters used are
presented in Figure 5. In the Appendix section, a list of reagents used in this work may be seen (Table A1) as well as a list of the oligonucleotides (Table A2).
Table 1 Cell lines used in this work.
Cell line Parental
cell line
Reporter Reference
E14tg2a - - 27
Nd - Nanog:VNP 23
E14F E14tg2a Fgf5:ANP This thesis
NdF Nd Fgf5:ANP +Nanog:VNP This thesis
II. METHODS 1) BAC preparation
The FGF5 BAC (RP23-425F8) was purchased at BAC|CHORI database and was engineered to express a bright, far-red, unstable reporter (ANP, Apple-NLS-PEST) under the control of the FGF5 promoter (Figure 5). This BAC was generated by recombineering techniques and was later introduced into the ES cell lines by electroporation.
To prepare the BAC, a 3 piece ligation was initially made, where the 5’ and 3’ halves of the
FGF5 cassette were simultaneously linked to the pKS vector.
Subsequently the FGF5 cassette was transferred, by recombineering, to the FGF5 BAC, where the Fgf5 promoter is integrated.
a) 3 piece ligation
i. Transform bacteria with the plasmid containing the Fgf5 3’ Homology Harm (HA) and
another one with Fgf5 5’ HA;
(i.i)Transform Bacteria with plasmids (on sterile conditions) 1. Spin-down the plasmid-containing tube;
2. Add 5 μl of plasmid to 100 μl of Bacteria (previously thawed on ice). Gently tap the tube a couple of times to mix;
3. Leave on ice for 15-30 min;
4. Heat-shock for 30 sec. (in the bath at 42ºC); 5. Put on ice for 2 min;
6. Add supplemented SOB medium; (900 μl for 100 μl of Bacteria); 7. Spin at 37ºC for 45-60 min in the incubator;
8. Seed 100 μl, use the glass loop to spread the inoculums1; 9. Place in the incubator, at 37ºC o.n.;
10. Next morning check for the formation of clones.
ii. Pick two isolated clones to a 2,5 ml LB tube supplemented with ampicillin (100µg/ml)
and grow o.n. at 37C;
iii. On the next day extract plasmids using the Miniprep DNA Purification System;
iv. Make confirmative digestions (1h30’ at 37C and then transfer the eppendorfs to the
-20C);
v. Precipitate the rest of the DNA (not used in the confirmative digestions) and
dephosporilate the vector to prevent recircularization in the absence of the insert. (v.i) DNA precipitation
1. Add 1:10 of Sodium Acetate 3M to the DNA; 2. Add the double of this volume of ethanol 100%; 3. Vortex and freeze at -20ºC during 1h;
4. Centrifuge 30 min at 13000 rpm;
5. Discard the supernatant and add 500 µl of ethanol 70%; 6. Centrifuge 10 min at 3000 rpm;
7. Discard the supernatant and centrifuge again 3 min at 13000 rpm; 8. Discard the supernatant and air-dry;
9. Ressuspend in water. (v.ii)Dephosphorilation
1. Add 5µl of Cip (Calf intestinal phosphatase) Buffer 10x, 1µl of BSA, 2µl of Cip to a total DNA mix of 50µl and incubate for 1h30min at 37ºC;
2. Store the tubes at -20ºC until further use.
1
vi. Do preparative digestions: EcoRI-HindIII for the 5HA; EcoRI-Acc65I for the 3’HA; and HindIII-Acc65I for the vector pKS;
vii. Make a preparative agarose gel (1% agarose) and run the digested DNAs;
viii. Cut the bands with the right size from the gel and purify the isolated DNAs using the
Wizard SV Gel and PCR Clean-Up System;
ix. Dilute the pKS vector (1:10) and do an analytic gel to assess the relation between the
concentrations of the vector and the two inserts after the purification (in the ligation reaction it is recommended to use a proportion of vector:insert of 1:3);
x. Do the ligation reaction (15ºC o.n.) with the vector, the inserts and the ligase enzyme
using as a control a mix with no inserts;
xi. On the next day transform bacteria with the product of the ligation reaction;
xii. Plate o.n. at 37ºC in LB plates supplemented with ampycilin2;
xiii. Pick 8 isolated colonies of the 3-piece ligation, plate and grow them in LB
supplemented with ampicillin (37ºC o.n.);
xiv. The next morning do minipreps (Promega Wizard Plus SV Minipreps kit cat#A1460).
for each one of the clones picked;
xv. Perform analytic digestions: PvuII enzyme with PstI and EcoRV-Acc65I (37º, 1h30’),
to confirm that the clones have the right insertion;
xvi. Grow one of the clones with the right digestion pattern in 100mL of LB supplemented
with ampicillin;
xvii. Do midipreps from these bacteria (Genopure Plasmid Midi Kit/ Roche
cat#03143414001).
b) Recombineering
i. Measure the concentration of the midiprep product in the nanodrop and digest 20µg
of DNA;
i. Prepare the DNA for recombineering by doing a preparative digestion with
HindIII/Acc65I (2h at 37º);
ii. Run the product of the digestion in a preparative gel;
iii. Extract the bands of the gel and purify (Promega Wizard SV gel and PCR Clean-Up
System cat#A9281);
iv. Repeat the digestion with HindIII/Acc65I to ensure that the DNA that will be
electroporated has no contaminations;
v. Repeat steps iii and iv;
vi. Measure the product concentration in the nanodrop;
2
Three different controls should be made: a control of the ligation reaction with only the vector and no inserts and two controls of the preparative digestion with only each one of the inserts.
vii. Precipitate the FGF5 BAC in 20µl to minimize the volume used (avoiding the dilution of the bacteria during recombineering)3;
viii. Streak bacteria with FGF5 BAC;
ix. Make a pre-inoculum of 10 ml from 2 different colonies in LB low salt supplemented
with ampicillin and tetracycline;
x. Make an inoculum in 50 ml LB low salt + 1ml of the pre-inoculum supplemented with
20µl of ampicillin and 108µl tetracyclin and measure the optic density of the
inoculums until it reaches OD600 of 0,5-0,6 (use the remaining pre-inoculum to extract
BAC DNA and use as a control in the PFGE);
xi. Induce bacteria by placing a falcon with 10ml of the inoculum 15min at 42ºC and perform a negative control by placing another falcon with 10ml of the inoculum 15min at 32ºC;
xii. Put both the induced and negative control bacteria 5 min on ice to stabilize;
xiii. Centrifuge 8 min at 4000 rpm at 4ºC;
xiv. Ressuspend in 1ml of sterilized water;
xv. Centrifufe 1 min;
xvi. Repeat steps xv and xvi;
xvii. Ressuspend in 100 µl of water;
xviii. Transfer 50 µl of bacteria to an eppendorf and add 300ng of DNA;
xix. Transfer the mix to an electroporation couvette and electroporated (1800V,
25mF,200Ω);
xx. Put the electroporated bacteria on ice, 5 min;
xxi. Add 500 µl of LB to the couvette and incubate 1h30min at 32ºC;
xxii. Plate 50µl of the induced and negative control bacteria in half a plate of LB supplemented with kanamycin (32ºC o.n.);
xxiii. Centrifuge and ressuspend the pellet in 50 µl and plate it on the other half of the plate;
xxiv. Pick 6 colonies from the kanamycin plate and grow them in 10 ml LB supplemented
with kanamycin (30º o.n.);
xxv. Make glycerols of the clones that grew;
xxvi. Do BAC minipreps with the rest of the inoculums (also do a miniprep from the
negative control bacteria);
xxvii. Quantify the DNA in the nanodrop;
xxviii. Perform four confirmative digestions: SalI, EcoRV, XhoI and AgeI (6h at 37º) and run
the digestion products in a Pulsed field gel electrophoresis (PFGE);
3
As a negative control of the digestion, bacteria with the Fgf5 cassette should be transformed and plated in LB supplemented with kanamycin (the resistence marker of the pKs).
xxix. Make two confirmative PCRs. Make the reaction mix for a total of 25µl: 12,25µl of
miliQ H2O, 1µl of each primer, 2,5µl of PCR buffer 10x, 0,5µl of dNTPs 10mM, 0,25µl
of Taq polymerase, 2,5µl of DMSO and 5µl of the template. The DNA control PCR conditions are: 94ºC 5min, 5x (94ºC 1min, 55ºC 1,5min, 72ºC 0,5 min), 30x (94ºC 1min, 65ºC 1,5min, 72ºC 0,5 min), 72ºC 10min. Screening PCR conditions: 94ºC 5min, 30x (94ºC 1min, 50ºC 1,5min, 72ºC 45sec), 72ºC 10 min.
c) BAC DNA Preps for electroporation in ES cells
i. Streak the FGF5 BAC in a kanamycin plate and grow at 30ºC, o.n.;
ii. Pick two colonies and pre-inoculate in 5 ml of LB supplemented with kanamycin;
iii. Use one of the pre-inocula to inoculate 400 ml LB supplemented with 400µl
kanamycin, and grow o.n. at 30ºC;
iv. Transfer the culture to 50 ml falcons;
v. Discard the supernatant; ressuspend each pellet in 8 ml of ressuspension buffer (PI
solution) supplemented with RNasA solution(Genopure Buffer Set/ Roche);
vi. Add 8ml of lysis buffer (P3 solution) to each tube and gently invert up and down several times to mix the contents, leave at room temperature (RT) for no longer than 5 min;
vii. To each tube individually add 8 ml of neutralization solution (P4 solution) and gently
but immediately rock the tube back and forth several times until all the P2 solution turns white, 1h on ice;
viii. Centrifuge 15 min at 3750 rpm at 4ºC;
ix. Carefully transfer each supernatant to a new falcon tube passing it through a double
sheet of autoclaved muslin;
x. Centrifuge again 15 min at 3750 rpm at 4ºC;
xi. Transfer the supernatant (avoid transferring any white precipitate material) to a falcon
tube passing it through 4 sheets of autoclaved muslin;
xii. Add equal volume of ice-cold isopropanol per falcon;
xiii. Mix by inverting the tube a few times and leave 5 min at RT; confirm that the isopropanol was mixed;
xiv. Centrifuge at 3750 rpm for 15 min at 4ºC;
xv. Remove the supernatant and add 500 µl of ethanol 70% ice-cold. Centrifuge at 3750
rpm for 15 min at 4ºC;
xvi. Remove the supernatant and pulse spin at 3750 rpm; remove any remaining
xvii. Add 250 µl of filtered Tris EDTA (TE) to each tube to dissolve the pellet (10 min at RT without ressuspension with the pipette), after the pellet is dissolved use cut tips to pool the DNA into eppendorfs;
xviii. Add 300 µl of 4,4 M LiCl, mix and leave it on ice for 30 min. Centrifuge at 3750 rpm
for 15 min at 4ºC (to precipitate the RNA);
xix. Transfer the supernatant to new eppendorfs;
xx. Add 12,5 µl of 20% (w/v) SDS to each tube, mix and incubate at 70ºC for exactly 10
min and leave it 5 min at RT;
xxi. Add 500 µl of phenol chloroform pH 7,9 to each tube; carefully invert the tube 8 times;
xxii. Spin 5 min at 13200 rpm, remove the supernatant to a new eppendorf (using a cut tip);
xxiii. Repeat the last two steps and add 1 ml of ice-cold 100% ethanol, mix by inverting the
tube 4 times; at this stage half of the tubes should be stored in 100 % ethanol as a backup stock and the other half should be spined 15 min at 13200 rpm;
xxiv. Remove the supernatant and add 1 ml of 70% ethanol at RT to each tube and mix by
inverting 4 times to wash the DNA pellets;
xxv. Spin 5 min at 13200 rpm;
xxvi. Remove as much of the supernatant as possible4;
xxvii. Air-dry the pellets 5 min at RT and ressuspend in 100 µl MiliQ water. Flick and wait.
(Do not resuspend mechanically the pellet, let it dissolve);
xxviii. Measure the samples on nanodrop.
d) Preparation for electroporation
i. Centrifuge the DNA 30 min at 1300 rpm and discard the supernatant;
ii. Add 500 µl of ethanol 70% and centrifuge 10 min at 1300 rpm;
iii. Discard the supernatant and centrifuge 3 min at 1300 rpm;
iv. Pipette the supernatant and discard it, let the pellet air-dry;
v. Resuspend the pellet in 100 µl of microinjection buffer supplemented with spermine and spermidine.
e) Dialysis
i. Cover the well of a 6 well dish with microinjection buffer supplemented with spermine
and spermidine;
ii. Put a dialysis membrane floating over the microinjection buffer;
iii. Pipette a drop of 50 µl of the BAC DNA solution on each dialysis membrane;
iv. Leave it 3h at RT in a sterile environment (preferably in a flow hood);
4
Occasionally pellets will become dislodge from the tube so it is preferable to carefully aspirate off the supernatant rather than pour it off.
v. Recover the BAC DNA solution carefully from the top of the dialysis membrane with a blunt tip and store it at 4ºC.
2) ES cell culture a) ES cells expansion
1st Day: Thawing of frozen ES cell vials (~3x10⁶ cells/vial);
i. Heat 10 ml GMEM 1x + LIF (1:500) in the 37ºC water-bath;
ii. Add 0.1% gelatin to a 60mm dish (coat for minimum of 10 min);
iii. Remove cells from liq. N2 and place in the 37ºC water-bath for ~ 1min;
iv. Add 4ml of heated medium, resuspend and spin cells down (2 min, 1000 rpm);
v. Resuspend cells in 5ml GMEM 1x + LIF and transfer to the 60mm dish after removing
the gelatin;
vi. Grow ES cells at 37ºC in a 5% (v/v) CO2 incubator.
2nd Day: 6-12 hours later, change the medium supplemented with LIF (1:500);
3th Day: Passage cells5.
i. Wash cells twice with PBS;
ii. Add enough 0.1% trypsin to cover the cells, and place in the incubator for 2–3 min;
iii. Knock the flask several times to dislodge cells and check under inverted microscope
to ensure the cells have dissociated;
iv. Add GMEM 1x to stop trypsinization, resuspend cells by pipetting up & down and spin
cells down (2 min, 1000 rpm);
v. Resuspend cells in GMEM 1x and count the cell number and corresponding viability
using a Neubauer chamber and trypan blue dye;
vi. Plate cells at the desired cell density (for expansion ~ 3 × 10
4
cells/cm2)in GMEM 1×
+ LIF (1:500) on fresh gelatin-coated dishes6.
b) ES cell differentiation through EBs
1stDay: i. Plate 2x10⁴cells/cm2 (~1.5x10⁵ cells/ml) in 4ml (P60mm) in GMEM 1x medium
on bacterial grade dishes; Collect cell samples depending on analysis to be made;
2nd Day: Check all plates to ensure EBs have formed;
3thDay: i. Check all plates to ensure EBs are healthy;
5
Cells should be passaged when confluence reaches ~70-80%, which usually happens every two days when cells are plated at 3x10⁴ cells/cm2
6
Frozen ES cell stocks should be carefully frozen at 10% DMSO, which should be diluted separately with half of the volume GMEM used to freeze the cells once it is an exergonic reaction.
ii. Change media (this should be done every two days until the end of the assay): collect EBs into a conical tube, allow for EBs to sediment (~ 5 min), remove the supernatant; add fresh medium and transfer EBs to a new bacterial grade dish.
To count cells and collect samples for analysis:
i. Collect EBs into a conical tube, remove the medium and wash EBs twice with PBS;
dissociate by incubating with 500 µl of 4 trypsin for 5 min in a 37ºC water bath; add 5 ml GMEM 1x to the cells to stop trypsinization; pellet the cells by centrifugation (1000 rpm, 3 min);
ii. Ressuspend the pellet with fresh complete medium and dissociate EBs by gently
pipetting. Allow 5 min for undigested EBs to sediment at the bottom of the tube, and then carefully remove the upper portion that contains mainly single cells to a new tube;
iii. Count cells using Neubauer chamber and trypan blue dye.
c) BAC transgenic ES cell line generation
i. Electroporate 5x10⁶ cells of E14tg2a and NdCreA7 cell lines with the BAC and 2,5x10⁶ cells without the BAC to serve as a control of the electroporation7;
ii. Plate the electroporated cells in gelatin-coated P90 dishes (two P90 for the
electroporated cells and one P90 for the negative control);
iii. Start selection 24h later by adding geneticin (G418) at a final concentration of 0,2 mg/ml to GMEM 1x supplemented with LIF and maintain it until individual clones are observed by eye (usually 14-20 days);
iv. Pick and expand individual resistant colonies and freeze one vial of each clone.
3) Protein expression analysis
a) Fluorescence activated cell sorting
i. Resuspend 5x10⁵ cells in FACS buffer (~300 µl);
ii. Analyse on a FACS Calibur Cytometer 8 ;
iii. After perform the measurements analyze the data using the FlowJo program.9
b) Immunostaining on Coverslips
i. Place coverslips into the wells of a 24-wells plate10;
7
Electroporation conditions: 250V; 500µF; High capacitance
8
Live cells were gated based on forward scatter and side scatter and by propidium iodide dye exclusion.
9
VNP+ populations were gated only from the live fraction(Abranches et al., 2009).
10
First fill the wells with PBS (300-500 l), then carefully lower down the coverslips to the bottom of the well, cell side up. At each wash, aspirate the liquid from the corner of a well, trying not to disturb the cell layer which
ii. Wash twice, for 5 min, with PBS;
iii. Fix with PFA 1-4 %, for 15 min at 4 ºC or 10 min at RT;
iv. Wash twice, for 5 min, with PBS;
v. Wash the PFA residues with freshly prepared 0.1M glycine in PBS, for 10 min at RT;
vi. Incubate with 0.1% triton in PBS for 10 min at RT;
vii. Wash twice, for 5 min, with PBS;
viii. Block with 10% FCS in TBST for 30 min at RT;
ix. Prepare the immuno dish (the lid from a square Nuncaton dish 24.5x24.5 cm) with
3MM paper imbibed in PBS. Place parafilm paper (transparent side faced up) over the 3MM paper;
x. Place 15 µl of the primary antibody (diluted to a working concentration with blocking
solution) onto the parafilm and place the coverslips over it with the cells side down. Cover the dish and incubate for 1 hour at RT or o.n. at 4ºC;
xi. Transfer the coverslips to the 24-well plate, cell side up, and wash three times, for 5
min, with TBST;
xii. Place 15 µl of the secondary antibody diluted in blocking solution, onto the parafilm
and place the coverslips over it, cell side down. Incubate for 30 min at RT. From this step on, protect the coverslips from light;
xiii. Transfer again the coverslips to the 24-wells plate, cell side up, and wash three times, for 5 min each, with TBST;
xiv. Aspirate the last wash and place a 50-µl drop of DAPI solution in water (15:10 000
dilution of a 1 mg/ml stock) for 5 min at RT;
xv. Wash three times with TBST;
xvi. Carefully dry the coverslips with a tissue and place them, cells side down, over a small drop of mounting medium (e.g. mowiol), placed beforehand on a slide. Isolate each coverslip with varnish.
4) RNA Expression Analysis
a) Isolation of Total RNA from Cultured Cells
i. Collect total RNA from cell samples using the High Pure RNA isolation Kit/Roche (cat#11828665001) according to the manufacturer’s instructions;
ii. Verify RNA integrity by agarose gel electrophoresis and quantify by UV
spectrophotometry.
otherwise will float. When filling the well containing a coverslip, never discard the liquid directly over the coverslip. Use a plastic Pasteur pipette instead of 1-ml Gilson tips.
b) Reverse Transcription of RNA
i. Reverse transcribe RNA using superscript II Reverse Transcriptase/Invitrogen (cat#
18064-014) and random hexamer primers, according to the manufacturer’s
instructions.
c) Polymerase chain reaction (PCR)
PCR was used during this work to verify the expression of several genes in the cell lines used. PCR was also used to confirm the product of cloning (PCR primers were designed for the specific target sequence on the insert DNA).
Reactions were prepared to a final volume of 25μL (1ng template plasmid DNA, 1x buffer, 0.2mM dCTP, 0.2mM dGTP, 0.2mM dATP, 0.2mM dTTP, 25pmol of each primer and the necessary volume of Polymerase). In some cases 10% DMSO was added to the reaction mix to improve product specificity. The enzyme used for standard PCR was dreamTaq DNA Polymerase (GE Healthcare) except to perform Myco PCR where was used rTaq DNA polymerase (GE Healthcare).
5) DNA analysis
a) Genomic DNA11
i. Wash confluent monolayer 90 mm ES cell dish twice with ice-cold PBS and
immediately lise cells with 1 ml of SNET containing 400 g/ml proteinase K;
ii. Transfer to Falcon tubes and incubate o.n. at 55 oC on a rocking platform;
iii. Add equal volume of phenol:chlorophorm:isoamyl alcohol, seal top of the tube and
place it on a rocking platform for 30 min at RT;
iv. Separate the organic and aqueous phases by centrifugation 5 minutes at 1600 rpm
for at RT;
v. Precipitate DNA by adding an equal volume of isopropanol. Collect the precipitated
DNA by centrifugation at 12000 rpm for 15 min at 4 oC;
vi. Remove isopropanol, wash the pellet with 1 ml of 70% ethanol, briefly centrifuge and allow the pellets to dry in air for 15-20 min at RT (Do not overdry DNA pellets); vii. Dissolve the nucleic acid pellet by rocking it gently o.n. in 0,5 ml of TE at 4oC.
b) Mycoplasma Detection
i. Collect ~1x10⁶ cells in a 1.5ml microtube. Centrifuge 2min at 13000 rpm;
ii. Resuspend cells thoroughly in wash buffer;
iii. Centrifuge again as above;
11
DNA preps were performed according to Sambrook& Russel (Modification of original method of Brinster & Palmiter for DNA from mouse tails)
iv. Discard supernatant and put cells at -20ºC until needed;
v. Resuspend cells in 50 l of solution A+B (1:1) and incubate for 1h at 60ºC,
inactivate for 10min at 90ºC (samples can be kept at -20ºC until amplification)12; vi. Make the reaction mix for a total of 25µl volume: 16µl of miliQ H2O, 1µl of each
primer, 2,5µl of PCR buffer 10x, 1µl of dNTPs 10mM, 0,4µl of Taq polymerase and 3µl of each sample. The PCR conditions are: 95ºC 5min,30x (95ºC 30sec, 58ºC 1.5min, 72ºC 1.5min),72ºC 10min,Gel 1% agarose; run at 60V for 30min.
6) Movies
i. Add 300 µl of gelatine 0,1% to a MatTek plate Φ 14;
ii. Carefully remove the gelatine and wash with PBS;
iii. Add 250 ml of cells at 104 cells per cm2 and put the plate in a conventional CO2
incubator;
iv. Allow ES cells attach to the plate and, 3h later add 2ml of GMEM supplemented with
LIF (1:500);
v. Prepare the spinning disk apparatus and film the cells during 14h with the inverted microscope Andor Revolution spinning disk confocal microscope, objective 60x, in a chamber kept at 37 C. The system must be equipped with an incubator for CO2
supply that allow the maintenance of 5% CO2 inside the chamber;
vi. Analyze the data using ImageJ software.
12
DNA preps used in this protocol are based on use of proteinase K. When proteinase K is not fully inactivated false-negative results may appear by degrading Taq polymerase in the reaction mix. To avoid this, we routinely perform PCR amplification of each sample with primers for mycoplasma and primers for a house-keeping gene, such as GAPDH. Only those samples that produce no band in mycoplasma PCR and a band in GAPDH PCR are considered as mycoplasma-free.
Chapter III
(B)
(C)
To understand the role of Nanog expression in the maintenance of stemness in ES cells, it is imperative to unveil how different NANOG expression levels correlate with ES cells receptivity to differentiation stimuli.
To achieve this goal it is crucial to monitor, in real time, the expression levels of Nanog in individual ES cells and, simultaneously, measure the capacity of each cell to enter differentiation. For that it is necessary to use a live FR of Nanog expression that faithfully reflects the transcriptional activity of the gene and a marker of stemness state exit, such as FGF5.
Previously in the lab, a cell line that contains a faithful FR of NANOG (Nd cell line) was established and validated. In this project, I have designed a FGF5 reporter by BAC recombineering (see section 2a in this chapter) and I have electroporated it into E14tg2a and Nd Es cell lines in order to produce, respectively, a single Fgf5 reporter ES cell line and a double reporter ES cell line of Nanog and Fgf5 (see sections 2b and 2c in this chapter). In order to prepare the Nd cell line electroporation, an intermediate step was required (see section 1 in this chapter) to remove the resistance cassette.
Finally, the novel cell lines with the Fgf5:ANP reporter were used to monitor, in real time, the expression of Nanog and Fgf5 genes (see section 3 in this chapter).
1) Cell line preparation
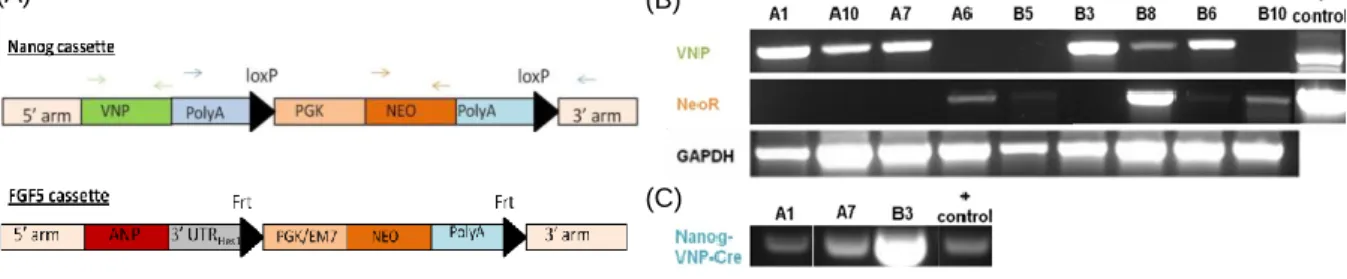
Both Nanog:VNP and Fgf5:ANP BACs share the same resistance marker (neomycin) (Figure
6.A). Therefore, in order to enable Fgf5:ANP positive clones selection, upon electroporation
of the FGF5 BAC into the Nd cell line, the neomycin cassette of the Nanog:VNP BAC, and that was still present in the Nd cell line, had to be excised.
The extraction of the selection cassette had previously been done in the lab and 9 ES cell clones were generated (NdCre clones). In order to choose the most suitable NdCre cell line to use, several analyses were performed.
Figure 6 Recombinant BAC vectors and screening PCRs. (A) Scheme of the Nanog:VNP and Fgf5:ANP cassettes containing the selection cassettes flanked by two loxP sites or two Frt sites respectively. Green arrows correspond to the annealing site of the primers used for the VNP PCR; orange arrows correspond to the NeoR primers and the blue arrows correspond to the Nanog-VNP-Cre primers. (B) Screening PCRs for VNP and NeoR performed to confirm in which clones the selection cassette was properly excised. (C) Screening PCR for Nanog-VNP-Cre for the clones that had showed a proper pattern of expression in (B) (a band in the VNP PCR and no band in NeoR PCR).
The initial screen of all 9 NdCre clones was performed by PCR. Three essential PCRs to confirm which clones had properly excised the cassette were done (Figure 6B): (i) PCR to confirm the absence of neomycin cassette (the resistence marker); (ii) PCR to confirm the presence of VNP; and a (iii) PCR to confirm that all the VNP cassette was correctly integrated. Analysis of the results showed that only 3 of the clones (NdCre A1, NdCreA7 and NdCreB3) had correctly excised the selection cassette: in these clones no band was amplified in the Neo PCR and a band with proper size was observed VNP and for Nanog-VNP-Cre PCRs.
From the three clones, two were selected, (NdCreA7 and NdCreB3) to proceed with the validation regarding their self-renewal and pluripotency properties (Figure 7). The original Nd cell line was used in all experiments as a control.
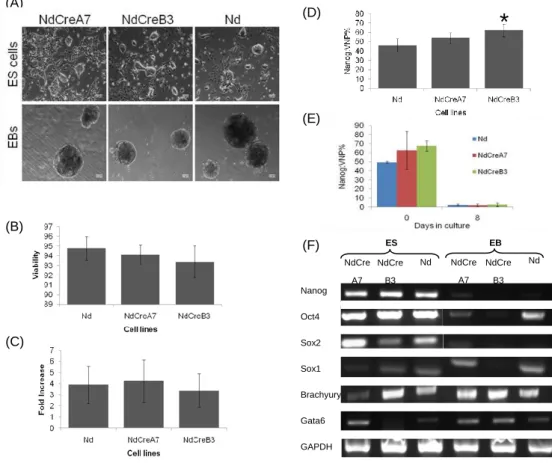
Regarding the morphology of the clones, all cell lines grew in typical ES cell cluster like morphology throughout several passages (>7). Concerning the growth capacity of the cell lines as ES cells, the results show that all have similar viabilities (>90%) (Figure 7B), and
similar fold increases (Figure 7C).Analysis of Nanog:VNP expression revealed that NdCreA7
had similar NANOG expression to that of the control Nd cell line, while NdCreB3, showed a higher and statistically significant difference to the control cell line (Figure 7D).
To further confirm the stemness character of the cell lines, their pluripotency capacity was analyzed. Both cell lines were able to give rise to different types of cells as shown by the capacity to form embryoid bodies (EBs). Upon differentiation, cells expressed lower levels of the transcription factors associated with the stemness state, (such as Nanog, Oct4 and
Sox2) (Figure 7F) and, as expected, a lower percentage of Nanog:VNP positive cells was
observed at day 8 of the EBs. After 8 days in differentiation conditions, the expression of the lineage markers Gata6 (endoderm), Brachyury (mesoderm) and Sox1 (a neural marker) was up-regulated, as expected, for the Nd and for the NdCreA7 cell lines. This pattern was not completely observed for the NdCreB3 clone, which revealed a very strong expression of
Brachyury already in the ES cell stage (day 0) and a decrease in the expression of Sox1
(Figure 7E), suggesting that this cell line might not be adequate for further studies.
In summary, the obtained results for the self-renewal and pluripotency properties analysis concomitantly with the pattern of expression obtained by RT-PCR shows that the NdCreA7 cell line behaves similarly to the parental Nd cell line. Furthermore, having into consideration
previously published data regarding NANOG expression 23 in several ES cell lines, the
obtained data suggests that the NdCreA7 cell line might be used as a faithful NANOG reporter. Therefore, this cell line was chosen for further experiments. For simplicity, this cell line will be referred to as NdA7 in the following sections.
2) Establishment of Fgf5:ANP reporter cell lines
In order to produce the desired reporter of Fgf5 expression, the FGF5 BAC was engineered by recombineering techniques to contain the ANP reporter under the control of the Fgf5 promoter (Figure A2) (section 2a in this chapter). The engineered BAC was electroporated into NdCreA7 cell line and into E14tg2a cell line in order to produce a double and a single reporter cell line (section 2b in this chapter.) and the obtained cell lines were analyzed and validated (section 2c in this chapter).
a) Construction of the Fgf5:ANP BAC
To construct the Fgf5:ANP reporter mainly 3 steps were performed: (i) a 3-piece ligation of the 3’HA, 5’HA and the pKS vector to obtain an adequate Fgf5 cassette; (ii) the recombination of the obtained Fgf5 cassette with the FGF5 BAC to obtain the final BAC vector; and (iii) the transformation of bacteria with the BAC obtained in (ii) to obtain adequate BAC amounts for purification and subsequent electroporation into ES cells.
(A) (D) (C) (B) (F) (E) Nanog Sox2 Sox1 Brachyury Gata6 GAPDH Oct4 Nd NdCre A7 Nd ES EB NdCre B3 NdCre A7 NdCre B3
*
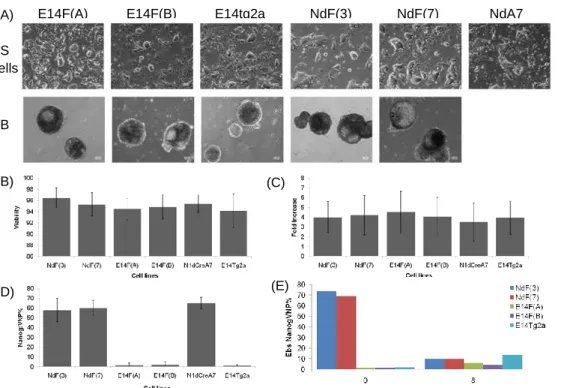
Figure 7Validation of the stemness potential of the novel cell lines. (A) ) Bright field images for Nd, NdCreA7
and NdCreB3 cell lines and, Graphics showing the Viability (B) the Fold Increase (C) and the Nanog:VNP% for the NdCreA7 and NdCreB3 cell lines and for the control (Nd) (n= 8) * p value = 0,003 between NdCreB3 and Nd cell lines (D). (E) Nanog:VNP expression at day 0 (ES cells) and at day 8 of EBs formation for the three cell lines (n=2). (F) RT-PCR analysis for known ES cell markers (Nanog, Oct4, Sox2) and ectoderm (Sox1), mesoderm (Brachyury) and endoderm(Gata6) markers.
In order to obtain the appropriate sequences for the 3 piece ligation reaction, plasmids containing the 3’HA and the 5’HA of Fgf5 were prepared. Bacteria clones transformed with these plasmids were grown, plasmids were purified (by minipreps) and analytic digestions were made to confirm the integrity of 3’HA and 5’ HA plasmids (Figure A1A). Preparative digestions were performed to allow the formation of cohesive DNA tips that permit the 3 piece ligation of both the cassettes and the vector. Preparative digestions were made using the enzymes EcorI-HindIII for Fgf5 5’HA cassette, EcoRI-Acc65I for Fgf5 3’HA cassette and Hind3-Acc65I for the vector pKS (Figure A4). The pattern of the digestions was confirmed by the analysis of the size of the bands in an analytic agarose gel (Figure A4) and the DNAs were extracted, purified and linked using a ligase enzyme (section 1 of Chapter II). To confirm that the 3 piece ligation (section1a of Chapter II) went as expected, bacteria were transformed with the product of the ligation reaction and grown under ampicillin selection. Several controls were made by transforming bacteria with each of the inserts alone or with the pKS vector. As expected, plates with bacteria transformed with each insert by itself had no colonies, once they do not have the resistence marker for ampicillin, and the plate with bacteria transformed with the vector had few colonies, corresponding to the linear form of the vector that was not digested by the exonucleases of the bacteria that still contains the resistance marker for ampicillin. Concerning the bacteria transformed with the product of the 3 piece ligation, several colonies were observed suggesting that the preparative digestions and the ligation reaction worked properly. From this plate, eight isolated clones were picked; grown and new plasmids were extracted. Three analytic digestions were performed for the purified plasmids to confirm that the picked clone had the right insertion: (i) the first digestion
was made with PvuII enzyme and all clones showed the correct pattern with 5 bands of the
expected length but also with a sixth unexpected band, probably a result of an incomplete digestion (Figure A1B); (ii) the second and third digestions, with PstI and EcoRV/Acc65I, were performed simultaneously only for clones 1 and 2 (chosen arbitrarily once all the 8 clones showed the correct pattern in the PstI digestion) and the pattern was the expected for both the digestions (Figure A1C).
Based on the restriction pattern, clone1 was chosen to proceed with the BAC preparation protocol. The clone was grown and a midiprep was performed to purify the plasmid. The product of the midiprep was digested with HindIII and Acc65I enzymes and run in a preparative agarose gel. The band with the correct size (in this case 3700 bp corresponding to the length of the pKS with the Fgf5 cassette insert), was extracted and purified. As a negative control of the preparative digestion, bacteria were transformed with the Fgf5 cassette alone and plated in LB supplemented with kanamycin (the resistance marker of the pKS vector). This plate had no colonies, which confirmed the purity of the Fgf5 cassette, namely the absence of contamination with the pKS vector and the undigested cassette. The
Clone 6 Original BAC
(B) (A)
SalI EcoRV XhoI AgeI Cl6 C C C C Cl6 Cl6 Cl6
1 2 3 4 5 6 7 8
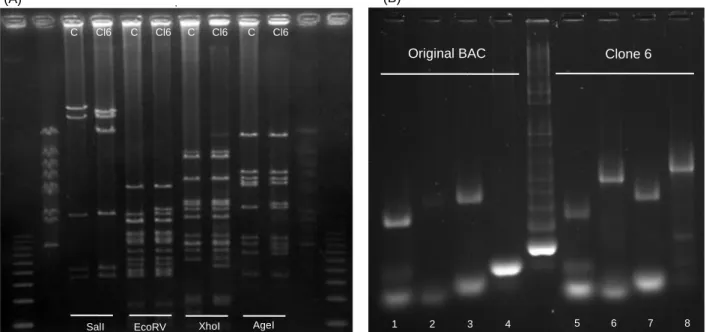
Figure 8 Recombineering analysis (A) PFGE with the digestion products of the control DNA and clone6 DNA
digested with Sall1, EcoRV, XhoI and AgeI enzymes. The ladders used was 1kb ladder (1st and last well) and the MidRange PFG Marker (NewEnglandBioLabs #N3552S), on the 2nd 11th well (B) Screening PCRs using as controls both individual homology harms in pKS (2nd and 4th wells); in the 1st and 3th wells is a band resulting from a PCR to confirm the presence of the DNA. In the right side there are the same PCRs in the same order but the sample is the DNA from the clone 6. Primers used: 1 and 5: 5HA FGF5 Fw HindIII and 5 HA FGF5 Rev Apple; 2 and 6: FGF5 5arm F and Dll 1 FVB 5 arm R; 3 and 7: 3 HA FGF5 Fw Bam HI and 3 HA fgf5 Rev Kpn mut 355; 4 and 8: Hes 5 FVB 3 arm F and FGF5 3 arm R. The ladder used was 1 kb ladder.
recombination was made according to the protocol described (section 1b Chapter II) and the growth of non-induced (negative control) and induced bacteria in LB plates supplemented with kanamycin was compared. As expected, induced bacteria were able to grow in these conditions, while no colonies were observed for the non-induced bacteria. Six colonies induced bacteria were picked and grown in LB plates supplemented with kanamycin. Only one of the clones picked was able to re-grow (clone6) and a glycerol stock was made from it. With the remaining bacteria of clone 6, a BAC miniprep was done, concomitantly with a miniprep of the negative control (non-induced bacteria). The DNAs were quantified on nanodrop and four confirmative digestions were performed (SalI, EcoRV, XhoI and AgeI). Finally, a PFGE gel was performed to confirm adequate fragment separation (Figure 8A). The PFGE restriction pattern analysis was difficult to perform because the efficiency of midipreps of the bacteria transformed with this BAC was low. Two confirmative PCRs were aditionally performed to confirm the integration of the Fgf5 cassette in the BAC (Figure 8B). Once both the PFGE restriction pattern and the pattern of bands amplified in the PCR were the expected the BAC was ready to electroporated into the E14tg2a parental cell line and the NdA7 cell line.