http://periodicos.uem.br/ojs/acta ISSN on-line: 1807-8672
Doi: 10.4025/actascianimsci.v41i1.42536
ANIMAL PRODUCTION
Technical and economic indicators of milk production systems in
the Caiuá sandstone region
Simony Marta Bernardo Lugão1, Bruno Volsi2, Gustavo Vaz da Costa2, Edson Luiz Diogo de Almeida3 and Tiago Santos Telles4*
1Instituto Agronômico do Paraná, Zootecnia, Paranavaí, Paraná, Brasil. 2Universidade Estadual de Londrina, Agronomia, Londrina, Paraná, Brasil. 3Instituto
Paranaense de Assistência Técnica e Extensão Rural, Maringá, Paraná, Brasil. 4Instituto Agronômico do Paraná, Socioeconomia, Rodovia Celso Garcia Cid, km
375, 86047-902, Londrina, Paraná, Brasil. *Author for correspondence. E-mail: [email protected]
ABSTRACT. The aim of this study was to analyze technical and economic indicators of family milk production systems, with different technology levels, in the Caiuá sandstone area in Northwestern Paraná, Brazil. The analysis period covers the agricultural years 2002/2003 to 2013/2014. The categorization of the milk production systems was based on information from agricultural farms monitored by the Reference Network for Family Agriculture. The cost-benefit analysis method was used for the economic assessment of milk production. Based on the results, three family milk production systems were identified in the region, characterized by the use of low, medium and high intensification technologies for pasture management. The production costs per unit area were found to be higher in the system with high technology and lower in the system with low technology. However, although the total revenue in the production system with a high technological intensification is greater than in the other systems, the capital needed for a technological transition is higher. In all the systems, when the costs were deducted, including the return on family labor, there was a profit, even with the climate and soil constraints inherent in the region.
Keywords: animal production; dairy farming; economic feasibility; production cost.
Received on April 23, 2018. Accepted on June 6, 2018.
Introduction
The production of bovine milk has significant importance for Brazilian agribusiness. According to the Food and Agriculture Organization of the United Nations (FAO, 2018), in 2016, the country was the fourth largest milk producer in the world. That same year, the state of Paraná was the second-largest milk producer in Brazil, contributing approximately 14.1% of the national production, according to Municipal Livestock Production (Produção da Pecuária Municipal – PPM) data, from the Brazilian Institute of Geography and Statistics (Instituto Brasileiro de Geografia e Estatística – IBGE). In the state of Paraná, there has been great technological development in milk production (Bazotti, Nazareno, & Sugamosto, 2012; Ferrazza, Lopes, de Moraes, & Pascoti Bruhn, 2015; Parré, Bánkuti, & Zanmaria, 2011). This is associated with organizational technical factors, such as collaboration between teaching, research and extension institutions, in addition to credit associations, the use of specialized labor, the selection of a herd with greater productivity and an active cooperative structure (Passetti, Eiras, Gomes, Santos, & Prado, 2016). However, there is a great heterogeneity between the producing regions (Capucho & Parré, 2012; Telles, Bacchi, & Shimizu, 2017) and the respective milk producers in Paraná (Lange et al., 2016; Neumann et al., 2016; Passetti et al., 2016). This difference is primarily characterized by the adoption of production techniques, feed supplementation for the dairy herd and genetic enhancements. Furthermore, dairy farming in Paraná is mainly undertaken on family farms, based in small agricultural establishments.
Paraná mesoregion has a relative importance in dairy farming; according to the IBGE’s PPM data, in 2016, it produced 401 million liters of milk (approximately 8.5% of the production in Paraná), ranking fifth in the state. Between 2002 and 2013, dairy production grew by almost 39%, accompanied by a 40% increase in productivity. It has approximately 23% of the effective cattle herd and 26% of the land used for pasture in the state, and approximately 78% of the establishments are family farms (Bazotti et al., 2012). According to Bánkuti, Caldas, Bánkuti, and Granco (2017) and Telles et al. (2017), this region of Paraná specializes in dairy farming.
However, there is a paucity of studies concerning the Caiuá sandstone area in the Northwest Paraná mesoregion, particularly regarding dairy farming, and it is very important to characterize the technological level of the region’s producers. According to Lopes Junior et al. (2012), there is no standard for production; the establishments range from subsistence farms to highly skilled producers with high productivity, and it is thus important to investigate the different production systems. Furthermore, there are problems with modernizing a traditional sector such as dairy farming in Paraná: it is difficult to spread and adopt process and product technologies to increase production and productivity, since technological transformations in agriculture collide with the farmer’s level of knowledge, their socioeconomic situation and the presence or absence of skilled and sustained multidisciplinary technical assistance.
It is thus understood that identification of the production systems actually used by milk producers in the Caiuá sandstone area, in the Northwest Paraná mesoregion, is important for supporting agricultural research and rural extension institutions in the creation and transfer of technologies compatible with the reality of producers in that area.
This study was realized to identify the different milk production systems in the Caiuá sandstone area in Northwestern Paraná according to their technological level and analyze their technical and economic indicators.
Material and methods
The study area comprises the Caiuá sandstone region, which in Paraná occupies a large part of the Northwest mesoregion and some municipalities in the West and North mesoregions (Figure 1). The region has a mesothermic humid subtropical climate, denominated Cfa by Köppen climate classification (Köppen & Geiger, 1928), characterized by hot summers, with infrequent frosts, no dry season and no water deficit. The Caiuá sandstone area is approximately 32,000 km², i.e., approximately 16% of the area of the state of Paraná.
After identifying, characterizing, classifying, and defining the types of agricultural establishments prevalent in each municipality/region of the state of Paraná, based on the 1995/96 Agriculture Census by Doreto, Laurenti & Del Grossi (2001), the Reference Network for Family Agriculture (Redes de
Referência para Agricultura Familiar – REDES)1 selected and began to monitor 38 family farms2, with
homogeneous characteristics in terms of milk production system (as described in Table 1), representative of the Caiuá sandstone area in the Northwest Paraná mesoregion. The farms differ according to the degree of intensification of pasture management. The REDES data are the foundation of this study.
After monitoring and analyzing the family farming establishments dedicated to milk production in the region, technical and animal indicators of milk production were obtained. Then, based on the categorization and technologies recommended by the IAPAR, three milk production systems were defined, classified according to pasture management – specifically, low, medium and high technological standards – whose characteristics are described in Table 2.
The analyses of the costs and profitability of milk production were based on the methodology of the Agriculture Federation of Parana State (Federação da Agricultura do Estado do Paraná [FAEP], 2005). The fixed and variable costs of production and the most commonly used dairy farming inputs were estimated. The prices paid and received by milk producers were obtained from the Department of Rural Economy (Departamento de Economia Rural – DERAL), of the Paraná State Department of Agriculture and Supply (Secretaria da Agricultura e Abastecimento do Paraná – SEAB-PR). The analysis period covered the harvest years 2002/2003 to 2013/2014.
Table 1. Common characteristics of milk production systems according to the technological standard.
I Race Dairy herd composed mostly of crossbred cows, predominantly 7/8 Dutch blood
II Useful area 11 ha of useful surface area for animal production
III Average productivity 15 L cow-1 day-1
IV Pasture system Rotational stocking, with perennial tropical pasture (PTP) during the summer
V Feed base
Summer PTP, energy or energy-protein supplementation, according to the production and lactation curve
Winter Sugar cane, corrected with urea and ammonium sulfate, with energy-protein supplementation
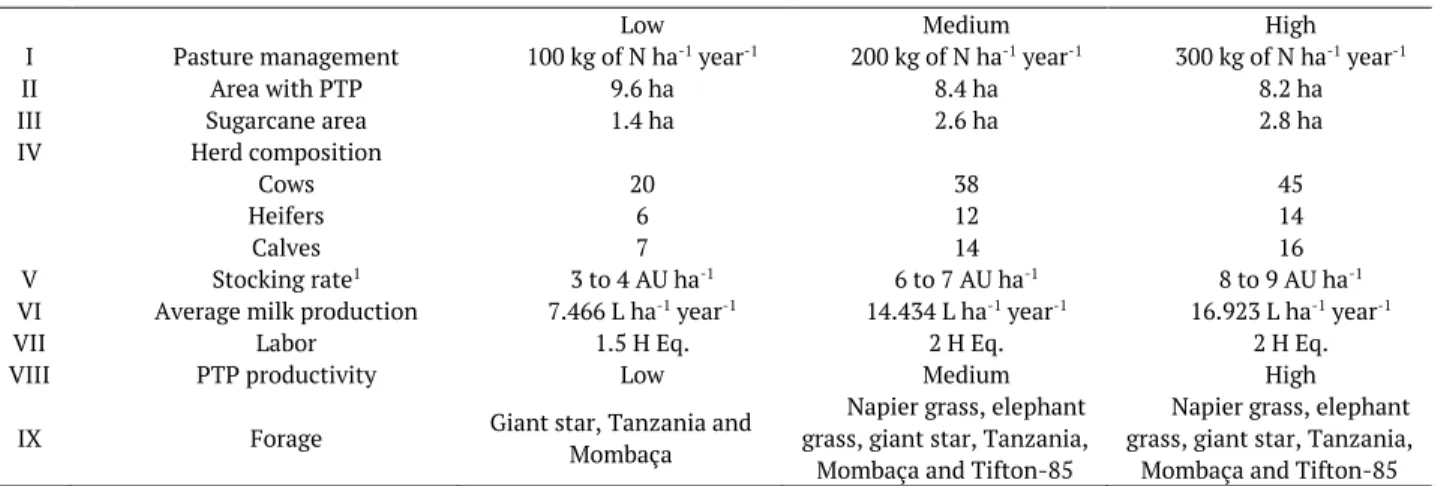
Table 2. Specific characteristics of each milk production system according to the technological standard.
Low Medium High
I Pasture management 100 kg of N ha-1 year-1 200 kg of N ha-1 year-1 300 kg of N ha-1 year-1
II Area with PTP 9.6 ha 8.4 ha 8.2 ha
III Sugarcane area 1.4 ha 2.6 ha 2.8 ha
IV Herd composition
Cows 20 38 45
Heifers 6 12 14
Calves 7 14 16
V Stocking rate1 3 to 4 AU ha-1 6 to 7 AU ha-1 8 to 9 AU ha-1
VI Average milk production 7.466 L ha-1 year-1 14.434 L ha-1 year-1 16.923 L ha-1 year-1
VII Labor 1.5 H Eq. 2 H Eq. 2 H Eq.
VIII PTP productivity Low Medium High
IX Forage Giant star, Tanzania and
Mombaça
Napier grass, elephant grass, giant star, Tanzania, Mombaça and Tifton-85
Napier grass, elephant grass, giant star, Tanzania, Mombaça and Tifton-85
Notes. 1Stocking rate of pastures in the rainy season. PTP: perennial tropical pasture. N: nitrogen. AU: animal unit. H Eq.: human equivalent.
The economic indicators analyzed in this study were the following: revenue from milk, revenue from sales of waste and scrap, total operating cost (TOC), actual operating cost (AOC), depreciation, total
1 The Agricultural Research Institute of Paraná State (Instituto Agronômico do Paraná - IAPAR), in partnership with the Paraná. The Company for Technical Assistance and Rural
Extension (Empresa Paranaense de Assistência Técnica e Extensão Rural – EMATER/PR) created the REDES project with the primary objective of assisting rural producers in all
regions of the state of Paraná. In the Northwest Paraná mesoregion, mainly in the Caiuá sandstone area, REDES has been operating since 1998, primarily focusing on the
development of dairy farming technologies adapted to the region’s limited climate and soil conditions.
2 REDES uses a research methodology adapted to rural extension, supported in farms analyzed and monitored under the systemic approach, which includes analyses of natural
resources, plant and animal production, human resources and socioeconomic aspects of family farming establishments (Miranda, Carneiro, Soares Júnior, & Fuentes-Llanillo, 2009). In its different stages, the implementation of REDES involves conducting a preliminary study to characterize the region and classify the farmers, using information from agricultural censuses, which assists in the selection of the production systems to be studied. Once the agricultural establishments have been selected, their productive system is monitored and a
diagnosis is made, in order to understand the operation of that system, its bottlenecks and potential, in addition to the farmer’s goals, information that will in turn support the stages of
planning and interventions on the farm. Based on the monitoring of the farms and the interventions performed in order to improve its production systems—which is done based on the
cost (TC), variable cost (VC), fixed cost (FC), gross margin (GM) and income from agricultural operations (IAO). Revenue from milk was calculated based on the amount of milk that each intensified system produced, multiplied by its price in that same period. TC was calculated based on the sum of the VC and FC. VC was composed of the sum of the items (i) fertilization, (ii) energy/protein supplementation, (iii) mineralization, (iv) health, (v) breeding and (vi) return on working capital, not considering taxes and fees. FC was the sum of expenditures on (i) animals, (ii) the site’s physical structure, (iii) miscellaneous equipment, (iv) planting of sugarcane and pasture, including soil preparation, and (v) the opportunity cost, composed of return on land, capital invested and labor. TOC was calculated based on the sum of AOC and depreciation. AOC was obtained based on the sum of VC and taxes and fees, less return on working capital. GM corresponds to revenue from sales of milk, waste and scrap, less AOC. IAO is composed of revenue from sales of milk, waste and scrap, less TOC. Economic profit was calculated by subtracting TC from the revenues.
All economic indicators were adjusted by the Extended Consumer Price Index (Índice de Preço ao Consumidor Amplo – IPC-A), the official inflation index in Brazil, to December 2017 values and converted into US dollars.
Results and discussion
Table 3 presents the results of analyzing the profitability of dairy farming in production systems with low, medium and high intensities of pasture management between the years 2002/03 and 2013/14.
The average total revenue of the period in production systems with low, medium and high technological levels was US$ 28,853.27, US$ 56,019.48 and US$ 65,601.88, respectively. For the three systems evaluated, approximately 87% of the total revenue, on average, came from the sale of milk , irrespective of the production system. In the system with a medium technological level, there was an increase in total revenue of 94.42%, compared to the low technological level. Between the systems with medium and high levels, the difference in earnings was 17.11%; between the systems with low and high levels, this difference was 127.36%. Alvim and Botrel (2001) obtained similar results when they found that higher revenues were obtained in systems with a greater intensification of pasture management, although they showed that efficiency decreases with increased dosage of N. In this period, the total revenue of the three technological levels grew at an annual rate of 4.5% per year. This rate remains the same in the three systems studied, as, regardless of the technological level adopted, the herd’s
productivity is the same; the difference between them is the number of animals. The productivity per area was thus higher in systems with higher technological levels due to the higher concentration of lactating cows per ha.
Figure 2 presents the price history per liter of milk from harvest years 2002/03 to 2013/14. The average real price per liter of milk received by the producers in the period was US$ 0.31. Regarding the price paid to the producer per liter of milk, there were sharp declines in the agricultural years 2005/06 and 2008/09,
which may have compromised the producer’s revenue. These results demonstrate that in addition to climate
and soil constraints, it is necessary to address market seasonality, which compromises the activity’s
sustainability.
Table 4 presents the costs of producing one liter of milk, in accordance with the technological level adopted, in the Caiuá sandstone region in Northwestern Paraná between the agricultural years 2002/2003 and 2013/2014. As a rule, the system with a low technological level presented higher costs, mainly due to the economies of scale and scope of the other systems.
Table 3. Economic indicators of dairy farming in family production systems in the Caiuá sandstone region in Northwestern Paraná between the agricultural years 2002/03 and 2013/14. in US$.
02/03 03/04 04/05 05/06 06/07 07/08 08/09 09/10 10/11 11/12 12/13 13/14 Average Low intensification in pasture management
Total revenue 24.165 25.523 26.615 21.983 24.780 30.757 27.803 29.849 31.687 32.780 33.425 36.872 28.853
Milk 21.702 22.899 24.088 19.495 22.327 27.596 23.872 25.930 27.250 28.150 28.384 31.221 25.243
Waste/scraps 2.464 2.625 2.527 2.487 2.452 3.161 3.930 3.918 4.436 4.631 5.041 5.651 3.610
TOC 26.898 27.920 26.808 23.679 24.284 27.493 28.755 25.947 26.627 27.635 29.573 29.402 27.085
AOC 24.717 25.740 24.627 21.498 22.089 25.298 26.558 23.700 24.387 25.396 27.333 27.162 24.875
Depreciation 2.181 2.181 2.181 2.181 2.195 2.195 2.197 2.247 2.239 2.239 2.239 2.239 2.210
Total cost 36.462 37.030 35.906 32.752 33.295 36.984 38.932 36.173 36.897 38.164 40.582 40.871 37.004
Fixed costs 10.958 10.476 10.572 10.615 10.608 11.038 11.551 11.878 11.911 12.133 12.507 13.056 11.442
Return on land 987 726 957 833 725 742 890 977 975 1.109 1.337 1.734 999
Ret. on cap. invested 4.508 4.330 4.049 3.819 3.601 3.830 3.923 3.835 3.833 3.586 3.549 3.646 3.876
Taxes (ITR) 10 7 10 8 7 7 9 10 10 11 13 17 10
Depreciation 2.181 2.181 2.181 2.181 2.195 2.195 2.197 2.247 2.239 2.239 2.239 2.239 2.210
Return on labor 3.272 3.232 3.376 3.773 4.080 4.265 4.532 4.809 4.854 5.188 5.368 5.419 4.347
Variable cost 25.504 26.554 25.334 22.137 22.687 25.946 27.381 24.294 24.986 26.031 28.075 27.814 25.562
AOC (no taxes) 24.218 25.213 24.073 21.050 21.576 24.663 26.009 23.104 23.760 24.748 26.680 26.444 24.295
Ret. on working cap. 1.286 1.341 1.261 1.087 1.111 1.282 1.372 1.191 1.225 1.282 1.394 1.370 1.267
Gross margin -552 -216 1.988 484 2.690 5.459 1.198 6.149 7.300 7.385 6.092 9.710 3.974
IAO -2.733 -2.397 -193 -1.696 495 3.264 -952 3.902 5.060 5.145 3.852 7.470 1.768
Economic profit -12.297 -11.507 -9.291 -10.769 -8.515 -6.227 -11.129 -6.324 -5.210 -5.383 -7.157 -3.999 -8.151
Medium intensification in pasture management
Total revenue 46.884 49.521 51.625 42.666 48.071 59.675 53.963 57.969 61.557 63.684 64.957 71.662 56.020
Milk 41.956 44.271 46.570 37.691 43.166 53.352 46.153 50.132 52.684 54.423 54.875 60.361 48.803
Waste/scraps 4.928 5.250 5.054 4.975 4.904 6.323 7.810 7.837 8.873 9.262 10.082 11.301 7.217
TOC 46.769 48.676 46.275 40.438 41.670 47.713 49.801 44.766 46.080 47.977 51.644 51.379 46.932
AOC 44.540 46.447 44.046 38.209 39.427 45.470 47.556 42.418 43.740 45.636 49.304 49.038 44.653
Depreciation 2.229 2.229 2.229 2.229 2.243 2.243 2.245 2.348 2.340 2.340 2.340 2.340 2.280
Total cost 59.806 61.220 58.607 52.737 53.865 60.817 63.999 58.937 60.406 62.596 66.985 67.325 60.608
Fixed costs 13.844 13.299 13.303 13.386 13.372 14.193 14.971 15.465 15.604 15.831 16.349 17.120 14.728
Return on land 987 726 957 833 725 742 890 977 975 1.109 1.337 1.734 999
Ret. on cap. invest. 6.256 6.028 5.607 5.284 4.956 5.515 5.785 5.719 5.807 5.454 5.501 5.802 5.643
Taxes (ITR) 10 7 10 8 7 7 9 10 10 11 13 17 10
Depreciation 2.229 2.229 2.229 2.229 2.243 2.243 2.245 2.348 2.340 2.340 2.340 2.340 2.280
Return on labor 4.363 4.309 4.501 5.031 5.440 5.686 6.042 6.412 6.472 6.917 7.157 7.226 5.796
Variable cost 45.962 47.920 45.304 39.351 40.493 46.624 49.027 43.471 44.802 46.765 50.636 50.205 45.880
AOC (no taxes) 43.575 45.429 42.975 37.343 38.434 44.243 46.494 41.265 42.528 44.385 48.042 47.650 43.530
Ret. on working cap. 2.387 2.492 2.329 2.008 2.059 2.381 2.533 2.206 2.274 2.380 2.595 2.555 2.350
Gross margin 2.344 3.074 7.579 4.457 8.644 14.205 6.407 15.551 17.817 18.048 15.653 22.624 11.367
IAO 115 844 5.350 2.228 6.401 11.962 4.162 13.203 15.477 15.708 13.313 20.284 9.087
Economic profit -12.923 -11.699 -6.983 -10.071 -5.794 -1.142 -10.035 -968 1.151 1.088 -2.028 4.338 -4.589
High intensification in pasture management
Total revenue 54.909 58.017 60.477 49.963 56.300 69.890 63.186 67.885 72.104 74.553 76.018 83.921 65.602
Milk 49.190 51.904 54.600 44.189 50.609 62.550 54.111 58.775 61.768 63.806 64.336 70.768 57.217
Waste/scraps 5.718 6.113 5.877 5.773 5.692 7.340 9.075 9.109 10.337 10.747 11.682 13.153 8.385
TOC 54.989 57.341 54.623 47.535 48.959 56.114 58.665 52.637 54.204 56.447 60.781 60.451 55.229
AOC 52.745 55.096 52.379 45.291 46.701 53.856 56.405 50.265 51.840 54.083 58.416 58.087 52.930
Depreciation 2.244 2.244 2.244 2.244 2.258 2.258 2.260 2.372 2.364 2.364 2.364 2.364 2.298
Total cost 68.981 70.840 67.828 60.635 61.900 70.108 73.880 67.746 69.507 72.015 77.139 77.465 69.837
Fixed costs 14.523 13.962 13.913 13.960 13.905 14.850 15.696 16.199 16.373 16.559 17.109 17.959 15.417
Return on land 987 726 957 833 725 742 890 977 975 1.109 1.337 1.734 999
Ret. on cap. invest. 6.919 6.676 6.201 5.844 5.474 6.156 6.494 6.429 6.552 6.158 6.237 6.617 6.313
Taxes (ITR) 10 7 10 8 7 7 9 10 10 11 13 17 10
Depreciation 2.244 2.244 2.244 2.244 2.258 2.258 2.260 2.372 2.364 2.364 2.364 2.364 2.298
Return on labor 4.363 4.309 4.501 5.031 5.440 5.686 6.042 6.412 6.472 6.917 7.157 7.226 5.796
Variable cost 54.458 56.877 53.915 46.675 47.995 55.258 58.184 51.547 53.134 55.456 60.030 59.506 54.420
AOC (no taxes) 51.614 53.903 51.123 44.274 45.537 52.417 55.160 48.913 50.419 52.615 56.937 56.460 51.614
Ret. on working cap. 2.845 2.975 2.792 2.400 2.458 2.840 3.024 2.634 2.715 2.840 3.094 3.046 2.805
Gross margin 2.164 2.921 8.097 4.672 9.599 16.034 6.782 17.620 20.264 20.470 17.601 25.833 12.671
IAO -80 677 5.854 2.428 7.341 13.776 4.521 15.248 17.900 18.106 15.237 23.470 10.373
Economic profit -14.073 -12.822 -7.352 -10.672 -5.600 -218 -10.693 139 2.597 2.538 -1.121 6.456 -4.235
In the fixed cost, there was an increase of 28.72% between the systems low and medium technological levels, whereas there was an increase of 4.68% between the systems with mediu m and high levels, and an increase of 34.74% between the systems with low and high levels. The difference between the systems with medium and high levels was lower, as the increase in the number of lactating cows (38 compared to 45) is smaller than that between the systems with low and medium technological levels (20 compared to 38). Furthermore, most of the infrastructure investments made in the system with the lowest intensification are the same, thus gaining economies of scale in production. Although the system with a low technological level exhibits the lowest fixed cost, i.e., US$ 11,442.21, the fixed costs were more diluted in the unit cost per liter of milk in the systems with a medium and high level, US$ 0.09 and US$ 0.08, respectively. Regarding the actual operating cost, the highest cost per liter of milk was identified in the system with a low technological level: an average of US$ 0.30. Knowing that the producer is able to achieve economies of scale in the systems with medium or high technological levels, this figure was reduced an average of 7.15% in the medium level and 6.13% in the high level.
Figure 2. Price per liter of milk from harvest years 2002/03 to 2013/14, US$ L-1. Note: the values were adjusted to
December 2017 values using the IPC-A.
Table 4. Average costs of milk production per liter in the Caiuá sandstone region in Northwestern Paraná between the agricultural years 2002/2003 and 2013/2014, in US$.
02/03 03/04 04/05 05/06 06/07 07/08 08/09 09/10 10/11 11/12 12/13 13/14 Average Low intensification in pasture management
Total operating cost 0.33 0.34 0.32 0.29 0.30 0.34 0.35 0.32 0.32 0.34 0.36 0.36 0.33
Actual operating cost 0.30 0.31 0.30 0.26 0.27 0.31 0.32 0.29 0.30 0.31 0.33 0.33 0.30
Total cost 0.44 0.45 0.44 0.40 0.41 0.45 0.47 0.44 0.45 0.46 0.49 0.50 0.45
Variable costs 0.31 0.32 0.31 0.27 0.28 0.32 0.33 0.30 0.30 0.32 0.34 0.34 0.31
Fixed costs 0.13 0.13 0.13 0.13 0.13 0.13 0.14 0.14 0.14 0.15 0.15 0.16 0.14
Medium intensification in pasture management
Total operating cost 0.30 0.31 0.29 0.25 0.26 0.30 0.31 0.28 0.29 0.30 0.32 0.32 0.29
Actual operating cost 0.28 0.29 0.28 0.24 0.25 0.29 0.30 0.27 0.28 0.29 0.31 0.31 0.28
Total cost 0.38 0.39 0.37 0.33 0.34 0.38 0.40 0.37 0.38 0.39 0.42 0.42 0.38
Variable costs 0.29 0.30 0.28 0.25 0.25 0.30 0.31 0.27 0.28 0.30 0.32 0.32 0.29
Fixed costs 0.09 0.08 0.08 0.08 0.08 0.09 0.10 0.10 0.10 0.10 0.10 0.11 0.09
High intensification in pasture management
Total operating cost 0.30 0.31 0.30 0.25 0.26 0.30 0.31 0.28 0.29 0.30 0.32 0.32 0.30
Actual operating cost 0.28 0.30 0.28 0.24 0.25 0.29 0.30 0.27 0.28 0.29 0.31 0.31 0.28
Total cost 0.37 0.38 0.37 0.32 0.33 0.38 0.40 0.37 0.37 0.39 0.41 0.42 0.38
Variable costs 0.29 0.31 0.29 0.25 0.26 0.30 0.31 0.28 0.28 0.30 0.32 0.32 0.29
Regarding the analysis of total operating cost, where the depreciation of machinery, equipment and improvements was also considered, the costs sustained in the period increased by an average of 8.88% for the low level, 5.11% for the medium level and 4.43% for the high technological level. In the studies of Simões, Silva, Oliveira, Cristaldo, and Brito (2009), depreciation was responsible for 13.16% of direct costs in the system with intensive milk production. In Lopes, Santos, Resende, Carvalho, and Cardoso (2011), the depreciation of assets ranged from 3.8% to 19.4% of the total operating cost, and the lower percentage was a reflection of the farm’s lack of infrastructure, which may have led to lower milk production. These results denote a certain breadth and heterogeneity of dairy systems, especially in relation to the use of the farms’
physical structure.
The total operating cost per liter/milk in the systems with low, medium and high technological levels was US$ 0.33, US$ 0.30 and US$ 0.30, respectively. These values were close to those found by Silva et al. (2008). When the total operating cost was subtracted from the gross revenue from milk, no positive result was obtained for the system with a low technological level. It is thus essential that additional revenue from the sale of waste and scrap be generated, in order to begin operating with a positive income from agricultural operations.
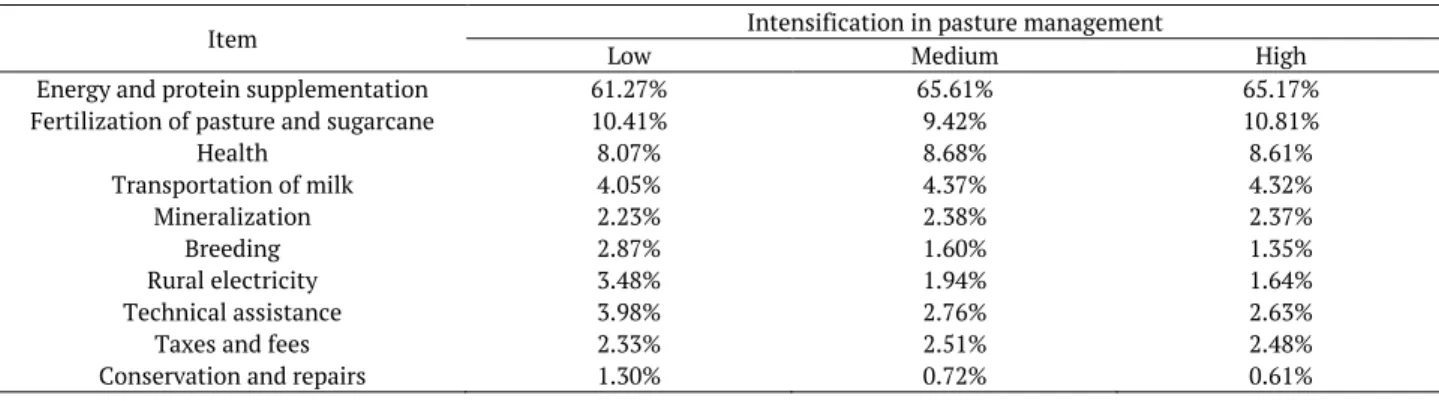
Table 5 presents the items that constitute the actual operating cost and its percentage shares for the three production systems between the agricultural years 2002/03 and 2013/14. The components that have the greatest impact on the actual operating cost are those related to animal feed.
Across the three production systems, the item with the greatest weight in the actual operating cost was energy and protein supplementation, representing an average of 64.02%. In the studies of Segala and Silva (2007), a similar result was found for the municipality of Irani (SC), with feed representing 58.7% of the total, especially during periods of drought. The second-most-represented item in the costs was the fertilization of sugarcane, with an average of 10.2%. The third-largest expenditure was animal health, corresponding to 8.5% of the actual operating cost, a figure approximately 3% greater than that found by Lopes et al. (2011) and Lopes and Santos (2012).
Regarding expenditures on animal breeding, rural electricity, conservation and repairs and technical assistance, the systems presented expenditures on these components that were inversely proportional to the technological level adopted, i.e., as the intensification of pasture management increased, their share of the AOC decreased.
Regarding gross margin, considering the average values of the period evaluated, the system with a low technological level presented the lowest gross margin (US$ 3,973.82). In the system with a medium level, the gross margin was US$ 11,366.95; compared to that of the low level, this value represents an increase of 186.0%. In the system with a high technological level, the gross margin was US$ 12,671.51; compared to that of the medium level, there is a gain of 11.5%, and compared to the low level, this gain is 218.9%. The best gross margin per liter of milk was obtained in the systems with a medium and high technological level, with an average value of US$ 0.07, followed by the low level, with US$ 0.05. As in Lopes et al. (2011), the gross margin economic indicator showed that dairy farming in systems with medium or high intensities of pasture management is sustainable even in the short and medium term.
Table 5. Components of the actual operating cost, of dairy farming in family production systems in the Caiuá sandstone region in Northwestern Paraná between the agricultural years 2002/2003 and 2013/2014.
Item Intensification in pasture management
Low Medium High
Energy and protein supplementation 61.27% 65.61% 65.17%
Fertilization of pasture and sugarcane 10.41% 9.42% 10.81%
Health 8.07% 8.68% 8.61%
Transportation of milk 4.05% 4.37% 4.32%
Mineralization 2.23% 2.38% 2.37%
Breeding 2.87% 1.60% 1.35%
Rural electricity 3.48% 1.94% 1.64%
Technical assistance 3.98% 2.76% 2.63%
Taxes and fees 2.33% 2.51% 2.48%
Regarding income from agricultural operations, where expenditures on depreciation are also considered, the system with a medium technological level was the only one that did not present negative values over the period. However, considering the average values of the period evaluated, the system with a high technological level exhibited the best income from agricultural operations (US$ 10,373), with a gain of 586.7% compared to the low level and 114.2% compared to the medium level. The values for the average income from agricultural operations per liter of milk obtained in the systems with low, medium and high technological levels were US$ 0.02, US$ 0.06 and US$ 0.06, respectively. Thus, increasing the technological level can improve income, provided that the marginal cost of the extra milk produced is lower than the price of the milk received (Macdonald et al., 2017).
From an economic point of view, when considering the opportunity cost, i.e., costs of return on land, capital invested, working capital and labor, the system with a low technological level was not economically feasible, even in years where the price of milk was above the average value. The system with a medium level was economically feasible in three years, whereas the system with a high technological level was feasible in four agricultural years, years in which the price paid per liter of milk was higher than US$ 0.33—with the exception of the agricultural years 2007/08 and 2012/13, when the market presented a generalized increase
in the prices of this activity’s inputs, pressured by the rise of the dollar.
Based on the analysis of economic feasibility, milk production systems confront barriers to being considered economically feasible. Both the price per liter of milk received by the producer and the prices paid for the agricultural inputs influence the final results. However, more important is the fact that in short, even in the Caiuá sandstone area, a region with climate and soil constraints, without considering economic profit, dairy farming can be profitable for family milk producers.
Conclusion
In dairy farming systems operating in the Caiuá sandstone area, in the Northwest Paraná mesoregion, between 2002/03 and 2013/14, without considering economic profit, these systems presented the possibility of profitability for the producers, depending primarily on the price per liter of milk and the inputs inherent in the production. However, when considering economic profit, the systems were not economically feasible.
The technological level influenced the production costs and profitability of the production systems, with a greater intensification of pasture management being correlated with better results for the indicators analyzed.
References
Alvim, M. J., & Botrel, M. A. (2001). Efeitos de doses de nitrogênio na produção de leite de vacas em pastagem de
coast-cross. Pesquisa Agropecuária Brasileira, 36(3), 577-583. doi: /10.1590/S0100-204X2001000300024.
Bánkuti, F. I., Caldas, M. M., Bánkuti, S. M. S., & Granco, G. (2017). Spatial dynamics: a new “milk corridor”
in Paraná state, Brazil. Semina: Ciências Agrárias, 38(4), 2107-2118. doi: 10.5433/1679-0359.2017v38n4p2107.
Bazotti, A., Nazareno, L. R., & Sugamosto, M. (2012). Caracterização socioeconômica e técnica da atividade leiteira do Paraná. Revista Paranaense de Desenvolvimento(123), 213-234.
Capucho, T. O., & Parré, J. L. (2012). Produção leiteira no Paraná: um estudo considerando os efeitos espaciais. Informe Gepec, 16(1), 112-127.
Doreto, M., Laurenti, A. C. & Del Grossi, M. E. (2001). Tipos de estabelecimentos agropecuários do Estado do
Paraná: 1995-1996. Londrina, PR: IAPAR/PRONAF.
Food and Agriculture Organization of the United Nations [FAO]. (2018). FAOSTAT: Statistics.
Federação da Agricultura do Estado do Paraná [FAEP]. (2005). Sistema de acompanhamento do custo de
produção do leite do Paraná. Curitiba, PR: FAEP.
Ferrazza, R. A., Lopes, M. A., de Moraes, F., & Pascoti Bruhn, F. R. (2015). Índices de desempenho zootécnico e econômico de sistemas de produção de leite com diferentes níveis tecnológicos. Semina:
Ciências Agrárias, 36(1), 485-496. doi: 10.1590/1089-6891v16i225878.
Köppen, W., & Geiger, R. (1928). Klimate der Erde. Gotha: Verlag Justus Perthes.
Lange, M. J., Zambom, M. A., Ramos, C. E. C. O., Castagnara, D. D., Bánkuti, F. I., Neumann, M. E., ... Tinini, R. C. R. (2016). Tipologia de sistemas de produção leiteiros baseado nas características produtivas e de manejo na Região Oeste do Paraná. Semina: Ciências Agrárias, 37, 473-481. doi:
10.5433/1679-0359.2016v37n1p473.
Lopes Junior, J. F., Ramos, C. E. C. O., Santos, G. T., Grande, P. A., Damasceno, J. C., & Massuda, E. M. (2012). Análise das práticas de produtores em sistemas de produção leiteiros e seus resultados na produção e qualidade do leite. Semina: Ciências Agrárias, 33(3), 1199-1208. doi: 10.5433/1679-0359.2012v33n3p1199.
Lopes, M. A., Dias, A. S., Carvalho, F. M., Lima, A. L. R., Cardoso, M. G., & Carmo, E. A. (2009). Resultados econômicos de sistemas de produção de leite com diferentes níveis tecnológicos na região de Lavras, MG nos anos 2004 e 2005. Ciência e Agrotecnologia, 33(1), 252-260. doi: 10.1590/S1413-70542009000100035. Lopes, M. A., Lima, A. L. R., Carvalho, F. M., Reis, R. P., Santos, I. C., & Saraiva, F. H. (2005). Resultados
econômicos de sistemas de produção de leite com diferentes níveis tecnológicos na região de Lavras, MG.
Arquivo Brasileiro de Medicina Veterinária e Zootecnia, 57, 485-493. doi:
10.1590/S0102-09352005000400009.
Lopes, M. A., & Santos, G. (2012). Comparativo econômico entre propriedades leiteiras em sistema intensivo de produção: um estudo multicasos. Revista Brasileira de Saúde e Produção Animal, 13(3), 591-603. doi: 10.1590/S1519-99402012000300001.
Lopes, M. A., Santos, G., Resende, M. C., Carvalho, F. M., & Cardoso, M. G. (2011). Estudo da rentabilidade de sistemas de produção de leite no município de Nazareno, MG. Revista Ciência Animal Brasileira, 12, 58-69. doi: 10.5216/cab.v12i1.7725.
Macdonald, K. A., Penno, J. W., Lancaster, J. A. S., Bryant, A. M., Kidd, J. M., & Roche, J. R. (2017).
Production and economic responses to intensification of pasture-based dairy production systems. Journal
of Dairy Science, 100(8), 6602-6619. doi: 10.3168/jds.2016-12497.
Miranda, M., Carneiro, S. L., Soares Júnior, D., & Fuentes-Llanillo, R. (2009). Enfoque sistêmico e redes de referências para agricultura familiar. Informe Agropecuário, 30(250), 22-28.
Neumann, M. E., Zambom, M. A., Lange, M. J., Bankuti, F. I., Castagnara, D. D., Dias, A. L. G., ... Fernandes, T. (2016). Typology of dairy production systems from West Parana State based on production indices and feed used. Semina: Ciências Agrárias, 37(3), 1565-1579. doi: 10.5433/1679-0359.2016v37n3p1565.
Parré, J. L., Bánkuti, S. M. S., & Zanmaria, N. A. (2011). Perfil socioeconômico de produtores de leite da região sudoeste do Paraná: um estudo partir de diferentes níveis de produtividade. Revista de economia e agronegócio. Revista de Economia e Agronegócio, 9(2), 275-300. doi: 10.25070/rea.v9i2.187.
Passetti, R. A. C., Eiras, C. E., Gomes, L. C., Santos, J. F., & Prado, I. N. (2016). Intensive dairy farming systems from Holland and Brazil: SWOT analyse comparison. Acta Scientiarum. Animal Sciences, 38(4), 439-446. doi: 10.4025/actascianimsci.v38i4.31467.
Segala, C. Z. S., & Silva, I. T. (2007). Apuração dos custos na produção de leite em uma propriedade rural do município de irani-sc. Custos e@ gronegócio on line, 3(1), 61-83.
Silva, H. A., Koehler, H. S., Moraes, A., Guimarães, V. D. A., Hack, E., & Carvalho, P. C. F. (2008). Evaluation of the economic viability of milk production on pasture and supplements in the region of Campos Gerais-Paraná, Brazil. Ciência Rural, 38(2), 445-450.
Simões, A. R. P., Silva, R. M., Oliveira, M. V. M., Cristaldo, R. O., & Brito, M. C. B. (2009). Avaliação econômica de três diferentes sistemas de produção de leite na região do Alto Pantanal Sul-mato-grossense. Agrarian, 2(5), 153-167. doi: 10.30612/agrarian.v2i5.813.