Economic values for milk production and quality traits in south and
southeast regions of Brazil
Vera Lucia Cardoso1, Maria Lucia Pereira Lima1, José Ramos Nogueira1, Raul Lara Resende de Carneiro2, Roberta Cristina Sesana2, Elisa Junqueira Oliveira3, Lenira El Faro1
1 Agência Paulista de Tecnologia dos Agronegócios, Polo Regional Centro-Leste, Ribeirão Preto, SP, Brasil. 2 CRV-Lagoa, Sertãozinho, SP, Brasil.
3 Departamento de Genética, Faculdade de Medicina de Ribeirão Preto, Universidade de São Paulo, Ribeirão Preto, SP, Brasil.
ABSTRACT - The objective of this study was to calculate economic values for milk (MY), protein (PY) and fat productions (FY) and somatic cell count (SCC) which could be used to compose an economic index to rank animals involved in an international genetic evaluation program of Holstein cattle used in the commercial dairy population in Brazil. The main milk production systems (MPS) prevailing in the South and Southeast were defined based on the feeding management and production level of herds. To calculate feeding costs, energy requirements for the production of one kg of milk with the respective average protein and fat contents of each MPS were calculated. Feeding costs were obtained based on the regional prices of the diets’ components. To calculate revenues, milk prices were obtained from the payment tables practiced by seven milk industries. Economic values were calculated from the marginal differences between revenues and costs, for the interest of maximizing the profit, assuming a fixed number of animals in the herd. The average economic values (R$) for MY, PY and FY were 0.51, 6.41 and 1.94, respectively. The economic impact of increasing the original SCC values in the individual records of cows in the population by 1% was –R$ 1.40 per cow, per year. Due to changes observed in the last years in the milk market in Brazil, selection for milk components became economically advantageous. As a result, the calculation of economic values and the proposition of an economic index based on these traits became feasible. Somatic cell count does have an economic impact on the final price of milk and consequently on the annual profit of herds. It has also been used in breeding programs as an indicator of mastitis resistance and should not be neglected in breeding programs of dairy cattle.
Key Words: dairy cattle, milk composition, selection index ISSN 1806-9290
www.sbz.org.br R. Bras. Zootec., 43(12):636-642, 2014
Received October 2, 2013 and accepted November 12, 2014. Corresponding author: [email protected]
http://dx.doi.org/10.1590/S1516-35982014001200002
Copyright © 2014 Sociedade Brasileira de Zootecnia. This is an Open Access article distributed under the terms of the Creative Commons Attribution Non-Commercial License, which permits unrestricted non-commercial use, distribution, and reproduction in any medium, provided the original work is properly cited.
Introduction
Breeding should be taken into account in long-term planning of any animal production enterprise to guarantee the optimization of available resources and the return of investments. Breeding programs are basically designed to identify superior genotypes for different traits of economic interest, based on performance information of animals and their relatives as well as on molecular information, in order to disseminate their genes in the population. Thus, to assure that the use of genetically superior animals will result in the increase of economic efficiency of commercial herds, it is important that breeding programs be economically oriented, and that they be achieved by the correct identification of traits to be included as breeding goals and obtaining their
economic values. Thus, superior animals can be ranked based on their total merit, that is, the adequate balance of traits, given by the summation of the estimated breeding values (EBV) of each trait of interest, weighted by their respective economic values (EV), as proposed by Hazel (1943), who developed the Index Selection Theory. When calculating economic values, production circumstances of commercial herds must be taken into account, since they are the consumers of superior genetics.
Miglior et al. (2005) surveyed the selection indexes of fifteen countries, from different geographical regions, taking into account participation in the Interbull International Evaluation Program and size of progeny testing programs. They provided a brief description of their national selection index and top bull listings from August 2003. Individual traits included in each selection index were grouped into three components related to production, durability, and health and reproduction. Both the relative emphasis for each component within the selection index, and the number of common bulls among top listings were compared across countries. Average relative emphasis for production, durability, and health and reproduction, across all countries, was 59.5, 28.0, and 12.5%, respectively, showing that production is still the most important component in selection indexes used in dairy cattle.
Studies on the definition of breeding goals based on calculated economic values for production and some functional traits for dairy cattle in Brazil have been developed for very punctual situations or based on theoretical possibilities (Madalena, 2000; Vercesi Filho et al., 2000; Martins et al., 2003; Bueno et al., 2004; Cardoso et al., 2004). As a result, no index has been used so far to rank animals in breeding programs or breeding decisions.
Commercial herds in Brazil are mostly based on the crosses between the traditional Zebu breeds, raised in the country for about a hundred years (Gir and Guzera), and the most widely used European dairy breed (Holstein Friesian), due to good combination of rusticity and production potential, resulting in animals well adapted to the tropics (Cardoso and Vercesi Filho, 2006).
Genetic evaluation programs involving Zebu dairy cattle have been carried out since the 1980’s. Traits considered in these evaluation programs are those related to milk production and composition, but other functional traits have been recorded as well (Vercesi Filho et al., 2010). On the other hand, semen of European breeds has been imported from the north hemisphere countries along time, from different countries. With the possibility of interchanging material and information between countries, a genetic evaluation program has been conducted by a subsidiary of an international breeding company, located in the northeast region of São Paulo State (Brazil) since 2008, aiming at the implementation of a progeny-testing program for the Holstein Friesian breed, with local breeding goals.
Possible factors that contributed to delay in the implementation of breeding programs for dairy cattle in Brazil were: organizational difficulties of the sector, economic instability (high inflation rates until 1994), absence of systematic milk recording programs to obtain
performance, health and other important traits data, as well as pedigree information, and absence of milk payment policies accounting for composition and quality, which could encourage farmers to pay more attention to composition and quality traits, etc. A regulatory program, establishing standards for composition, quality and health traits of milk, was proposed by the Ministry of Agriculture, known as IN51 (Instrução Normativa 51, MAPA, 2002), which began to influence payment policies of dairy industries around 2005 in the south and southeast regions of the country. As a result, the number of industries applying some sort of bonus or penalty based on that milk quality regulatory program has increased and this influence on the final milk price has become more evident. In 2011, IN51 was reviewed and IN62 (Instrução Normativa 62, MAPA, 2011) was published.
The objective of this work was to obtain economic values for milk production and quality traits for the main milk production systems prevailing in the south and southeast regions of Brazil that could be used for the posterior development of an economic index to rank animals in a breeding program in Brazil.
Material and Methods
Herds of Holstein Friesian and crossbred cows (Holstein × Zebu) included in the present study are involved in a dairy program of data recording, management and breeding decision aid and genetic evaluation of animals, developed since 2008 by a subsidiary of an international breeding company operating in Brazil.
Milk production systems were defined according to feeding management and production level of herds for the southeast region (represented by the states of Minas Gerais and São Paulo) and south region (represented by Paraná state). Diets were defined according to the proportion of each component, expressed in dry matter.
Defined MPS in the southeast region (SE) were:
1. Confined: cows kept in free stall during the whole year, receiving 60% of corn silage and 40% of concentrates (22% of crude protein - CP).
2. Semi-confined: cows kept in free stall during daytime, grazing during the night period, receiving 60% of roughage (50% of corn silage and 50% of pasture) and 40% of concentrates (22% CP) during the rainy season, and 60% of corn silage and 40% of concentrates (22% CP) during the dry season.
3. Rotational grazing with supplementation of corn silage during the dry season: cows kept on pastures of
consuming 65% of roughage (100% from grazing) and 35% of concentrates (18% CP) during the rainy season, and 60% corn silage and 40% of concentrates (22% CP) during the dry season.
4. Rotational grazing with supplementation of a mixture of sugar-cane and urea during the dry season: cows kept under grazing regime the whole year (Panicum sp.), receiving 75% of roughage (100% from grazing) and 25% of concentrates (18% CP) in the rainy season. In the dry season, cows receive 70% of roughage (100% mixture of sugar cane plus 0.5% urea) and 30% of concentrates (22% CP).
Defined MPS in the south region (S) were:
1. Confined: cows kept in free stall during the whole year, receiving 50% of roughage (60% corn silage and 40% pre-dried oat or rye grass) and 40% of concentrates (18% CP).
2. Semi-confined: cows kept in free stalls during daytime, grazing during the night period, receiving 50% of roughage (50% of corn silage, 30% of pre-dried oat or rye grass and 20% from grazing on oat or rye grass pastures) and 50% of concentrates (18% CP).
3. Rotational grazing with supplementation of corn silage during the dry season: cows receiving 50% roughage (100% from grazing on Tifton pastures) and 50% of concentrates (18% CP), during the raining season. During the dry season, cows receive 50% roughage (50% of corn silage and 50% of oat/rye grass pastures) and 50% of concentrate (18% CP).
The prices of the dietary components in the different MPS defined for the southeast region were acquired from annual reports of Instituto de Economia Agrícola in São Paulo (IEA, 2011), ANUALPEC (2010, 2011), and directly from the market (Tables 1 and 2). Prices for the south region were obtained from Fundação ABC (2011) and from the market.
Net energy requirements (ER) to produce 1 kg of milk with the respective protein and fat contents were calculated according to the formula presented in the NRC (2001):
ER Mcal = (% Fat * 0.0929) + (% Protein × 0.0547) + 0.192
Feeding costs with lactating cows were calculated for each MPS considering the prices, energy contents and quantities of distinct components fed to animals. Excel sheets were elaborated to obtain the average net energy content of feedstuffs that would be necessary to meet the estimated energy requirements previously calculated and their respective prices, expressed both in Mcal and in kilograms of dry matter, taking into account the different compounds of the different diets and seasons of the year (rainy and dry seasons and respective lengths expressed in months).
Base milk price is the average milk price considering the states of São Paulo, Minas Gerais and Paraná for the period of 2009-2011 (R$ 0.70). Bonus or penalty values for protein and fat percentages were added to this base price according to the situation, to compose final prices. The average exchange rate was US$ 1.00 = R$ 1.81 for the same period.
Each milk plant or industry has its own criteria to define bonus and penalty classes. What they have in common is the absence of bonus or penalty values for classes around the minimum limits established by the Ministry of Agriculture regulation program for fat (3%) and protein (2.9%) percentages and around the maximum limit of 400,000 somatic cell counts (Instrução Normativa 51, MAPA, 2002). To overcome this difficulty, all payment tables, with respective class definitions for protein and fat percentages, from seven different industries operating in the studied regions, were combined, and using linear regression analysis it was possible to establish a relationship between fat and protein percentages and their additional values paid across industries.
Data files, containing all average class intervals values, defined according to each company for each component, and respective additional payment values, were used to carry out regression analyses. Linear regression parameters were obtained using the SAS package (Statistical Analysis System, version 8). Final milk prices could be estimated
Table 1 - Prices of diet components for the different MPS defined for the southeast region
Component (R$)/kg DM
Corn silage 0.27
Sugar cane 0.20
Urea for cattle 1.70
Mixture of sugar cane + urea (0.5%) 0.22
Tanzania pasture 0.06
Concentrate 18% crude protein 0.88
Concentrate 22% crude protein 0.94
MPS - milk production system. US$ 1.00 = R$ 1.81.
Table 2 - Prices of diet components for the different MPS defined for the south region
Component (R$)/kg DM
Corn silage 0.20
Pre-dried oat silage 0.31
Pre-dried rye grass silage 0.31
Average pre-dried oat/rye grass 0.31
Oat pasture 0.18
Rye grass pasture 0.2
Average oat/rye grass pasture 0.19
Tifton pasture 0.15
Concentrate (18% crude protein) 0.68
by adding the estimated additional values for protein and fat percentages to the milk base value, as follows:
Y = A + bx,
in which Y is the estimated additional value for P% or F%;
A is the intercept; b is the parameter; and x is the class interval of payments of P% or F%.
Final milk prices could be estimated by adding the estimated additional payment values for protein and fat percentages to the milk base value (R$ 0.70).
Economic values (EV) were calculated according to the selection interest of maximizing profit (revenues– costs), assuming a fixed number of cows in the production system (Groen et al., 1997).
EV, profit = (1/n) × [δ (annual revenues) – δ (annual costs)]; in which δ = marginal difference of annual revenues (or costs), resulting from the increase in one unit of each trait due to genetic improvement, keeping the level of the other traits constant.
Economic values for MY, PY and FY were calculated at first for each MPS and region. A bio-economic model using Excel sheets was developed, where the energy requirements of lactating cows as well as the revenues and costs were calculated according to the average performance of cows based on test-day milk recording data.
To obtain EV for one extra kilogram of milk, it was considered the marginal difference between revenues and costs to produce one kilogram of milk with 2.9% P and 3.0% F. In developed countries, EV for milk is calculated for the vehicle, that is, milk without solids, because this is what the payment is based on. We chose to consider the minimum percentage values for protein and fat established by the government regulatory program, below which penalties are applied to milk prices.
To calculate EV for protein and fat yields, the original contents of these components were increased by 1% (one at a time, keeping the other constant), then costs and revenues were recalculated. Differences in profit due to the increase in 1% in protein and fat contents were multiplied by the average 305-day milk production of cows in each MPS and then the economic values were expressed in terms of one kilogram of each component.
To calculate the EV for SCC, records on test-day milk production data including the results for SCC obtained for the population of Holstein Friesian and crossbred cows (Holstein × Zebu) previously described were used in the present study. Payment classes defined for all industries were quite different among themselves and a reliable regression coefficient that could establish the relationship between SCC class intervals and their additional values paid across industries could not be obtained. Hence, to
evaluate the economic impact of the increase in SCC in this population, the additional values (whether positive or negative) paid by the different industries were distributed according to classes of 150,000 SCC and averaged inside classes, and the frequency of SCC test-day data across the different classes was calculated. Milk prices were calculated for each class by adding the average additional value to the base-milk price and the weighted average milk price was obtained for this population sample. The original SCC data were then increased by 1% and SCC data were reclassified. Milk prices were recalculated for each class. The difference between milk prices after and before increasing the original SCC values by 1% provided the economic value of SCC. This result was multiplied by the average 305-day milk yield of animals in the data set and EV SCC was then expressed both based on 305-day milk yield per cow per year and per each 100 cows in the herd per year.
Results and Discussion
The results of Tables 3 and 4 show that production levels, energy contents and prices of diets are compatible with intensification level of MPS in the southeast region, MPS1 showing the highest production level and feeding costs and MPS 4 showing the lowest milk production level and feeding costs. Diet prices did not differ for MPS in the south region. Herds in Paraná were grouped together due to the very small numbers of herds in MPS 1 and 3.
Linear regression equations obtained for the calculation of additional payment values for P and F contents (R2 of
0.85 in both cases) used in the composition of milk price were:
Additional P% = –0.2323999359 + (P %*0.079721769) and
Additional F% = –0.1473486848 + (F %*0.0459592356)
A linear regression equation obtained to establish a relationship between SCC classes and their additional values paid across industries was applied for SCC and SCS (somatic count scores), but R2 were lower (0.75 and 0.72,
respectively) and we chose not to use them to calculate economic values for SCC and SCS.
All economic values were positive, reflecting the effectiveness of the proposition of the government’s regulatory program (IN51) on payment policies of industries for milk components.
respectively), given that differences were small and should not interfere with the direction of economic responses to selection. The advantage would be the possibility of using the same economic index across MPS and regions.
It is important that breeding programs be able to reach a higher percentage of the animal population and that a greater number of animals can be tested under different management circumstances. In addition, genetic improvement is future orientated; therefore, the broader the knowledge of the economic impact of selection on different traits, closer realized and predicted responses will be. It is clear that economic values should be reviewed from times
to time, given that unexpected factors may occur and cause important changes in production and commercialization circumstances in the different regions.
Because of the great discrepancy among the SCC payment class tables of the different dairy industries, it was not possible to combine them to establish a relationship between the change in SCC and milk price. To provide an estimation of the economic loss of the 1% increase in the original values of SCC test-day records in the population, an alternative methodology to calculate the economic value of SCC was worked out (Table 6), as explained in the previous section.
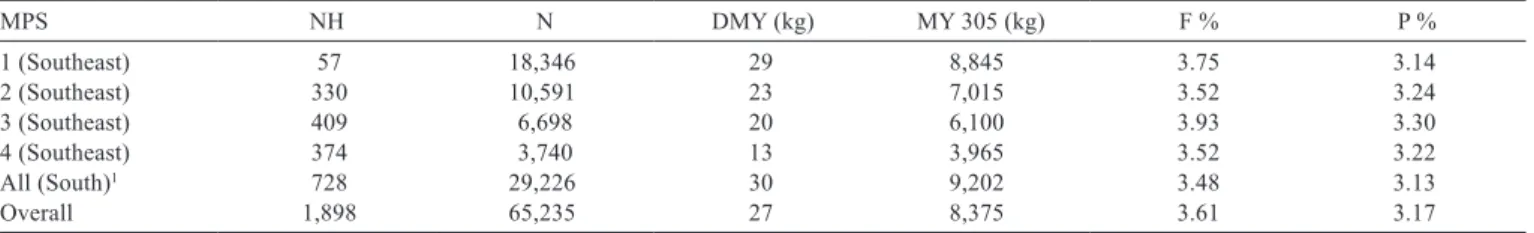
Table 3 - Number of herds (NH), number of test-day records (N), average test-day milk yields (DMY), average 305-day milk yields (MY305), fat (F %) and protein (P %) percentages, according to the different MPS and regions
MPS NH N DMY (kg) MY 305 (kg) F % P %
1 (Southeast) 57 18,346 29 8,845 3.75 3.14
2 (Southeast) 330 10,591 23 7,015 3.52 3.24
3 (Southeast) 409 6,698 20 6,100 3.93 3.30
4 (Southeast) 374 3,740 13 3,965 3.52 3.22
All (South)1 728 29,226 30 9,202 3.48 3.13
Overall 1,898 65,235 27 8,375 3.61 3.17
MPS - milk production system.
1 The performance of herds in Paraná was very similar, and due to the very small numbers of herds in MPS 1 and 3, they were all grouped together.
Table 4 - Energy content (Mcal) of 1 kg of dry matter and diets price, expressed in terms of kg of dry matter and Mcal, according to MPS and regions
MPS Mcal/kg DM Price/kg DM (R$) Price/Mcal (R$)
1 (Southeast) 1.68 0.54 0.32
2 (Southeast) 1.64 0.50 0.31
3 (Southeast) 1.58 0.43 0.27
4 (Southeast) 1.47 0.33 0.23
Average (Southeast) 1.59 0.45 0.28
1 (South) 1.37 0.40 0.29
2 (South) 1.52 0.44 0.29
3 (South) 1.57 0.45 0.28
Average (South) 1.49 0.43 0.29
MPS - milk production system. US$ 1.00 = R$ 1.81.
Table 5 - Economic values (R$) for milk, protein and fat productions, expressed based on one kilogram of each trait, according to the MPS and regions
MPS Trait
Milk (kg) Protein (kg) Fat (kg)
1 (Southeast) 0.50 6.21 1.60
2 (Southeast) 0.51 6.29 2.04
3 (Southeast) 0.53 6.50 2.09
4 (Southeast) 0.56 6.73 2.49
Average (Southeast) 0.52 6.43 1.98
1 (South) 0.51 6.38 1.89
2 (South) 0.51 6.38 1.90
3 (South) 0.51 6.41 1.94
Average (South) 0.51 6.39 1.91
Average (Southeast and South) 0.51 6.41 1.94
The average SCC and milk price before increasing SCC by 1% were 280,677.50 and R$ 0.7130. After increasing 1% in the original SCC data, the average SCC increased to 282,248.85 and the milk price lowered to R$ 0.7128. The difference between milk prices was –R$ 0.000167 (corresponding to an increase of 1,571.45 somatic cells). Looking at this value, it seems, at first, that the economic impact of the SCC is very low. On the other hand, if we consider the overall average among the studied production systems of 8,375 kg of milk per year (305 days), the total loss would correspond to –R$ 1.40 per cow per year and –R$ 139.86 per each 100 cows in the herd per year.
Somatic cell count does show an economic impact on the final price of milk and has been used in breeding programs as an indicator of mastitis resistance and should not be neglected in breeding programs of dairy cattle. On the other hand, given the Brazilian payment structure of milk concerning this particular milk quality aspect and the calculation difficulties inherent to the features of this variable, the use of this calculated EV may be not advisable at the moment. Alternative ways of including SCC in a selection index for dairy cattle selection purposes have been described in literature. In general, indexes are composed of sub-indexes including different groups of traits such as production, health and fertility, and/or longevity traits. Based on the correlation structures and possible expected response that could be achieved in the proposition of such indexes, weights are attributed to the different groups of traits as shown by Miglior et al. (2005).
So far, no type of selection index has been applied in genetic evaluation programs in Brazil. The proposition of economic indexes for milk production and quality traits could be considered an important step for the local dairy cattle breeding. As the amount of information on other traits of importance increases (economic functional type, health and fertility traits), new traits could be considered in genetic evaluations
and more comprehensive indexes could be elaborated to rank animals in breeding programs.
Conclusions
Due to the changes observed in the last years in the milk payment policies by the dairy industries in Brazil, as a result of the implementation of IN51, selection for milk components (protein and fat) has become economically advantageous. Consequently, the calculation of economic values and the proposition of economic index based on production traits became feasible.
The small differences among economic values for milk, protein and fat across the different milk production systems involved in the present work indicate that it is possible to use economic index including the average economic values obtained for milk, protein and fat production, to be used in breeding programs in Brazil carried out in the southeast and south regions, the main milk production regions in the country.
Somatic cell count does have an economic impact on the final price of milk and consequently on the annual profit of herds. Besides, it has been used in breeding programs of dairy cattle as an indicator of mastitis resistance and should not be neglected in breeding programs of dairy cattle.
At the moment the great discrepancy among the different payment policies for somatic cell count makes it not advisable to obtain an economic value for this particular trait. Alternative ways of including somatic cell count in a selection index for dairy cattle selection purposes based on the correlation structures and possible expected response that could be achieved should be examined.
Acknowledgments
The authors are thankful to Conselho Nacional de Desenvolvimento Tecnológico - CNPq, for the financial
Table 6 - Class intervals and average class value, with the respective additional values and milk prices, distribution of SCC value based in the original SCC data in the population (frequency 1) and after increasing it by 1% (frequency 2)
Class intervals Average SCC value Bonus SCC (R$) Milk price (R$) Frequency (1) Frequency (2)
0-150,000 75,000 0.0263 0.7263 57.50 57.21
150,001-300,000 225,000 0.0186 0.7186 14.53 14.65
300,001-450,000 375,000 0.0024 0.7024 6.77 6.74
450,001-600,000 525,000 –0.0102 0.6898 3.97 4.06
600,001-750,000 675,000 –0.0189 0.6811 2.91 2.89
750,001-1000,000 875,000 –0.0232 0.6768 3.29 3.26
> 1000,000 1000,000 –0.0292 0.6708 11.02 11.17
support and to CRV-Lagoa, for providing the data and field information.
References
ANUALPEC. 2010. Anuário da pecuária brasileira. FNP, São Paulo. ANUALPEC. 2011. Anuário da pecuária brasileira. FNP, São Paulo. Bueno, P. R. B.; Rorato, P. R. N.; Dürr. J. W. and Krug, E. E. B. 2004.
Valor econômico para componentes do leite no estado do Rio Grande do Sul. Revista Brasileira de Zootecnia 33:2256-2265. Cardoso, V. L.; Nogueira, J. R.; Vercesi Filho, A. E.; El Faro, L. and
Lima, N. C. 2004. Objetivos de seleção e valores econômicos de características de importância econômica para um sistema de produção de leite a pasto na Região Sudeste. Revista Brasileira de Zootecnia 33:320-327.
Cardoso, V. L. and Vercesi Filho, A. E. 2006. Alternative crossbreeding strategies for dairy cattle production in tropical circumstances. 7p. In: Proceedings of the 8th World Congress on Genetic Applied to Livestock Production. Belo Horizonte, Brazil.
Fundação ABC. Pesquisa e Desenvolvimento Agropecuário. 2011. Custo de forrageiras safra 2010/2011. Available at: <http://www. fundacaoabc.org.br/> Accessed on: Nov. 8, 2011.
Groen, A. F.; Steine, T.; Colleau, J. J.; Pedersen, J.; Pribyl, J. and Reinsch, N. 1997. Economic values in dairy cattle breeding, with special reference to functional traits. Report of an EAAP-working group. Livestock Production Science 49:1-21.
Hazel, L. N. 1943. The genetic basis for constructing genetic indexes. Genetics 28:476-490.
Harris, D. L. 1998. Livestock improvement: art, science or industry? Journal of Animal Science 76:2294-2302.
IEA - Instituto de Economia Agrícola. 2011. Banco de dados. Available at: <http://www.iea.sp.gov.br/out/bancodedados.html>. Accessed on: Nov. 8, 2011.
Madalena, F. E. 2000. Valores econômicos para a seleção de gordura e proteína do leite. Revista Brasileira de Zootecnia 29:678-684.
MAPA - Ministério da Agricultura, Pecuária e Abastecimento. Secretaria da Defesa Agropecuária. 2002. Instrução Normativa Nº 51, de 18 de setembro de 2002. Available at: <http://www. qualidadedoleite.com.br/hd/arquivos/IN51de2002_leitecrunormas.pdf> Accessed on: Sept. 5, 2012.
MAPA - Ministério da Agricultura, Pecuária e Abastecimento. Secretaria da Defesa Agropecuária. 2011. Instrução Normativa Nº 62, de 29 de dezembro de 2011. Available at: <http://www. cienciadoleite.com.br/?action=1&type=6&a=329> Accessed on: Sept. 5, 2012.
Martins, G. A.; Madalena, F. E.; Bruschi, J. H.; Costa, J. L. and Monteiro, J. B. N. 2003. Objetivos econômicos de seleção de bovinos de leite para fazenda demonstrativa na Zona da Mata de Minas Gerais. Revista Brasileira de Zootecnia 32:304-314.
Miglior, F.; Muir, B. L. and Van Doormaal, B. J. 2005. Selection indices in holstein cattle of various countries. Journal of Dairy Science 88:1255-1263.
Norman, H. D.; Wright, J. R. and Miller, R. H. 2010. Response to alternative genetic-economic indices for Holsteins across 2 generations. Journal of Dairy Science 93:2695-2702.
NRC - National Research Council. 2001. Nutrient requirements of dairy cattle. 7th rev. ed. The National Academies Press, Washington, DC.
VanRaden, P. M. 2004. Invited Review: Selection on net merit to improve lifetime profit. Journal of Dairy Science 87:3125-3131.
Vercesi Filho, A. E.; Madalena, F. E.; Ferreira, J. J. and Penna, V. M. 2000. Pesos econômicos para seleção de gado de leite. Revista Brasileira de Zootecnia 29:145-152.
Vercesi Filho, A. E.; Verneque, R. S.; Peixoto, M. G. C.; Machado, M. A.; Penna, V. M. and Cardoso, V. L. 2010. Selection of tropical dairy cattle - Experience from the Brazilian Gyr and Guzerat. 8p. In: Proceedings of the 10th World Congress on Genetics Applied to Livestock Production. Leipzig, Germany.