Ksenija Taski‑Ajdukovic(1), Vuk Djordjevic(1), Milos Vidic(1) and Milka Vujakovic(1)
(1)Institute for Field and Vegetable Crops, Maksima Gorkog 30, 21000, Novi Sad, Serbia. E‑mail: [email protected], [email protected], [email protected], [email protected]
Abstract – The objective of this work was to quantify the accumulation of the major seed storage protein subunits, β‑conglycinin and glycinin, and how they influence yield and protein and oil contents in high‑protein soybean genotypes. The relative accumulation of subunits was calculated by scanning SDS-PAGE gels using densitometry. The protein content of the tested genotypes was higher than control cultivar in the same maturity group. Several genotypes with improved protein content and with unchanged yield or oil content were developed as a result of new breeding initiatives. This research confirmed that high‑protein cultivars accumulate higher amounts of glycinin and β‑conglycinin. Genotypes KO5427, KO5428, and KO5429, which accumulated lower quantities of all subunits of glycinin and β‑conglycinin, were the only exceptions. Attention should be given to genotypes KO5314 and KO5317, which accumulated significantly higher amounts of both subunits of glycinin, and to genotypes KO5425, KO5319, KO539 and KO536, which accumulated significantly higher amounts of β‑conglycinin subunits. These findings suggest that some of the tested genotypes could be beneficial in different breeding programs aimed at the production of agronomically viable plants, yielding high-protein seed with specific composition of storage proteins for specific food applications.
Index terms: Glycine max, β‑conglycinin, glycinin, protein content, subunit composition.
Composição de subunidades de proteínas de reserva em genótipos de soja
com alto teor de proteína
Resumo – O objetivo deste trabalho foi quantificar o acúmulo das principais subunidades de proteínas de reserva da soja, β‑conglicinina e glicinina, e como elas influenciam a produtividade e os conteúdos de proteína e de óleo em genótipos de soja com alto conteúdo de proteína. A acumulação relativa de subunidades foi calculada por escaneamento em géis SDS‑PAGE, com uso de densitometria. O conteúdo de proteínas dos genótipos testados foi maior que o da cultivar controle dentro do mesmo grupo de maturação. Vários genótipos com conteúdo de proteína aumentado, mas com produtividade ou conteúdo de óleo inalterados, foram desenvolvidos como resultados de novas iniciativas de melhoramento. Esta pesquisa confirmou que as cultivares com alto conteúdo de proteína acumulam maior quantidade de glicinina e β‑conglicinina. Os genótipos KO5427, KO5428, e KO5429, que acumularam menor quantidade de todas as subunidades de glicinina e β‑conglicinina, foram as únicas exceções. Deve‑se atentar para os genótipos KO5314 e KO5317, que acumularam quantidades significativamente maiores das duas subunidades da glicinina, e para os genótipos KO5425, KO539 e KO536, que acumularam quantidades significativamente maiores das subunidades de β‑conglicinina. Estes resultados indicam que alguns dos genótipos testados poderiam ser benéficos em programas de melhoramento que visem à produção de plantas agronomicamente viáveis, com sementes com alto conteúdo de proteínas e composição específica de proteínas de reserva para fins alimentícios definidos.
Termos para indexação: Glycine max, β‑conglicinina, glicinina, conteúdo de proteína, composição das
subunidades.
Introduction
Soybean [Glycine max L. (Merr.)] is an important source of edible vegetable oil and protein throughout the world and is used in a multitude of food and industrial applications. Seeds of the most commercially grown soybean cultivars contain
an average of 360–380 g kg-1 protein and 190 g kg-1
oil; however, both genetic and environmental factors
strongly influence seed composition (Brumm &
Hurburgh Junior, 2002; Zarkadas et al., 2007). More recently, soybean genotypes have been bred to increase seed yield and oil content, since they are mainly
protein meal is mainly used as a source of protein for animal husbandry. With the current increase in meat consumption, the demand for protein in animal husbandry has increased. A major impediment to increasing soybean protein through selective breeding lies in the negative correlation between protein content and yield, on one hand, and oil content and yield on the
other (Burton, 1987). Nevertheless, soybean breeders
have made notable progress in overcoming that negative correlation and have developed agronomically
viable high protein cultivars (Cober & Voldeng, 2000; Wilcox, 2001).
Soybean storage proteins have two major fractions,
β‑conglycinin (7S) and glycinin (11S), accounting for approximately 70% of the total proteins. Glycinin accounts for about 60% of storage proteins and β‑conglycinin for the remaining 40%. β-conglycinin is a glycoprotein with molecular weight of 150–175 x 103, and is formed by various combinations of three nonidentical but homologous polypeptide
subunits (α’, α and β) (Thanh & Shibasaki, 1978). Glycinin is a hexamer with a molecular weight between 320–375 x 103. Each subunit consists of an acidic and
a basic polypeptide linked by a disulfide bond (Mori et al., 1981).
The major storage proteins do not contain many sulphur aminoacids, although glycinin contains
more (3 to 4.5%) than β‑conglycinin (less than 1%). Humans and monogastric animals are unable
to synthesize sulphur amino acids, and it has been shown that soybean proteins do not provide adequate sulphur amino acids to meet the dietary requirements. As soybean is widely used in animal feeding, and its consumption by humans gradually increases due
to the beneficial effect of soybean on human health,
improvement of the nutritive value of the globulin ratio in soybean seed became very important. In addition, the functional properties of soybean proteins, as emulsifying or foaming agents for food formulation, are limited by the globular structure of glycinin (Poysa
et al., 2006). Such findings provide an opportunity for soybean breeders to develop genotypes with specific protein compositions for specific food applications.
The objective of the present work was to estimate the accumulation of the main seed storage protein subunits,
glycinin and β‑conglycinin, among high‑protein soybean
genotypes, and to determine whether these genotypes
preferentially accumulate specific polypeptides and how
this influences the yield and the protein and oil contents
in different maturity groups.
Materials and Methods
Forty soybean genotypes developed at the Institute
for Field and Vegetable Crops in Novi Sad, Serbia,
were used in the study. The genotypes belonged to maturity groups 0, I, II and III. Each of the groups was represented by nine newly developed high-protein genotypes and one commercially grown cultivar. A commercial cultivar from each appropriate maturity group (with average protein content for high-yielding genotypes) was used as control. Two-year trials were
carried out at Institute’s experimental fields in Rimski
Sancevi. The dominant soil type was calcareous
Chernozem with a pH of 7.65 and organic matter content of 3.3%. Field trials were carried out in a
completely randomized design, with three replicates and four rows (4 m) per genotype, with 0.45-m spacing between rows. Standard agronomic practices were followed.
Protein and oil content were determined by
near‑infrared reflectance (NIR) spectroscopy, using PERTEN DA 7000 (Perten, Stockholm, Sweden), with
a sample of 250 g of intact soybean seeds. Protein and oil contents were calculated on dry basis.
Soybean seeds were ground in a Thermomix,
Worwerk (The Pinehill Partnership Ltd., Berkshire, England). Forty milligrams of seed powder were
extracted in 1 mL of extraction buffer (0.03 mol L-1
Tris‑HCl pH 8.0 containing 0.01 mol L-1
β‑mercaptoethanol). The samples were left for one hour
at room temperature with rotation every 10 min. The
samples were then centrifuged for 20 min at 11 x 103g
at room temperature. The soluble protein concentration in the supernatant was analyzed according to the
Bradford method (Bradford, 1976) with bovine serum
albumin (BSA) as standard.
Electrophoresis SDS-PAGE was carried out according to the standard procedure (Laemmli, 1970)
in 1.5 mm thick gels with 12.5% (w/v) separating gel and 5% (w/v) stacking gel in a vertical electrophoresis unit (Carl Roth GmbH, Karlsruhe, Germany). In
used to estimate the molecular weight ranges of polypeptides and to identify the subunits of the major soybean proteins. The last two wells at the opposite end of each gel contained proteins from the soybean
cultivar Vojvodjanka, used for comparison and ratio calculations. Samples of the specific soybean
genotypes were loaded in the remaining inside wells.
Fifty microliters of the extract were mixed with 50μL
of SDS-sample buffer (0.15 mol L-1 TRIS-HCl, pH
6.8, 3% w/v SDS, 5% v/v β‑mercaptoethanol, 7% v/v glycerol and 0.03% bromphenol blue) and heated for 3 min in a boiling water bath. The solution was cooled to room temperature and 15 μL of the sample was
loaded onto each well. SDS-PAGE was carried out at 25 mA per gel until the tracking dye had migrated through the stacking gel and, then, at 45 mA per gel until the bromphenol blue was at the bottom of the gel. The temperature of 15–20°C was obtained by circulating tap water through the tank buffer. The gels
were stained with 0.1% Coomassie Brilliant Blue
R-250 (Sigma-Aldrich GmbH, Steinheim, Germany)
in methanol: acetic acid: distilled water (3:1:6) during
two hours. When properly stained, gels were destained in the same solution without dye.
The protein bands on the destained gel were
quantified using the ImageJ software (Rasband, 2010).
In order to quantify the subunits of seed storage proteins,
the specified protein band of the tested genotypes was compared to the same protein band of the Vojvodjanka
cultivar. The standardized values were then analyzed
by pair wise mean comparisons (t test) for significance
between all pairs of genotypes in each maturity group.
Principal factor analysis was done using the Statistica 8
(StatSoft, 2010) software. After principal component
analysis, factors were rotated by the varimax method.
Results and Discussion
Protein contents differed significantly in all the
soybean genotypes studied in all the maturity groups (Table 1). The protein content of the new soybean
genotypes, except for KO5319, in all maturity groups was significantly higher than the protein content in
the control cultivar of each maturity group. Genotype
KO531 had the highest protein content, with about 90
g kg-1 more seed protein than the control, followed
by genotype KO5427 with ca. 75 g kg-1 seed protein.
These results agree with those previously reported
by Krishnan (2001) and Poysa et al. (2006). Control
genotypes of all maturity groups had the highest oil content, but the oil content of high-protein genotypes was similar to that of commercially grown soybean
Table 1. Yield, protein and oil content of high-protein
soybean genotypes and control cultivars(1).
Genotype Yield
(kg ha-1)
Seed protein (g kg-1)
Seed oil (g kg-1)
Protein/oil
ratio Maturity group 0
Afrodita 5393±123a 385±0.6e 212±0.3a 1.8±0.01g
KO5439 3614±49d 434±5.0a 174±4.5f 2.5±0.09a KO5438 4334±93b 408±2.3d 192±2.1cd 2.1±0.03d KO5437 3969±73c 426±2.9b 189±2.5de 2.3±0.04bc KO5436 4468±139b 405±4.2d 1972.0±c 2.1±0.04de KO5435 4560±43b 419±2.9bc 187±1.5de 2.2±0.03c KO5434 4546±128b 409±2.1d 209±1.2a 1.9±0.02ef KO5433 4280±42b 435±2.0a 184±0.9e 2.4±0.02b KO5432 4517±110b 404±1.3d 209±1.4ab 1.9±0.01f KO5431 4451±134b 412±1.9cd 203±1.0b 2.0±0.01def
Maturity group I
Balkan 4996±61ab 384±1.5h 211±1.5a 1.8±0.02g
KO5429 4496±55c 436±5.0b 180±3.0e 2.4±0.06b KO5428 4597±45bc 414±1.3ef 190±0.6d 2.2±0.01de KO5427 4528±151c 459±1.3a 158±0.4f 2.9±0.01a KO5426 4797±26abc 404±1.9g 192±1.1cd 2.1±0.01def KO5425 4403±241c 428±2.5c 183±0.6e 2.3±0.02c KO5424 4998±174ab 407±2.2g 199±1.9b 2.0±0.03f KO5423 5177±68a 409±0.7fg 195±0.7c 2.1±0.01ef KO5422 4798±136abc 419±0.8de 192±0.9cd 2.2±0.01d KO5421 4471±139c 422±1.6cd 184±1.9e 2.3±0.02c
Maturity group II
Vojvodjank 5576±159a 379±2.9e 211±1.0a 1.8±0.01g KO5319 5468±155ab 385±0.1e 208±1.4a 1.8±0.01g KO5318 4093±180cd 441±4.8a 164±1.2g 2.7±0.04b KO5317 4651±127bcd 442±2.0a 157±1.0h 2.8±0.02a KO5316 4822±184abc 433±1.5b 171±0.5f 2.5±0.01c KO5315 4155±138cd 441±1.7a 176±0.3e 2.5±0.01c KO5314 4538±212cd 433±1.7b 180±0.9cd 2.4±0.02d KO5313 4626±190cd 423±1.6c 183±1.5c 2.3±0.01e KO5312 4004±145d 415±1.9d 192±0.6b 2.2±0.01f KO5311 4692±195bcd 422±2.1c 178±0.5de 2.4±0.01de
Maturity group III
Morava 5702±174a 372±2.0f 220±1.6a 1.7±0.02g
KO539 4972±174abcd 416±1.1de 191±0.5b 2.2±0.01ef KO538 5057±194abc 413±1.3e 191±1.6b 2.1±0.02f KO537 5360±131ab 421±0.8d 188±0.8cd 2.3±0.01e KO536 4646±233bcd 418±1.9de 191±1.6bc 2.2±0.02ef KO535 4572±35cd 436±3.9c 185±1.4d 2.4±0.03d KO534 4885±194bcd 434±1.0c 173±0.3e 2.5±0.01c KO533 4244±209d 451±0.9b 160±0.2g 2.8±0.01b KO532 4696±142bcd 453±1.6b 164±1.1f 2.8±0.02b KO531 4461±183cd 462±3.4a 157±1.7h 2.9±0.05a
(1)Mean±standard errors followed by equal letters do not differ, at 5%
cultivars. Genotypes KO5434, KO5432, and KO5319
remained in the same group as their controls. The oil content varied from 157–220 g kg-1, which was
in accordance with the results obtained by Yaklich
(2001) and Poysa et al. (2006) for newly developed
high-protein soybean genotypes. The highest
protein‑to‑oil ratio was found in genotypes KO531 and KO5427. Except for KO5319, all new soybean genotypes showed significantly higher ratios than the
controls.
Yield of the control cultivars was significantly higher than most of the new soybean genotypes, except for genotypes KO5428, KO5426, KO5424, KO5423 and KO5422, in maturity group I, KO5319 and KO5316, in maturity group II, and KO539, KO538, KO537, in
maturity group III, which were similar to the controls for the respective maturity groups (Table 1). All
genotypes with unchanged yield, except for KO5319,
had improved protein content but lower oil content in
comparison to the controls. Genotypes KO5434 and KO5432 were the only ones with improved protein
content and unchanged oil content, in comparison to the control, but with lower yield. Therefore, these
results confirm the well‑documented (Burton, 1987; Helms et al., 1998) negative correlations between
protein content, yield and oil content.
Patterns of total soybean proteins of some
high‑protein soybean varieties and cultivar Vojvodjanka
on SDS-polyacrylamide gel are shown in Figure 1. The protein bands were similar among all soybean varieties.
On the gel, the 7S protein fraction was separated into α’, α and β subunits with molecular weights of approximately 81,000, 74,000 and 50,000, respectively. The 11S protein
fraction was separated into acidic and basic subunits. The group of polypeptides near the molecular weight of
about 35,000 was a major group of acidic polypeptides.
Figure 1. SDS-PAGE gel of the total proteins of high-protein soybean genotypes. 1, molecular weight markers (kDa); 2–10,
The group of protein bands with molecular weight
values of approximately 14,000 represents the basic
components. These results corroborate those reported by other authors (Yaklich, 2001; Zarkadas et al., 2007,
Taski‑Ajdukovic et al., 2008).
Due to their abundance, β‑conglycinin and glycinin
were the main factors responsible for soybean protein quality. The data in Table 2 show that all genotypes
of maturity group 0, except for KO5431, contained significantly more of the α’ and α subunits of
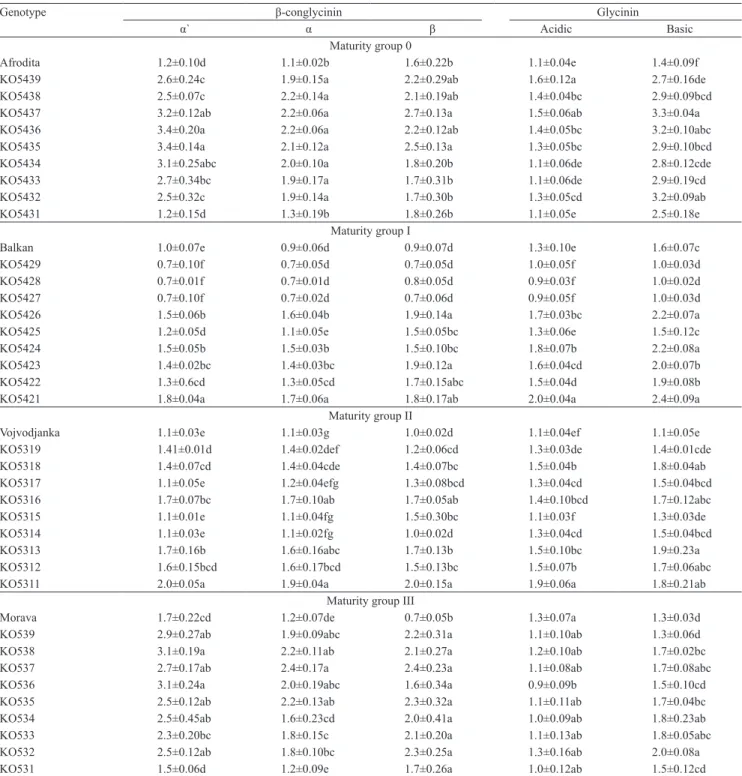
Table 2. Relative expressions of seed storage protein subunits in high‑protein soybean genotypes and control cultivars(1).
Genotype β‑conglycinin Glycinin
α` α β Acidic Basic
Maturity group 0
Afrodita 1.2±0.10d 1.1±0.02b 1.6±0.22b 1.1±0.04e 1.4±0.09f
KO5439 2.6±0.24c 1.9±0.15a 2.2±0.29ab 1.6±0.12a 2.7±0.16de KO5438 2.5±0.07c 2.2±0.14a 2.1±0.19ab 1.4±0.04bc 2.9±0.09bcd KO5437 3.2±0.12ab 2.2±0.06a 2.7±0.13a 1.5±0.06ab 3.3±0.04a KO5436 3.4±0.20a 2.2±0.06a 2.2±0.12ab 1.4±0.05bc 3.2±0.10abc KO5435 3.4±0.14a 2.1±0.12a 2.5±0.13a 1.3±0.05bc 2.9±0.10bcd KO5434 3.1±0.25abc 2.0±0.10a 1.8±0.20b 1.1±0.06de 2.8±0.12cde KO5433 2.7±0.34bc 1.9±0.17a 1.7±0.31b 1.1±0.06de 2.9±0.19cd KO5432 2.5±0.32c 1.9±0.14a 1.7±0.30b 1.3±0.05cd 3.2±0.09ab KO5431 1.2±0.15d 1.3±0.19b 1.8±0.26b 1.1±0.05e 2.5±0.18e
Maturity group I
Balkan 1.0±0.07e 0.9±0.06d 0.9±0.07d 1.3±0.10e 1.6±0.07c
KO5429 0.7±0.10f 0.7±0.05d 0.7±0.05d 1.0±0.05f 1.0±0.03d KO5428 0.7±0.01f 0.7±0.01d 0.8±0.05d 0.9±0.03f 1.0±0.02d KO5427 0.7±0.10f 0.7±0.02d 0.7±0.06d 0.9±0.05f 1.0±0.03d KO5426 1.5±0.06b 1.6±0.04b 1.9±0.14a 1.7±0.03bc 2.2±0.07a KO5425 1.2±0.05d 1.1±0.05e 1.5±0.05bc 1.3±0.06e 1.5±0.12c KO5424 1.5±0.05b 1.5±0.03b 1.5±0.10bc 1.8±0.07b 2.2±0.08a KO5423 1.4±0.02bc 1.4±0.03bc 1.9±0.12a 1.6±0.04cd 2.0±0.07b KO5422 1.3±0.6cd 1.3±0.05cd 1.7±0.15abc 1.5±0.04d 1.9±0.08b KO5421 1.8±0.04a 1.7±0.06a 1.8±0.17ab 2.0±0.04a 2.4±0.09a
Maturity group II
Vojvodjanka 1.1±0.03e 1.1±0.03g 1.0±0.02d 1.1±0.04ef 1.1±0.05e KO5319 1.41±0.01d 1.4±0.02def 1.2±0.06cd 1.3±0.03de 1.4±0.01cde KO5318 1.4±0.07cd 1.4±0.04cde 1.4±0.07bc 1.5±0.04b 1.8±0.04ab KO5317 1.1±0.05e 1.2±0.04efg 1.3±0.08bcd 1.3±0.04cd 1.5±0.04bcd KO5316 1.7±0.07bc 1.7±0.10ab 1.7±0.05ab 1.4±0.10bcd 1.7±0.12abc KO5315 1.1±0.01e 1.1±0.04fg 1.5±0.30bc 1.1±0.03f 1.3±0.03de KO5314 1.1±0.03e 1.1±0.02fg 1.0±0.02d 1.3±0.04cd 1.5±0.04bcd KO5313 1.7±0.16b 1.6±0.16abc 1.7±0.13b 1.5±0.10bc 1.9±0.23a KO5312 1.6±0.15bcd 1.6±0.17bcd 1.5±0.13bc 1.5±0.07b 1.7±0.06abc KO5311 2.0±0.05a 1.9±0.04a 2.0±0.15a 1.9±0.06a 1.8±0.21ab
Maturity group III
Morava 1.7±0.22cd 1.2±0.07de 0.7±0.05b 1.3±0.07a 1.3±0.03d
KO539 2.9±0.27ab 1.9±0.09abc 2.2±0.31a 1.1±0.10ab 1.3±0.06d KO538 3.1±0.19a 2.2±0.11ab 2.1±0.27a 1.2±0.10ab 1.7±0.02bc KO537 2.7±0.17ab 2.4±0.17a 2.4±0.23a 1.1±0.08ab 1.7±0.08abc KO536 3.1±0.24a 2.0±0.19abc 1.6±0.34a 0.9±0.09b 1.5±0.10cd KO535 2.5±0.12ab 2.2±0.13ab 2.3±0.32a 1.1±0.11ab 1.7±0.04bc KO534 2.5±0.45ab 1.6±0.23cd 2.0±0.41a 1.0±0.09ab 1.8±0.23ab KO533 2.3±0.20bc 1.8±0.15c 2.1±0.20a 1.1±0.13ab 1.8±0.05abc KO532 2.5±0.12ab 1.8±0.10bc 2.3±0.25a 1.3±0.16ab 2.0±0.08a KO531 1.5±0.06d 1.2±0.09e 1.7±0.26a 1.0±0.12ab 1.5±0.12cd
β‑conglycinin than the Afrodita control cultivar. In maturity group I, there were significantly more α’ and α subunits of β‑conglycinin than in the control in all genotypes, except for KO5427, KO5428, and KO5429, that had significantly less of those subunits. In maturity group II, there were also significantly more α’ and α subunits of β‑conglycinin in KO5311, KO5313, KO5316, KO5312, KO5318, and KO5319 genotypes in
comparison to the control. Morava, the control cultivar
of maturity group III, had significantly lower content of α’ subunits compared with all tested genotypes, except for KO531 and KO533. It also had significantly lower content of α subunits except for genotypes KO531 and KO534. Comparing the β subunits of β‑conglycinin of
high-protein soybean genotypes, of the maturity group 0, to that of the Afrodita normal seed protein line, it was
found that only genotypes KO5437 and KO5435 were significantly higher. In maturity group I, these subunits were significantly higher in all genotypes, except for KO5427, KO5428, and KO5429. Genotypes KO5311, KO5316, KO5313, KO5315, KO5312, and KO5318 contained noticeably more β subunits of β‑conglycinin
than the control cultivar of maturity group II. In
maturity group III, these subunits were significantly
lower in the Morava control cultivar, when compared to all of the tested genotypes.
Glycinin acetic polypeptides were significantly higher in all tested genotypes, except for KO5431, KO5434, and KO5433 in maturity group 0. In maturity group I, genotypes KO5427, KO5428, and KO5429 contained significantly less acetic polypeptides, while genotypes KO5421, KO5424, KO5426, KO5423, and KO5422 contained significantly more of these subunits than the Balkan control cultivar. Genotypes KO5311, KO5318, KO5312, KO5413, KO5316, KO5317, and
KO5314 had significantly higher amounts of acidic polypeptides than the Vojvodjanka control cultivar of maturity group II. Only genotype KO536 from maturity group III differed significantly from the
Morava control.
The basic glycinin polypeptides were significantly
higher in all genotypes within maturity group 0.
Genotypes KO5427, KO5428, and KO5429 had significantly lower amount of acetic subunits, whereas genotypes KO5421, KO5424, KO5426, KO5423, and KO5422 in maturity group I had significantly higher contents. Only genotypes KO5319 and KO5315 from maturity group II and genotypes KO531, KO536, and KO539 did not differ significantly from the controls.
Significant correlations were found among all of the investigated subunits, except for the glycinin acidic
subunit, and other protein subunits in maturity group
III (Tables 3 and 4). Most of the subunits did not show significant correlations with protein content, except in maturity group I. Only the basic glycinin subunit showed weak significant correlation with the protein content across all the maturity groups. Fehr et al. (2003) observed
no correlation between soybean protein subunits
and protein content. This finding indicates that it is
possible to select soybean genotypes for desired protein
composition without influence on protein content. In
maturity group 0, all subunits were negatively correlated with yield in contrast to maturity group I, where none of
subunits was correlated with yield. Except for maturity group I, β‑subunits of β‑conglycinin were negatively
correlated with yield in all maturity groups.
Earlier studies showed that high-protein cultivars
accumulated higher amounts of glycinin and β‑conglycinin (Yaklich, 2001; Krishnan et al., 2007). This study confirmed this observation, except for genotypes KO5427,
Table 3. Estimates of phenotypic correlation coefficients among yield, protein and oil contents and protein subunits of
soybean genotypes maturity group 0 (above diagonal) and maturity group I (below diagonal), at 5% probability.
Yield Protein Oil Protein/oil α` subunit α subunit β subunit Acidic Basic
Yield ‑0.64 0.61 ‑0.63 -0.42 ‑0.53 ‑0.43 ‑0.62 ‑0.56
Protein ‑0.48 ‑0.86 0.93 ns 0.26 ns ns 0.35
Oil 0.49 ‑0.96 ‑0.98 ‑0.26 ‑0.28 ns -0.42 ns
Protein/oil -0.47 0.98 -0.99 ns ns ns 0.35 ns
α` subunit ns ‑0.34 0.3 ‑0.35 0.82 0.67 0.57 0.77
α subunit ns ‑0.38 0.34 ‑0.39 0.98 0.67 0.67 0.76
β subunit ns ‑0.31 ns ‑0.31 0.89 0.92 0.69 0.50
Acidic ns ‑0.38 0.38 -0.41 0.92 0.91 0.76 0.50
Basic ns ‑0.37 0.34 ‑0.39 0.96 0.96 0.88 0.94
KO5428, and KO5429, which accumulated smaller amounts of all subunits of glycinin and β‑conglycinin,
in comparison to the controls. However, according to the
protein content, these genotypes occupied first, sixth, and
second place, respectively. This can be the reason why the correlation between protein content and presence of subunits was found to be negative.
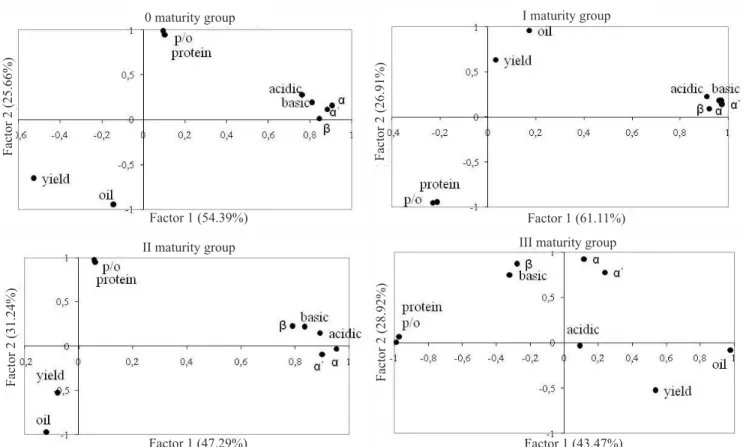
Principal factor analyses identified two principal
components in maturity groups 0, I and II and three in
maturity group III (Figure 2). The first two principal components explain between 72 and 88% of the total
variation. All protein subunits were separated by factorial analysis and put aside. Protein content and
protein/oil ratio are on the opposite side of yield and
oil content on the loading plot, due to their mutual y
inverse relationships. No differences between protein
subunits in maturity groups 0, I and II were observed. In maturity group III, the acidic subunit was separated
from other subunits, and this variation was explained by the third principal component. Expression of acidic
subunit of glycinin in high protein genotypes of maturity group III was low, and there was no enhancement of this subunit in comparison to the Morava control cultivar. Principal factor analysis pointed out the interrelationships between yield, protein, oil content, and protein structure and showed the independence of protein subunit content from the other analyzed traits.
Knowledge on subunit production could significantly
affect the quality of protein stored in the soybean seed (Yaklich, 2001). Glycinin is a better source of
sulphur amino acids than β‑conglycinin. The subunits of glycinin in the tested genotypes were expressed
differently, indicating that some of them could be used in selection for cultivars with desirable amino acid
composition. Attention should be paid to genotypes
KO5314 and KO5317, which accumulated significantly
higher quantity of both glycinin subunits (basic and
acidic) with no significant influence on β‑conglycinin. In contrast, genotypes KO5425, KO5319 and KO539 accumulated higher amounts of β‑conglycinin subunits with no significant differences on glycinin subunits, and KO536 with significant lower glycinin acetic
polypeptides. As reported by Pesic et al. (2005), the
level of β‑conglycinin had a positive influence on protein extractability. Having this in mind, these
genotypes can be used in soybean breeding for the
food industry, where greater extractability of protein is needed. It is also important to find a balance between
farmers´ demand for high yielding varieties with the demand of the processing industry for enhanced protein
content and specific protein composition.
Thus, some genotypes can be selected for future
research. Genotype KO5316 has a yield similar to control cultivar Vojvodjanka with higher protein content (approximately 50 g kg-1). Although the
yields of genotypes KO5426, KO5424, KO5423 and KO5422 were not significantly different from Balkan,
their protein content was about 20 g kg-1 higher. An
increased protein content in these genotypes was due
to enhanced glycinin and β‑conglycinin subunits. In maturity group III, genotypes KO537, KO538 and KO539 were not significantly different in yield from
the Morava control, but their protein content was 40–50 g kg-1 higher. Increase in protein content in the
KO537 and KO538 genotypes were due to enhanced β‑conglycinin and basic subunits of glycinin. Genotype KO539 accumulates significantly more β‑conglycinin than Morava, with no influence on glycinin content.
Table 4. Estimates of phenotypic correlation coefficients among yield, protein and oil contents and protein subunits of
soybean genotypes maturity group II (above diagonal) and maturity group III (below diagonal) at 5% probability.
Yield Protein Oil Protein/oil α` subunit α subunit β subunit Acidic Basic
Yield ‑0.36 0.4 ‑0.36 ns ns ‑0.36 ns ns
Protein ‑0.48 -0.92 0.95 ns ns ns ns 0.26
Oil 0.51 -0.97 -0.99 ns ns ‑0.28 -0.27 ‑0.28
Protein/oil -0.47 0.98 -0.99 ns ns ns ns ns
α` subunit ns ns ns ns 0.86 0.63 0.75 0.64
α subunit ‑0.32 ns ns ns 0.77 0.73 0.80 0.74
β subunit ‑0.64 0.31 ‑0.33 0.26 0.43 0.72 0.62 0.60
Acidic ns ns ns ns ns ns ns 0.79
Basic ‑0.46 0.34 ‑0.39 0.35 0.41 0.50 0.71 ns
Conclusions
1. High-protein cultivars generally accumulate
higher amounts of glycinin and β‑conglycinin.
2. Accumulation of a significantly higher quantity of glycinin subunits, with no significant influence on β‑conglycinin, in genotypes KO5314 and KO5317, may be beneficial in selection for cultivars with
desirable amino acid composition.
3. Accumulation of higher amounts of subunits of β‑conglycinin, in KO5425, KO5319, KO539 and KO536, can be used in soybean breeding for the food industry, where greater extractability of protein is
needed.
4. Genotypes KO5426, KO5424, KO5423, KO5422, KO5316, KO537, KO538 and KO539, which have a
similar yield to the control for their respective maturity group, can be used in the production of high yielding varieties with enhanced protein content.
5. Protein subunit content is independent of yield, oil and protein content, making it possible to carry out
soybean breeding for specific protein composition with
desirable agronomic characteristics.
Acknowledgements
To the Serbian Ministry of Science and Technological Development, for support; to MSc. Bojana Stanic for densitometric analysis; and to Dr.
Nevena Nagl for critical review of the manuscript.
References
BRADFORD, M.M. A rapid and sensitive method for the quantitation of microgram quantities of protein utilizing the principle of protein-dye binding. Analytical Biochemistry, v.72, p.248‑254, 1976.
BRUMM, T.J.; HURBURGH JUNIOR, C.R. Quality of the 2002 soybean crop from the United States. In: ANNUAL REPORT of the AMERICAN SOYBEAN ASSOCIATION, 2002, St. Louis. Proceedings. St. Louis: American Soybean Association, 2002. p.1-14.
BURTON, J.W. Quantitative genetics: results relevant to soybean breeding. In: WILCOX, J.R. (Ed.). Soybeans: improvement, production and uses. Madison: American Society of Agronomy, 1987. p.211‑247.
COBER, E.R.; VOLDENG, H.D. Developing high‑protein, high-yield soybean populations and lines. Crop Science, v.40, p.39‑42, 2000.
Figure 2. Loading plots of the two first dimensions of principal factor analysis of yield, protein and oil content and ratio and
FEHR, W.R.; HOECK, J.A.; JOHNSON, S.L.; MURPHY, P.; NOTT, J.D.; PADILLA, G.; WELKE, G. Genotype and environment influence on protein components of soybean. Crop Science, v.43, p.511‑514, 2003.
HELMS, T.C.; ORF, J.H. Protein, oil, and yield of soybean lines selected for increased protein. Crop Science, v.38, p.707‑711, 1998.
KRISHNAN, H.B. Biochemistry and molecular biology of soybean seed storage proteins. Journal of New Seeds, v.2, p.1-25, 2001. KRISHNAN, H.B.; SAVITHIRY, S.N.; AHMED, A.M.; RANDALL, L.N. Identification of Glycinin and β‑conglycinin subunits that contribute to the increased protein content of high-protein soybean lines. Journal of Agricultural and Food Chemistry, v.55, p.1839‑1845, 2007.
LAEMMLI, U.K. Cleavage of structural proteins during assembly of head of bacteriophage T4. Nature, v.227, p.680‑685, 1970. MORI, T.; UTSUMI, S.; INABA, H.; KITAMURA, K.; HARADA, K. Differences in subunit composition of glycinin among soybean cultivars. Journal of Agricultural and Food Chemistry, v.29, p.20‑23, 1981.
PESIC, M.B.; VUCELIC‑RADOVIC, B.V.; BARAC, M.B.; STANOJEVIC, S.P. The influence of genotypic variation in protein composition of emulsifying properties of soy proteins. Journal of the American Oil Chemists Society, v.82, p.667‑672, 2005.
POYSA, V.; WOODROW, L.; YU, K. Effect of soy protein subunit composition on tofu quality. Food Research International, v.39, p.309‑317, 2006.
RASBAND, W.S. ImageJ. Available at: <http://rsb.info.nih.gov/ ij/>. Accessed on: 5 Aug. 2010.
STATSOFT. Statistica: data analysis software system. Version 8. Available at: <http://www.statsoft.com/ >. Accessed on: 5 Aug. 2010. TASKI‑AJDUKOVIC, K.; DJORDJEVIC, V.; VIDIC, M.; VUJAKOVIC, M.; MILOŠEVIĆ, M.; MILADINOVIC, J. The main seed storage proteins among high-protein genotypes. Genetika, v.40, p.9‑16, 2008.
THANH, V.H.; SHIBASAKI, K. Major proteins of soybean seeds. Subunit structure of β‑conglycinin. Journal of Agricultural and Food Chemistry, v.26, p.692‑695, 1978.
WILCOX, J.R.Sixty years of improvement in publicly developed elite soybean lines. CropScience, v.41, p.1711‑1716, 2001. YAKLICH, R.W. β‑Conglycinin and glycinin in high‑protein soybean seeds. Journal of Agricultural and Food Chemistry, v.49, p.729‑735, 2001.
ZARKADAS, C.G.; GAGNON, C.; GLEDDIE, S.; KHANIZADEH, S.; COBER, E.R.; GUILLEMETTE, R.J.D. Assessment of the protein quality of fourteen soybean [Glycine max
(L.) Merr.] cultivars using amino acid analysis and two-dimensional electrophoresis. Food Research International, v.40, p.129‑146, 2007.