Larissa Rocha dos Santos(1), Marcela de Souza Zangirolami(1), Núbia Oliveira Silva(1), Patrícia Valderrama(1) and Paulo Henrique Março(1)
(1)Universidade Tecnológica Federal do Paraná, Via Rosalina Maria dos Santos, no 1.233, Caixa Postal 271, CEP 87301-899 Campo Mourão, PR, Brazil. E-mail: [email protected], [email protected], [email protected], [email protected], [email protected]
Abstract – The objective of this work was to evaluate multivariate calibration models to predict total lipids, crude protein, and moisture content in grinded soybean grains using near-infrared spectroscopy and partial least squares (PLS). Three hundred samples of grinded soybean, evaluated in duplicate, were used for reference and spectral measurements. The PLS models for total lipids, crude protein, and moisture were validated by figures of merit for accuracy and precision, respectively, of 0.75 and 0.67 for total lipids, 0.51 and 0.46 for crude protein, and 0.97 and 0.99 for moisture. The PLS models developed for total lipids, crude protein, and moisture can be used as an alternative methodology for the determination of physicochemical parameters, and, therefore, they can be applied inquality control in soybean processing industries.
Index terms: Glycine max, chemometric methods, crude protein, multivariate calibration, partial least squares, total lipids.
Avaliação rápida não invasiva de parâmetros de qualidade em soja triturada
com uso de espectroscopia de infravermelho próximo
Resumo – O objetivo deste trabalho foi avaliar modelos de calibração multivariada para previsão de teores de lipídios totais, proteína bruta e umidade em grãos de soja triturados, com uso da espectroscopia de infravermelho próximo e do método de mínimos quadrados parciais (PLS). Foram utilizadas 300 amostras de grãos de soja trituradas, avaliadas em duplicata, quanto a medidas de referência e espectrais. Os modelos PLS para lipídios totais, proteína bruta e umidade foram validados por meio das figuras de mérito para exatidão e precisão, respectivamente, de 0,75 e 0,67 para lipídios totais, 0,51 e 0,46 para proteína bruta, e 0,97 e 0,99 para umidade. Os modelos PLS desenvolvidos para lipídios totais, proteína bruta e umidade podem ser utilizados como metodologia alternativa para determinação de parâmetros físico-químicos e, portanto, podem ser aplicados no controle de qualidade em indústrias processadoras de soja.
Termos para indexação: Glycine max, métodos quimiométricos, proteína bruta, calibração multivariada, mínimos quadrados parciais, lipídios totais.
Introduction
Soybean [Glycine max (L.) Merrill] plays an important role in the Brazilian and worldwide markets (Cavalcante et al., 2011) due to its versatility as human and animal food, as well as to its economic value (Hirakuri & Lazzarotto, 2014).
Considering Brazil is among the largest soybean producers in the world, this legume is an important Brazilian commodity, responsible for more than 56% of the cultivated area. For the 2016/2017 crop, a record production of 107.6 million tons of soybean is estimated. The total domestic consumption should
reach 47.7 million tons, and approximately 59.9 million tons should be exported; also, China is one of the main importers of Brazilian soybean (Acompanhamento…, 2017).
In this way, the commercialization of soybean derivatives demands strict control of grains and marketing standards. Nonetheless, traditional analytical procedures used in quality control are time consuming, expensive, destructive to the samples and generate chemical residues. Thus, the development of methodologies that improve the analytical aspects, as the speed of responses and non-destructivity, are required (Ma et al., 2017).
In search of fast routine methods for quantification of various products in food samples, optical methods have been increasingly used. Among them, spectroscopy in near-infrared region (NIR) can be highlighted by its low operational cost, destructivity and non-invasive character, besides the fact that it does not generate residues (Pasquini, 2003; Bevilacqua et al., 2013).
There are reports of studies for direct measurements of protein, carbohydrate, lipids, moisture (Guo & Baianu, 2011), dry weight and starch (Huang et al., 2008) of various grains through near-infrared spectroscopy. Montes et al. (2006) measured the dry matter content in corn with near-infrared spectroscopy coupled directly to the harvesting machine. Long et al. (2008) reported an approach to inspect wheat grain protein online with the use of NIR analysis. Heman & Hsieh (2016) measured the moisture content of bark rice by visible and near-infrared spectroscopy. Ferreira et al. (2014) investigated the soybean proximal composition by NIR associated with multivariate calibration methods. These examples reinforce the use of near-infrared as an analytical technique increasingly known in food industry (Porep et al., 2015). However, such studies were not validated, which compromises the functionality of the studies cited above.
Infrared spectroscopy associated with chemometric methods can be indicated as a fast and reliable method to be used in food quality control (Restaino et al., 2011; Ma et al., 2017). This strategy has been applied to a wide variety of studies involving grain analysis, mainly in agricultural sector, due to the relative ease of implementation of this low cost technology in an industrial environment, quality control laboratories or to the inline production (Haughey et al., 2013).
The objective of this work was to evaluate multivariate calibration models to predict total lipids, crude protein, and moisture content in grinded soybean
grains using near-infrared spectroscopy and partial least squares (PLS).
Materials and Methods
The work was developed at the laboratory of food analysis of the Universidade Tecnológica Federal do Paraná, and at the physical-chemical laboratory of quality control of Coamo Agroindustrial Cooperativa, both in the state of Paraná, Brazil. Soybean samples were provided by Coamo, totaling 300 samples from several different municipalities distributed in the northwestern region of Paraná, which were evaluated in duplicate.
For the analyses, 250 g of sample were dried in a forced air circulation oven at 130°C during 1 hour and then taken to the desiccator, remaining there for about 12 hours (AOCS, 2009). Then the dried samples were ground in a MA-090CFT rotor mill (Marconi Equipamentos para Laboratórios, Piracicaba, SP, Brazil), with 0.85 mesh. A portion of the ground soybean samples was exposed to analysis by NIR and other portion was set to be analyzed regarding its total lipid, crude protein and moisture content by methods recommended by the American Oil Chemists’ Society (AOCS, 2009), in the soybean processing industry itself, for further production of oil and bran.
Spectra were measured from previously ground soybean samples with the MicroNIR 1,700 near-infrared ultracompact equipment (Viavi Solutions Inc., Milpitas, CA, USA) at room temperature using diffusion reference, being each sample evaluated in duplicate. This equipment offers online scanning for the region from 910 to 1,676 nm, with a constant range of 6.2 nm. The blank measurement was completed using a Spectralon NIR (Labsphere, Inc. North Sutton, NH, USA) reflection pattern with a diffuse reflection coefficient of 99%, and dark calibration (non-reflective) reference was taken with radiation source of the equipment switched off.
For the models’ construction, two thirds of the
samples were selected to the calibration set and one third for validation. Smoothing was done using the Savitzky-Golay algorithm (13 interval window, 1st degree polynomial and 1st derivative) (Savitsky & Golay, 1964). The models were built using cross-validation (internal cross-validation) through continuous blocks of 10 samples. In this kind of internal validation, 10 samples are left out of the model construction process and then these samples are predicted by the constructed model. This process is repeated until all samples have been left out and predicted. The outliers were identified and removed when necessary by analyzing the plots of Qresidual versus leverage (Martens
& Naes, 1992). All models were mean-centered using 12 latent variables (VL), corresponding to more than 98% of the data variance (spectral and reference concentrations). The number of VL was determined through the root mean square error of cross-validation (RMSECV) for the calibration samples, taking into account the percentage of variance explained in vector y.
The validation of the multivariate calibration models was performed through the following figures of merit: accuracy, linearity, fit, inverse of the analytical sensitivity, and detection and quantification limits (Villar et al., 2011; ASTM, 2012; Botelho et al., 2015; Westad & Marini, 2015). The residual prediction deviation (RPD) was evaluated according to Botelho et al. (2013), and the results are described in detail below.
Results and Discussion
The analysis of total lipids, crude protein, and moisture content has displayed a wide variation when they were evaluated by standard methods, as shown in Table 1. The total lipid content ranged from 16.04 to 26.33%. The crude protein content varied from 33.09 to 40.11%, while the percentage of moisture was between 1.17 and 9.76%. According to Greggio & Bonini (2014), this variation can be considered acceptable since the composition is affected by the origin of the raw material, and factors such as climate, soil profile, water deficit, harvest, transport, and storage affect the chemical composition of the grain.
Other studies that analyzed soybean grain samples from the state of Paraná also found similar variations for the physical-chemical parameters analyzed in this
study, where the total lipid content showed variations of 18.16-23.86%, crude protein varied from 32.91 to 39.41%, and the moisture ranged from 6.70 to 8.50% (Ferreira et al., 2014; Gonçalves et al., 2014).
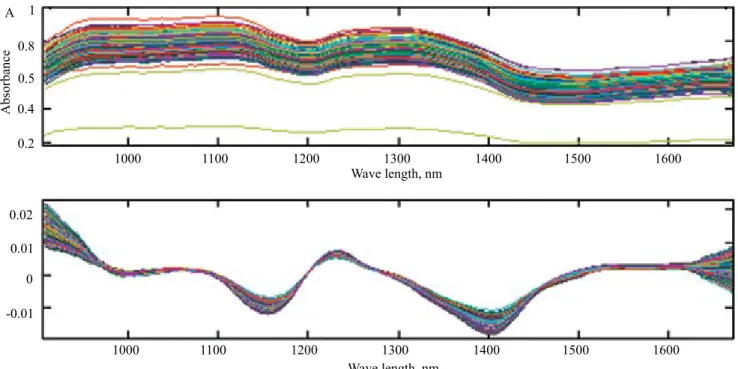
Spectra of the ground soybean samples are shown in Figure 1 (A). It was observed that the measured spectral region showed broad and intense vibration bands, usually related to the vibration of water molecules. Such vibrations lead to significant overlaps, most of them due to the absorption bands of proteins, making it difficult to assign specific bands to its constituents (Pasquini, 2003; Cen & He, 2007). However, through the application of derivatives, the more informative regions can be more evidenced, helping to interpret and correlate the vibrational bands, although the small variation of the evaluated contents between the samples can cause only slight alterations in the spectrum (Burns, 2007). Thus, Figure 1 (B) shows the first derivative of the spectra made by Savitzky-Golay algorithm. It was observed that the regions between 980–1,020; 1,210–1,220; and 1,400 nm appear prominent. These regions brings information regarding primary and secondary overtones of O-H and N-H vibrations, primary overtones of C-H combination bands, secondary and tertiary C-H overtones, C-H from aromatic compounds, and N-H stretch vibrations. In addition, this region is strongly affected by particle size variations (Westad et al., 2008).
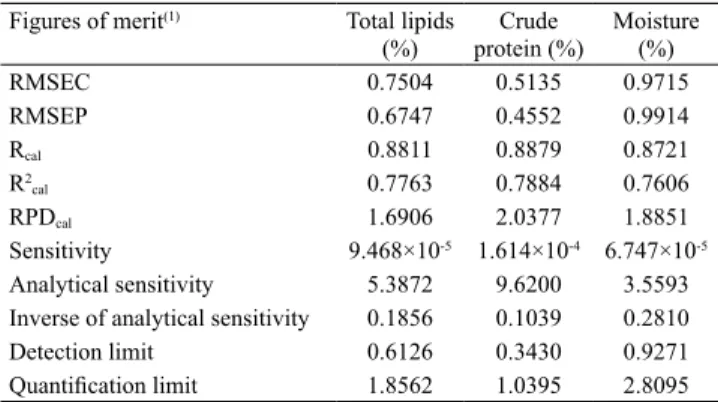
The models’ performance was verified by the analysis of the figures of merit, calculated for each
Table 1. Figures of merit obtained to the PLS model for the physical-chemical parameters of ground soybean (Glycine max).
Figures of merit(1) Total lipids
(%)
Crude protein (%)
Moisture (%)
RMSEC 0.7504 0.5135 0.9715
RMSEP 0.6747 0.4552 0.9914
Rcal 0.8811 0.8879 0.8721
R2
cal 0.7763 0.7884 0.7606
RPDcal 1.6906 2.0377 1.8851
Sensitivity 9.468×10⁻⁵ 1.614×10⁻⁴ 6.747×10⁻⁵
Analytical sensitivity 5.3872 9.6200 3.5593
Inverse of analytical sensitivity 0.1856 0.1039 0.2810
Detection limit 0.6126 0.3430 0.9271
Quantification limit 1.8562 1.0395 2.8095
(1)RMSEC, root mean square error of calibration; RMSEP, root mean
square error of prediction; Rcal, correlation coefficient to calibration; R2
cal, determination coefficient for calibration; and RPDcal, residual prediction
model, as presented in Table 1. The fit was evaluated through the root mean square error of calibration (RMSEC) and prediction (RMSEP), which are considered indicators of accuracy. The RMSEC and RMSEP values are global parameters that incorporate both systematic and random errors from the reference method. The relationship between RMSEC and RMSEP should be as close as possible (to each other) to suggest that the values estimated by the multivariate models showed good agreement with the reference methods, indicating that the number of latent variables chosen was adequate for the model, allowing to check about model overfitting. In this study, for the total lipid content parameter, a RMSEC of 0.7504 and a RMSEP of 0.6747 were obtained, while for crude protein, the RMSEC and RMSEP were 0.5135 and 0.4552, respectively. The moisture content showed values of 0.8715 for RMSEC and 0.9914 for RMSEP (Valderrama et al., 2007). In the case of this study, since the relationship between RMSEC and RMSEP was always very close, it can be considered that all models obtained were satisfactory, which means that the appropriate number of VLs was used, allowing the construction of models with satisfactory accuracy without overfitting.
Another indicator of accuracy is the regression between reference values and the values estimated by the model, which is the model fit (correlation coefficient - R), which are displayed in Table 1. The correlation coefficient (Rcal) for total lipids, crude
protein and moisture were 0.8811, 0.8787 and 0.8721, respectively. These results can be considered adequate since the reference methods showed a wide variation, and it is known that the correlation coefficient is directly related to the errors embedded in the reference methods. Therefore, if the standard method shows high levels of analytical errors, they will be present in the multivariate calibration models, directly affecting the correlation. The fit, that is, the correlation between the values found from the reference method and those predicted by the model are presented in Figure 2 for crude protein (A), for total lipid content (B), and for moisture (C).
The coefficients of determination for calibration were 0.7763 for total lipid content, 0.7884 for crude protein, and 0.7606 for moisture (Table 1). Although these appear to be low values, similar results have been previosly reported in the literature when the reference method is subject to high variations (Valderrama et al., 2007; Ferreira et al., 2014). The values obtained in the present study are consistent with those found by Ferreira
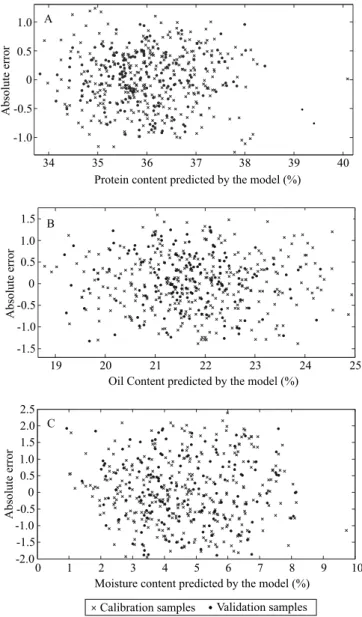
Linearity of the suggested models was evaluated by observing the distribution of the residues. For this parameter, it is considered that the data evaluated follow a linear model if the residuals have random dispersion. Thus, it can be stated that the PLS model was ideal for all evaluated cases, as can be observed in Figure 3 for crude protein (A), for total lipid content (B), and moisture (C).
The RPD value of the calibration model was 1.6906 for total lipid content, 2.0377 for crude protein and 1.8851 for moisture (Table 1). The predictive capacity of the models was considered satisfactory according to the literature since good predictive quality calibration models are those that have values for RPD above 2.4, and the ones classified as satisfactory are those with values between 2.4 and 1.5 (Botelho et al., 2013).
Sensitivity is defined as the fraction of signal responsible for adding one unit of concentration to the property of interest. In this study, the models provided a value of 9.468x10⁻⁵ g per 100 g for total lipid content,
1.614x10⁻⁴ g per 100 g for crude protein and 6.747x10⁻⁵
g per 100 g for moisture (Table 1). The analytical sensitivity was 5.3872, 9.6200, and 3.5593, for total lipid, protein and moisture content, respectively. This parameter shows the sensitivity of the method in terms of the unit of concentration that is used and is defined as the ratio between the sensitivity and the standard deviation of the reference signal (Valderrama et al., 2009). For this study, as the variation of the contents obtained by the reference method of each parameter was significantly high, it is considered that the results were satisfactory.
The inverse of the analytical sensitivity (analytical sensitivity-1) allows to establish the smallest
concentration difference between samples, which can be distinguished by the method, considering the instrumental random error as the only source of errors. Thus, for the proposed models, it was possible to distinguish samples with a difference in content of 0.1856 g per 100 g for total lipids, 0.1039 g per 100 g for crude protein and 0.2810 g per 100 g for moisture (Table 1).
The detection limit is the lowest concentration of the substance of interest that can be detected, but not necessarily quantified. Therefore, the minimum concentration that can be reliably detected by the model using infrared was 0.6126 g per 100 g for total
Figure 2. Model fit for: A, crude protein; B, total lipid content; and C, moisture content.
18 19 20 21 22 23 24 25 26 18
19 20 21 22 23 24 25 26
Oil content found by the model (%) Oil content predicted by the reference method (%)
0 2 4 6 8 10 12
0 2 4 6 8 10 12
Moisture content found by the reference method (%)
Moisture content predicted by
the model (%)
33 34 35 36 37 38 39 40 41
33 34 35 36 37 38 39 40 41
Protein content found by the reference method (%)
Protein content predicted by
the model (%)
A
B
C
Calibration samples Validation samples
with the reference methods, since the models showed a satisfactory correlation, and produced errors of the same order of those provided by the reference methods.
Conclusions
1. In general, the models constructed from NIR spectroscopy of soybean (Glycine max) samples can be used to carry out non-invasive rapid evaluations of quality parameters in ground soybean.
2. The use of near-infrared spectroscopy can be applied in conjunction with the partial least squares methodology for the construction of mathematical models to predict quality parameters in ground soybean, being an alternative for the quality control of soybean grains in food industries.
Acknowledgments
To Embrapa Solos, for the software; to Conselho Nacional de Desenvolvimento Científico e Tecnológico (CNPq, process No. 485640/2013-9) and to Coordenação de Aperfeiçoamento de Pessoal de Nível Superior (Capes), for financial support.
References
ACOMPANHAMENTO DA SAFRA BRASILEIRA [DE] GRÃOS: safra 2016/17: sexto levantamento, v.4, n.6, mar. 2017, 176p.
AOCS. American Oil Chemists’ Society. Official Methods and
Recommended Practices of the AOCS. 6th ed. Champaing:
AOCS, 2009.
ASTM. American Society for Testing and Materials. ASTM E1655-05 - Standart Practices for Infrared Multivariate
Quantitative Analysis. West Conshohocken: ASTM
International, 2012. Annual Book of ASTM Standarts. DOI: 10.1520/E1655-05R12.
BEVILACQUA, M.; BUCCI, R.; MATERAZZI, S.; MARINI, F. Application of near infrared (NIR) spectroscopy coupled to chemometrics for dried egg-pasta characterization and egg content quantification. Food Chemistry, v.140, p.726-734, 2013. DOI: 10.1016/j.foodchem.2012.11.018.
BOTELHO, B.G.; MENDES, B.A.P.; SENA, M.M. Implementação de um método robusto para o controle fiscal de umidade em queijo minas artesanal. Abordagem metrológica multivariada.
Quimica Nova, v.36, p.1416-1422, 2013. DOI:
10.1590/S0100-40422013000900023.
BOTELHO, B.G.; REIS, N.; OLIVEIRA, L.S.; SENA, M.M. Development and analytical validation of a screening method for simultaneous detection of five adulterants in raw milk using mid-infrared spectroscopy and PLS-DA. Food chemistry, v.181, p.31-37, 2015. DOI: 10.1016/j.foodchem.2015.02.077.
Figure 3. Residues of the PLS model for determination of: A, crude protein content; B, total lipid content; and C, moisture content.
19 20 21 22 23 24 25
-1.5 -1.0 -0.5 0 0.5 1.0 1.5
Oil Content predicted by the model (%)
Absolute error
0 1 2 3 4 5 6 7 8 9 10
-2.0 -1.5 -1.0 -0.5 0 0.5 1.0 1.5 2.0 2.5
Moisture content predicted by the model (%)
Absolute error
34 35 36 37 38 39 40
-1.0 -0.5 0 0.5 1.0
Protein content predicted by the model (%)
Absolute error
A
B
C
Calibration samples Validation samples
lipid content, 0.3430 g per 100 g for crude protein, and 0.9271 g per 100 g for moisture, indicating that samples below this level can be wrongly measured. The limit of quantification represents the lowest concentration of the substance of interest that can be measured. In this case, the results show that samples with concentrations lower than 1.8562 g per 100 g for total lipid content, 1.0395 g per 100 g for crude protein, and 2.8095 g per 100 g for moisture cannot be differentiated (Table 1).
BURNS, D.A.; CIURCZAK, E.W. Handbook of Near-Infrared
Analysis. 3rd ed. Boca Raton: CRC Press, 2007.
CAVALCANTE, A.K.; SOUSA, L.B. de; HAMAWAKI, O.T. Determinação e avaliação do teor de óleo em sementes de soja pelos métodos de ressonância magnética nuclear e soxhlet.
Bioscience Journal, v.27, p.8-15, 2011.
CEN, H.; HE, Y. Theory and application of near infrared reflectance spectroscopy in determination of food quality. Trends
in Food Science and Technology, v.18, p.72-83, 2007. DOI:
10.1016/j.tifs.2006.09.003.
FERREIRA, D.S. GALÃO, O.F.; PALLONE, J.A.L.; POPPI, R.J. Comparison and application of near-infrared (NIR) and mid-infrared (MIR) spectroscopy for determination of quality parameters in soybean samples. Food Control, v.35, p.227-232, 2014. DOI: 10.1016/j.foodcont.2013.07.010.
GELADI, P.; KOWALSKI, B.R. Partial least-squares regression: a tutorial. Analytica Chimica Acta, v.185, p.1-17, 1986. DOI: 10.1016/0003-2670(86)80028-9.
GONÇALVES, L.C.; ANDRADE, A.P.C. de; RIBEIRO, G.P.; SEIBEL, N.F. Composição química e propriedades tecnológicas de duas cultivares de soja. BBR - Biochemistry and Biotechnology
Reports, v.3, p.33-40, 2014.
GREGGIO, E.A.; BONINI, E.A. Qualidade do grão de soja relacionada com o teor de acidez do óleo. Revista em
Agronegócios e Meio Ambiente, v.7, p.645-658, 2014.
GUO, J.; BAIANU, I.C. NIR calibrations for soybean seeds and soy food composition analysis: total carbohydrates, oil , proteins and water contents. Nature Precedings, 2011.
HAUGHEY, S.A.; GRAHAM, S.F.; CANCOUËT, E.; ELLIOTT, C.T. The application of Near-Infrared Reflectance Spectroscopy (NIRS) to detect melamine adulteration of soya bean meal.
Food Chemistry, v.136, p.1557-1561, 2013. DOI: 10.1016/j.
foodchem.2012.01.068.
HEMAN, A.; HSIEH, C.-L. Measurement of moisture content for rough rice by visible and near-infrared (NIR) spectroscopy.
Engineering in Agriculture, Environment and Food, v.9,
p.280-290, 2016.
HIRAKURI, M.H.; LAZZAROTTO, J.J. O agronegócio da soja
nos contextos mundial e brasileiro. Londrina: Embrapa Soja,
2014. 37p. (Embrapa Soja.Documentos, 349).
HUANG, H.; YU, H.; XU, H.; YING, Y. Near infrared spectroscopy for on/in-line monitoring of quality in foods and beverages: a review. Journal of Food Engineering, v.87, p.303-313, 2008. DOI: 10.1016/j.jfoodeng.2007.12.022.
LONG, D.S.; ENGEL, R.E.; SIEMENS, M.C. Measuring grain protein concentration with in-line near infrared reflectance spectroscopy. Agronomy Journal, v.100, p.247-252, 2008. DOI: 10.2134/agronj2007.0052.
MA, H.-L.; WANG, J.-W.; CHEN, Y.-J.; CHENG, J.-L.; LAI, Z.-T. Rapid authentication of starch adulterations in ultrafine granular powder of Shanyao by near-infrared spectroscopy coupled with chemometric methods. Food Chemistry, v.215, p.108-115, 2017. DOI: 10.1016/j.foodchem.2016.07.156.
MACIEL, V.G.; ZORTEA, R.B.; GRILLO, I.B.; UGAYA, C.M.L.; EINLOFT, S.; SEFERIN, M. Greenhouse gases assessment of soybean cultivation steps in southern Brazil. Journal of
Cleaner Production, v.131, p.747-753, 2016. DOI: 10.1016/j.
jclepro.2016.04.100.
MARTENS, H.; NAES, T. Multivariate Calibration. Chichester: J. Wiley, 1992.
MONTES, J.M.; UTZ, H.F.; SCHIPPRACK, W.; KUSTERER, B.; MUMINOVIC, J.; PAUL, C.; MELCHINGER, A.E. Near-infrared spectroscopy on combine harvesters to measure maize grain dry matter content and quality parameters. Plant Breeding, v.125, p.591-595, 2006. DOI: 10.1111/j.1439-0523.2006.01298.x.
PASQUINI, C. Near infrared spectroscopy: fundamentals, practical aspects and analytical applications. Journal of the
Brazilian Chemical Society, v.14, p.198-219, 2003. DOI: 10.1590/
S0103-50532003000200006.
POREP, J.U.; KAMMERER, D.R.; CARLE, R. On-line application of near infrared (NIR) spectroscopy in food production. Trends
in Food Science and Technology, v.46, p.211-230, 2015. DOI:
10.1016/j.tifs.2015.10.002.
RESTAINO, E.; FASSIO, A.; COZZOLINO, D. Discrimination of meat patés according to the animal species by means of near infrared spectroscopy and chemometrics. CyTA - Journal of Food, v.9, p.210-213, 2011. DOI: 10.1080/19476337.2010.512396. SAVITSKY, A.; GOLAY, M.J.E. Smoothing and differentiation of data by simplified least squares procedures. Analytical
Chemistry, v.36, p.1627-1639, 1964. DOI: 10.1021/ac60214a047.
VALDERRAMA, P.; BRAGA, J.W.B.; POPPI, R.J. Estado da arte de figuras de mérito em calibração multivariada.
Química Nova, v.32, p.1278-1287, 2009. DOI:
10.1590/S0100-40422009000500034.
VALDERRAMA, P.; BRAGA, J.W.B.; POPPI, R.J. Validation of multivariate calibration models in the determination of sugar cane quality parameters by near infrared spectroscopy. Journal
of the Brazilian Chemical Society, v.18, p.259-266, 2007. DOI:
10.1590/S0103-50532007000200003.
VILLAR, A.; GORRITXATEGI, E.; OTADUY, D.; CIRIA, J.I.; FERNANDEZ, L.A. Chemometric methods applied to the calibration of a Vis-NIR sensor for gas engine’s condition monitoring. Analytica chimica acta, v.705, p.174-181, 2011. DOI: 10.1016/j.aca.2011.04.048.
WESTAD, F.; MARINI, F. Validation of chemometric models - a tutorial. Analytica Chimica Acta, v.893, p.14-24, 2015. DOI: 10.1016/j.aca.2015.06.056.
WESTAD, F.; SCHMIDT, A.; KERMIT, M. Incorporating chemical band-assignment in near infrared spectroscopy regression models. Journal of Near Infrared Spectroscopy, v.16, p.265-273, 2008. DOI: 10.1255/jnirs.786.
WOLD, H. Model construction and evaluation when theoretical knowledge is scarce: Theory and Application of Partial Least Squares. In: KMENTA, J.; RAMSEY, J.B. (Ed.). Evaluation of
Econometric Models. New York: Academic Press, 1980. p.4774.
WOLD, H. Nonlinear Iterative Partial Least Squares (NIPALS) Modelling: some current developments. In: KRISHNAIAH, P.R. (Ed.). Multivariate Analysis–III: Proceedings of the Third International Symposium on Multivariate Analysis Held at Wright State University, Dayton, Ohio, June 19-24, 1972. New
York: Academic Press, 1973. p.383-407. DOI: 10.1016/B978-0-12-426653-7.50032-6.
WOLD, S.; SJÖSTRÖM, M.; ERIKSSON, L. PLS-regression: a basic tool of chemometrics. Chemometrics and Intelligent
Laboratory Systems, v.58, p.109-130, 2001. DOI:
10.1016/S0169-7439(01)00155-1.