Revista Brasileira de
Engenharia Agrícola e Ambiental
Campina Grande, PB, UAEA/UFCG – http://www.agriambi.com.br
v.20, n.11, p.996-1001, 2016
Phosphorus availability as a function of its time
of contact with different soils
Hemmannuella C. Santos
1, Fábio H. T. de Oliveira
2, Adailson P. de Souza
3,
Ignácio H. Salcedo
4& Valério D. M. Silva
5DOI: http://dx.doi.org/10.1590/1807-1929/agriambi.v20n11p996-1001
A B S T R A C T
Phosphorus (P) availability is related to soil sorption capacity and is relevant to planning P fertilization and evaluating its residual effect. The aim of this work was to evaluate the P availability to maize plants after different incubation times of six soils from Paraíba state. For this, four doses of P (0, 100, 200 and 300 mg dm-3) were applied in samples of six soils
for 0, 30, 60, 90, 180, 240 and 360 days. After the incubation time, the soil samples received fertilization with macro and micronutrients and were cultivated with maize for 35 days, when they were harvested and analyzed to verify dry matter and P content in soil. The increase in the time of contact of P with the soil decreased P availability to plants; however, the formation of non-labile P was negligible in most soils. After 360 days of incubation, between 26 and 71% of P applied at the highest dose was recovered.
Disponibilidade de fósforo em função
do seu tempo de contato com diferentes solos
R E S U M O
A disponibilidade de fósforo (P) no solo está relacionada com a sua capacidade de sorção e é um tema relevante para o planejamento da adubação fosfatada e para a avaliação do seu efeito residual. Propôs-se, com este trabalho, avaliar a disponibilidade de P para plantas de milho após diferentes períodos de incubação de doses de P em seis solos do Estado da Paraíba. Para isto foram aplicadas quatro doses de P (0, 100, 200 e 300 mg dm-3) em
amostras de seis solos incubados por 0, 30, 60, 90, 180, 240 e 360 dias; após o período de incubação os solos receberam uma adubação básica com macro e micronutrientes e foram cultivados com plantas de milho por 35 dias quando foram colhidas e analisadas quanto à matéria seca e ao teor de P no solo. O aumento do tempo de contato do P com o solo diminuiu a disponibilidade do elemento para as plantas, porém a formação de P não lábil foi inexpressiva na maioria dos solos estudados; após 360 dias de incubação foi possível recuperar entre 26 e 71% do P aplicado na maior dose.
Key words:
residual effect phosphate tropical soils
Palavras-chave:
efeito residual fosfato solos tropicais
1 Universidade Federal da Paraíba/Centro de Ciências Humanas, Sociais e Agrárias/Departamento de Agricultura. Bananeiras, PB. E-mail: [email protected]
(Corresponding author)
2 Universidade Federal Rural do Semi-Árido/Departamento de Ciências Ambientais e Tecnológicas. Mossoró, RN. E-mail: [email protected]
3 Universidade Federal da Paraíba/Centro de Ciências Agrárias/Departamento de Solos e Engenharia Rural. Areia, PB. E-mail: [email protected]
4 Instituto Nacional do Semiárido. Campina Grande, PB. E-mail: [email protected]
5 Universidade Federal da Paraíba/Centro de Ciências Agrárias/Programa de Pós-Graduação em Agronomia. Areia, PB. E-mail: [email protected]
Introduction
Brazilian soils are, in general, poor in phosphorus (P), due to the processes of P sorption to the soil, which occur through simultaneous chemical reactions of adsorption and precipitation. The magnitude and intensity of this adsorption are higher in soils with clayey texture and rich in iron (Fe) and aluminum (Al) oxides. In regard to precipitation, it occurs with both Fe and Al ions present in the solution of acidic soils, and also with calcium ions in the solution of soils with high pH (Broggi et al., 2010; Vilar et al., 2010; Garcia et al., 2011; Tokura et al., 2011; Souza Júnior et al., 2012; Tomasi et al., 2012; Freitas et al., 2013; Rossi et al., 2013; Sandim et al., 2014).
The study on P availability as a function of the time of contact with the soil provides important information that leads to a different management of the crops regarding the period of fertilizer application, since its residual effect would allow the reduction in production costs (Ramos et al., 2010) if P were supplied along the crop cycles.
However, there are only a few studies that evaluate the effect of time of contact of P with the soil, such as Gonçalves et al. (1989), Campello et al. (1994) and Broggi et al. (2010). In these studies, most soils have high maximum phosphate adsorption capacity (MPAC) and high contents of Fe and Al oxides, characteristics that are different from those of soils of the Northeast region. Therefore, it raises the hypothesis that, in Northeast soils, P sorption exists, but the magnitude and irreversibility of this sorption are small (Broggi et al., 2010; Santos et al., 2011; Souza Júnior et al., 2012).
Given the above, this experiment aimed to evaluate the effect of time of contact of the phosphate fertilizer, through
different periods, with samples of six soils from the Paraíba state on the availability of this element to maize plants.
Material and Methods
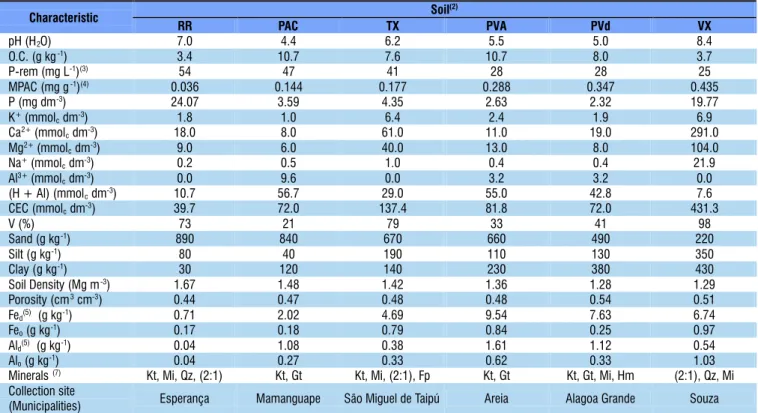
The experiment was carried out in a screened greenhouse at the Center of Agricultural Sciences of the Federal University of Paraíba, using samples of six soils from the Paraíba state, classified according to EMBRAPA (2006) as Regolithic Neosol (RR), Grey Argisol (PAC), Haplic Luvisol (TX), Red-Yellow Argisol (PVA), Dystrophic Red Argisol (PVd) and Haplic Vertisol (VX), which were chemically, physically and mineralogically characterized (Table 1).
Samples of 3 dm3 from the PAC, PVA and PVd soils received a
mixture of CaCO3 and MgCO3 at a molar ratio of 4:1, during the period of 21 days before applying the treatments, in order to increase base saturation to 60%. In the RR, TX and VX soils, there was no need for acidity correction; after the incubation time, the samples were dried and pounded to break up clods, to receive the P doses.
The samples of the six soils were incubated for 0, 30, 60, 90, 180, 240 and 360 days with the doses of P (0, 100, 200 and 300 mg dm-3), in the form of KH
2PO4, with a water volume
corresponding to 50% of the total porosity of each soil. The incubation times began in different times in order to be treated on a same and last day, the different periods of equilibrium achieved between the soil and P.
At the end of the incubation time, the soils were air-dried, pounded to break up clods, passed through a 4-mm-mesh sieve and put back into the pots. Subsamples of 0.2 dm3 of soil from
each pot were removed for the determination of the contents of available P using the Mehlich-1 extractor (EMBRAPA, 1997).
(1)According to methodology described in EMBRAPA (1997); (2)Data presented in Santos et al. (2011), according to EMBRAPA (2006): RR - Regolithic Neosol, PAC - Grey Argisol;
TX - Haplic Luvisol; PVA - Red-Yellow Argisol; PVd - Dystrophic Red Argisol; VX - Haplic Vertisol; (3)Remaining phosphorus (Alvarez V. et al., 2000); (4)MPAC - Maximum capacity
of phosphate adsorption; (5)Fe
d and Ald - Iron and aluminum oxides extracted with dithionite-citrate-bicarbonate; (6)Feo and Alo - Iron and aluminum oxides extracted with ammonium
oxalate; (7)Predominant minerals in the clay fraction: Kt - Kaolinite; Gt - Goethite; Mi - Mica; (2:1) - 2:1 clay mineral; Hm - Hematite; Qz - Quartz; Fp - Feldspars
Characteristic Soil
(2)
RR PAC TX PVA PVd VX
pH (H2O) 7.0 4.4 6.2 5.5 5.0 8.4
O.C. (g kg-1) 3.4 10.7 7.6 10.7 8.0 3.7
P-rem (mg L-1)(3) 54 47 41 28 28 25
MPAC (mg g-1)(4) 0.036 0.144 0.177 0.288 0.347 0.435
P (mg dm-3) 24.07 3.59 4.35 2.63 2.32 19.77
K+(mmol
cdm-3) 1.8 1.0 6.4 2.4 1.9 6.9
Ca2+(mmol
cdm-3) 18.0 8.0 61.0 11.0 19.0 291.0
Mg2+(mmol
cdm-3) 9.0 6.0 40.0 13.0 8.0 104.0
Na+(mmol
cdm-3) 0.2 0.5 1.0 0.4 0.4 21.9
Al3+(mmol
cdm-3) 0.0 9.6 0.0 3.2 3.2 0.0
(H + Al) (mmolcdm-3) 10.7 56.7 29.0 55.0 42.8 7.6
CEC (mmolcdm-3) 39.7 72.0 137.4 81.8 72.0 431.3
V (%) 73 21 79 33 41 98
Sand (g kg-1) 890 840 670 660 490 220
Silt (g kg-1) 80 40 190 110 130 350
Clay (g kg-1) 30 120 140 230 380 430
Soil Density (Mg m-3) 1.67 1.48 1.42 1.36 1.28 1.29
Porosity (cm3cm-3) 0.44 0.47 0.48 0.48 0.54 0.51
Fed(5) (g kg-1) 0.71 2.02 4.69 9.54 7.63 6.74
Feo(g kg-1) 0.17 0.18 0.79 0.84 0.25 0.97
Ald(5) (g kg-1) 0.04 1.08 0.38 1.61 1.12 0.54
Alo(g kg-1) 0.04 0.27 0.33 0.62 0.33 1.03
Minerals(7) Kt, Mi, Qz, (2:1) Kt, Gt Kt, Mi, (2:1), Fp Kt, Gt Kt, Gt, Mi, Hm (2:1), Qz, Mi
Collection site
The experiment was carried out in a randomized block design with 6 soil classes, 7 incubation times and 4 doses, with three replicates; each experimental unit consisted of one polyethylene pot without drain, with 2.8 dm3 of soil and two
maize plants.
Before planting, the soils were fertilized with macro and micronutrients (Farias et al., 2009): 50 mg dm-3 of N
((NH4)2SO4), 80 mg dm-3 of S ((NH
4)2SO4), 0.5 mg dm -3 of B
(H3BO3), 1.5 mg dm-3 of Cu (CuSO
4.5H2O), 4 mg dm
-3 of Mn
(MnCl2.4H2O), 4 mg dm-3 of Zn (ZnSO
4.7H2O), 5 mg dm -3 of
Fe (FeCl3.6H2O, dissolved in EDTA diluted solution) and 0.15 mg dm-3 of Mo ((NH
4)6Mo7O24.4H2O).
In relation to S, part of the dose of 80 mg dm-3 was applied
along with the N in the form of ((NH4)2SO4) at sowing and the rest was applied in the first top-dressing N fertilization using the same fertilizer source. As top-dressing, there were four applications of 50 mg dm-3 of N, of which ammonium sulfate
((NH4)2SO4) was used as N source in the first one and urea (CO(NH2)2) was used in the other three. For K, a KCl dose was applied so as to compensate the K applied at the highest P dose.
During the cultivation period, the moisture of the pots was maintained by the replenishment of the water based on weighings; plant shoots were harvested 35 days after sowing; the collected material was dried at temperature of 65 ºC in a forced-air oven until constant weight and then weighed for the determination of dry matter.
The reduction in the capacity of P recovery by the extractor was calculated according to Gonçalves et al. (1989), through the first derivative of Eq. 1, expressed in Eq. 2:
incubation times was small, a fact also observed by Gonçalves et al. (1989) and Broggi et al. (2010), which evidences the small influence of the time of contact on P recovery in the absence of phosphate fertilization.
When the highest P dose (300 mg dm-3) was applied in the
PVd soil, there was lower recovery of the added P (26%) after 360 days of incubation (Table 2), followed by TX (33%), PVA (36%), VX (39%), PAC (66%) and RR (71%).
In five soils of the Cerrado and using different extractors (Mehlich-1, Mehlich-3, Bray-1 and CaCl2), Gonçalves et al. (1989) managed to recover, on average, only 10% of the highest P dose applied, while in the present study the mean recovery of the six soils was 45% of the highest P dose (Table 2). This difference can be explained by the high values of MPAC in the previously mentioned study, which are on average 3.5 times higher than those in the present study.
The RR soil is characterized by the low adsorption of P, which allowed the extractor to recover 71% of the P applied at the highest dose. PAC and TX soils showed intermediate values of MPAC, clay and remaining P, and the main difference between them is the content of Fed and Feo, higher in TX compared with PAC, which can explain the lower P recovery by the extractor in TX (33%) in relation to PAC (66%), since
( )
bK t
Ct Co
b −
=
(
)( )( )
b b 1b
Co.b K t
Ct
t b
− − −
− −
δ =
δ
where:
Ct - P recovered in the different incubation times, mg dm-3;
C0 - P recovered in the zero incubation time, mg dm-3;
K - rate of transformation of labile P to non-labile P, mg dm-3 d-1;
t - incubation time, days; and, b - constant.
The data were subjected to analysis of variance with subsequent follow-up analysis of the quantitative effects (dose and time) through regression, to evaluate the effect of P doses and incubation times on the content of recovered P.
Results and Discussion
The mean contents of recovered P for the different incubation times are presented in Table 2. In general, there was small and non-systematic variation of the recovered P with the increase in incubation time and, when there was no P application, the variation of recovered P in the different
Table 2. Mean contents of P in the soil (mg dm-3) recovered
by the Mehlich-1 extractor after times of incubation of P applied in six soils from the Paraíba state
Dose (mg dm-3)
Incubation time (days)
0 30 60 90 180 240 360
Regolithic Neosol (RR)
0 37.12 38.51 37.18 38.03 36.87 39.10 38.23 100 120.53 113.84 119.54 108.37 114.75 120.76 129.26 200 142.18 212.20 203.96 167.79 217.37 195.08 162.35 300 202.16 262.96 252.62 285.80 277.59 233.19 213.56 Mean 125.50 156.87 153.32 149.99 161.64 147.03 135.85
Grey Argisol (PAC)
0 7.38 7.31 7.37 7.05 5.94 6.89 6.81
100 57.74 67.94 64.83 79.79 65.40 54.24 66.14 200 154.69 156.59 150.83 128.72 132.77 126.23 137.28 300 198.42 203.17 180.87 192.28 177.03 170.04 199.32 Mean 104.55 108.75 100.97 101.96 95.28 89.35 102.38
Haplic Luvisol (TX)
0 5.75 5.46 5.25 5.11 5.02 4.66 4.92
100 42.63 38.69 57.97 47.25 40.17 47.28 43.48 200 128.55 117.61 138.67 116.08 123.87 128.63 77.63 300 171.61 176.76 190.13 169.88 153.66 156.40 100.53 Mean 87.13 84.63 98.01 84.58 80.68 84.24 56.64
Red-Yellow Argisol (PVA)
0 2.10 2.58 2.56 2.84 2.31 2.45 2.69
100 37.81 32.80 31.46 31.39 23.46 29.26 29.37 200 73.85 77.50 72.91 61.85 63.45 68.37 54.85 300 111.86 117.65 121.71 113.53 116.82 103.74 110.60 Mean 56.41 57.63 57.16 52.40 51.51 50.95 51.28
Dystrophic Red Argisol (PVd)
0 2.06 2.02 2.45 2.04 1.82 1.96 2.51
100 33.39 26.36 27.98 27.66 21.68 21.98 17.70 200 63.53 50.93 63.42 70.80 53.02 76.89 50.18 300 112.38 99.92 98.59 81.69 89.25 97.26 79.02 Mean 52.84 44.81 48.11 45.55 41.44 49.52 37.35
Haplic Vertisol (VX)
0 26.60 26.05 25.46 25.47 23.02 26.23 25.83 100 58.80 46.50 72.86 77.79 63.93 79.75 60.83 200 102.64 118.51 96.12 90.22 112.30 103.74 101.25 300 203.44 197.03 206.86 195.04 158.09 110.76 118.66 Mean 97.87 97.02 100.32 97.13 89.34 80.12 77.20 (1)
Table 3. Kinetic equation coefficients(1) of the effect of time of
equilibrium of different P doses with samples of soils from the Paraíba state on the P recovered by the Mehlich-1 extractor
P doses mg dm-3
Coefcients
Co B K R2
Regolithic Neosol (RR)
100 - - - ns
200 142.18 -10.7427 -0.0277 0.98**
300 202.16 -12.9671 -0.0196 0.99**
Grey Argisol (PAC)
100 57.74 -9.4333 -0.0117 0.98**
200 154.69 0.1105 0.0171 0.99**
300 198.42 0.0775 0.0086 0.99**
Haplic Luvisol (TX)
100 42.63 -1.1430 -0.0070 0.98**
200 128.55 0.0574 0.0166 0.97**
300 171.61 0.0207 0.0198 0.98**
Red-Yellow Argisol (PVA)
100 37.81 0.5451 0.0326 0.99**
200 73.85 0.0641 0.0187 0.99**
300 - - - ns
Dystrophic Red Argisol (PVd)
100 33.39 0.6205 0.0465 0.98**
200 63.53 2.8086 0.0035 0.97**
300 112.38 0.4653 0.0283 0.99**
Haplic Vertisol (VX)
100 58.80 -0.0922 -0.0218 0.98**
200 - - - ns
300 203.44 0.1529 0.0367 0.97**
Fe and Al oxides are considered as the main responsible for the processes of P sorption in the soil (Vilar et al., 2010). On the other hand, the VX soil showed the highest pH, MPAC, clay content and Ca2+ content, and lower content of remaining
P, indicating the high sorption power of these soils, due to the precipitation of P with the Ca of the solution. These characteristics can explain the fact that only 39% of the P applied at the highest dose was recovered by the Mehlich-1 extractor.
This low P recovery by Mehlich-1 disagrees with the literature, which indicates that P recovery can be overestimated due to the dissolution of P bound to Ca2+ (Broggi et al., 2010).
However, since VX is a clayey soil, the extractor wore off, which decreased its extraction power.
The K coefficients of the kinetic equation (Table 3) that refer to the rate of transformation of labile P to non-labile P, showed inconsistent behavior between the soil and the time of contact, similar to the results reported by Gonçalves et al. (1989).
The soils RR (doses 200 and 300 mg dm-3), PAC, TX and
VX (dose 100 mg dm-3) showed negative K values (Table 3);
thus, there was desorption of P. These soils can be separated into two groups: RR and PAC, which are very sandy soils, and TX and VX, which are more clayey soils, but have 2:1 minerals, properties that do not favor the adsorption process, although there might have been saturation of the adsorption sites at the highest doses of P.
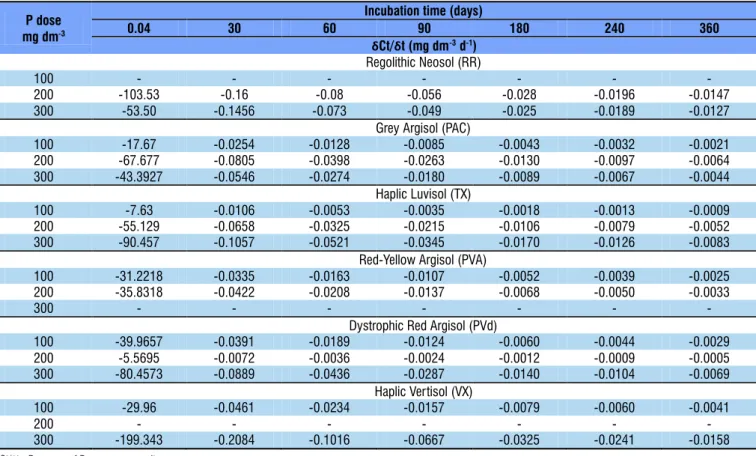
The highest variations in the reduction of extractable P with the incubation time, observed by the variation of δC/δt, occurred in the first 30 days of reaction (Table 4); from this time on, the variations were small, but decreasing. These data demonstrate a rapid initial reaction, which then becomes slow and constant (Santos et al., 2011).
(1) Equation Ct = C 0(K(t)/b)
-b, Ct - P recovered in the different incubation times in mg dm-3;
C0 - P recovered at the zero incubation time in mg dm-3; K - Rate of transformation of labile P to non-labile P; t - Incubation time in days; b - constant. R2 of the nonlinear equation; *, **, ns - significant at 0.05, 0.01 and not significant, respectively
P dose mg dm-3
Incubation time (days)
0.04 30 60 90 180 240 360
δCt/δt (mg dm-3d-1) Regolithic Neosol (RR)
100 - - -
-200 -103.53 -0.16 -0.08 -0.056 -0.028 -0.0196 -0.0147
300 -53.50 -0.1456 -0.073 -0.049 -0.025 -0.0189 -0.0127
Grey Argisol (PAC)
100 -17.67 -0.0254 -0.0128 -0.0085 -0.0043 -0.0032 -0.0021
200 -67.677 -0.0805 -0.0398 -0.0263 -0.0130 -0.0097 -0.0064
300 -43.3927 -0.0546 -0.0274 -0.0180 -0.0089 -0.0067 -0.0044
Haplic Luvisol (TX)
100 -7.63 -0.0106 -0.0053 -0.0035 -0.0018 -0.0013 -0.0009
200 -55.129 -0.0658 -0.0325 -0.0215 -0.0106 -0.0079 -0.0052
300 -90.457 -0.1057 -0.0521 -0.0345 -0.0170 -0.0126 -0.0083
Red-Yellow Argisol (PVA)
100 -31.2218 -0.0335 -0.0163 -0.0107 -0.0052 -0.0039 -0.0025
200 -35.8318 -0.0422 -0.0208 -0.0137 -0.0068 -0.0050 -0.0033
300 - - -
-Dystrophic Red Argisol (PVd)
100 -39.9657 -0.0391 -0.0189 -0.0124 -0.0060 -0.0044 -0.0029
200 -5.5695 -0.0072 -0.0036 -0.0024 -0.0012 -0.0009 -0.0005
300 -80.4573 -0.0889 -0.0436 -0.0287 -0.0140 -0.0104 -0.0069
Haplic Vertisol (VX)
100 -29.96 -0.0461 -0.0234 -0.0157 -0.0079 -0.0060 -0.0041
200 - - -
-300 -199.343 -0.2084 -0.1016 -0.0667 -0.0325 -0.0241 -0.0158
δCt/δt - Decrease of P recovery capacity
Table 4. Effect of time of contact of P with the soil on the capacity of P recovery by the Mehlich-1 extractor
In the VX soil, at 30 days, there was a reduction of 199.34 mg dm-3 d-1 for the highest dose of P, decreasing to 0.2084
the last incubation time (Table 4). These results are similar to those reported by Gonçalves et al. (1989), who claim that the mathematical relationship between the recovery rate of the applied P and the different incubation times characterized an exponential decrease. In spite of that, it was not possible to observe similar tendencies in the study of Broggi et al. (2010).
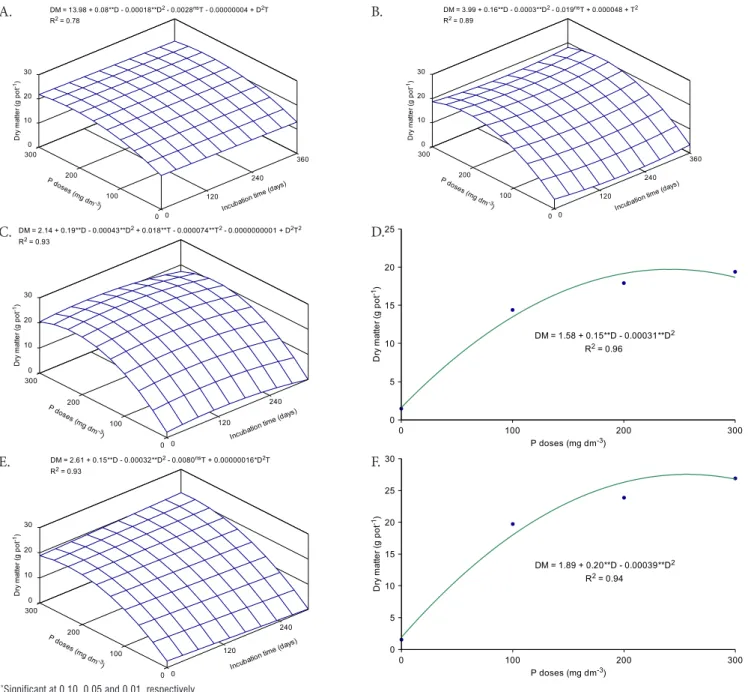
Dry matter production varied from 1.58 to 13.98 g pot-1
in the absence of phosphate fertilization and from 18.68 to 26.79 g pot-1 at the highest P dose (Figure 1). Shoot dry matter
is the determinant character of P use efficiency, regardless of the availability of the nutrient (Pereira et al., 2013). However, according to Novais & Smyth (1999), plants adjust to the use of P in soil with high MPAC, which explains the greater dry matter production in the VX soil, the one with highest MPAC.
The higher dry matter production of maize plants in the absence of phosphate fertilization observed in the RR soil, compared with the other studied soils (Figure 1A), is possibly due to the fact that the soil is sandy (890 g kg-1 of sand)
and shows the highest initial P content, favoring its greater
availability for the absorption by plants. However, at the highest P dose, it is calculated through the regression equation that the dry matter of maize plants cultivated in the RR soil decreased by 10.6% with the increment in the time of contact between P and the soil (Figure 1A).
The dry matter of maize plants cultivated in the soils PAC and TX, at the highest P dose applied, decreased with the increment in the time of contact between P and the soil by 2.47 and 20.9%, respectively; on the other hand, in the PVd soil, there was an increment of approximately 12.2% (Figures 1B, C and E).
In PVA and TX soils, only the effect of doses was observed, and the highest estimated dry matter productions, 19.7 and 27.57 g pot-1, were obtained with the application of doses of
241.9 and 256.4 mg dm-3, respectively (Figure 1D and F).
In general, the studied soils, despite the initial sorption of P, over time, release reasonable amounts of P to the soil solution, allowing the development of the crops. Probably, this fact is due to the low acidity, MPAC and absence of gibbsite in the mineralogical composition of the studied soils, besides the
+, *, **Significant at 0.10, 0.05 and 0.01, respectively
Figure 1. Dry matter of maize cultivated in six soils from the Paraíba state subjected to doses of P (D) and incubation times (T)
0 5 10 15 20 25 30
0 100 200 300
DM = 1.89 + 0.20**D - 0.00039**D R = 0.94
2 2 Dr ym a tte r( g pot -1)
P doses (mg dm )-3 DM = 2.61 + 0.15**D - 0.00032**D - 0.0080 T + 0.00000016*D T2 ns 2
R = 0.932
0 100 200 300
P dose s (mg d
m-3 ) 0 120 240 Incuba tiontim
e (days ) 0 10 20 30 D ry m a tt e r (g p o t -1) 0 5 10 15 20 25
0 100 200 300
DM = 1.58 + 0.15**D - 0.00031**D R = 0.96
2 2 Dr ym a tte r( g pot -1)
P doses (mg dm )-3 DM = 2.14 + 0.19**D - 0.00043**D + 0.018**T - 0.000074**T - 0.0000000001 + D T
R = 0.93
2 2 2 2
2 0 100 200 300 P d oses (m
g dm-3 ) 0 120 240 Incuba tiontim
e (days ) 0 10 20 30 D ry m a tt e r (g p o t -1)
DM = 13.98 + 0.08**D - 0.00018**D - 0.0028 T - 0.00000004 + D T2 ns 2 R = 0.2 78
0 100 200 300
P dose s (mg d
m-3 ) 0 120 240 360 Incuba tiontim
e (days ) 0 10 20 30 D ry m a tt e r (g p o t -1)
DM = 3.99 + 0.16**D - 0.0003**D - 0.019 T + 0.000048 + T R = 0.89
2 ns 2
2
0 100 200 300
P dose s (mg d
m-3 ) 0 120 240 360 Incuba tiontim
lower contents of Fe and Al oxides, which may have favored the release of P to the solution, since gibbsite, absent in the soils, is responsible for a large part of P adsorption in the soils (Vilar et al., 2010; Souza Júnior et al., 2012).
Conclusions
1. The increase in the time of contact of P with the soils decreases the availability of P to plants.
2. In the studied soils, there is a minor change from labile P to non-labile P, or the formed non-labile P is later released to the soil solution.
3. After 360 days of incubation, it is possible to recover between 26 and 71% of the P applied at the highest dose.
Literature Cited
Alvarez V., V. H.; Novais, R. F.; Dias, L. E.; Oliveira, J. A. Determinação e uso do fósforo remanescente. Boletim Informativo da Sociedade Brasileira de Ciência do Solo, v.25, p.27-32, 2000.
Broggi, F.; Oliveira, A. C.; Freire, F. J.; Freire, M. B. G. S.; Nascimento, C. W. A. Adsorption and chemical extraction of phosphorus as a function of soil incubation time. Revista Brasileira de Engenharia Agrícola e Ambiental, v.14, p.32-38, 2010. http:// dx.doi.org/10.1590/S1415-43662010000100005
Campello, M. R.; Novais, R. F.; Fernandez R., I. E.; Fontes, M. P. F.; Barros, N. F. Avaliação da reversibilidade de fósforo não lábil para lábil em solos com diferentes características. Revista Brasileira de Ciência do Solo, v.18, p.157-165, 1994.
EMBRAPA - Empresa Brasileira de Pesquisa Agropecuária. Manual de métodos de análise de solo. Rio de Janeiro: Embrapa Solos, 1997. 212p.
EMBRAPA - Empresa Brasileira de Pesquisa Agropecuária. Sistema brasileiro de classificação de solos. 2.ed. Rio de Janeiro: Embrapa Solos, 2006. 306p.
Farias, D. R.; Oliveira, F. H. T.; Santos, D.; Arruda, J. A.; Hoffmann, R. B.; Novais, R. F. Fósforo em solos representativos do estado da Paraíba: II - Disponibilidade de fósforo para plantas de milho. Revista Brasileira de Ciência do Solo, v.33, p.633-646, 2009. http:// dx.doi.org/10.1590/S0100-06832009000300016
Freitas, I. F.; Novais, R. F.; Villani, E. M. A.; Novais, S. V. Phosphorus extracted by ion exchange resins and Mehlich-1 from Oxisols (Latosols) treated with different phosphorus rates and sources for varied soil-source contact periods. Revista Brasileira de Ciência do Solo, v.37, p.667-677, 2013. http://dx.doi.org/10.1590/S0100-06832013000300013 Garcia, R. A.; Merlin, A.; Toledo, M. Z.; Fernandes, D. M.; Crusciol,
C. A. C.; Büll, L. T. Desenvolvimento da aveia branca e disponibilidade de fósforo em razão da aplicação de silicato de potássio. Revista Ceres, v.58, p.831-837, 2011. http://dx.doi. org/10.1590/S0034-737X2011000600022
Gonçalves, J. L. M.; Novais, R. F.; Barros, N. F.; Neves, J. C. L.; Ribeiro, A. C. Cinética de transformação de fósforo lábil em não lábil, em solos do Cerrado. Revista Brasileira de Ciência do Solo, v.13, p.13-24, 1989.
Novais, R. F.; Smyth, T. J. Fósforo em solo e planta em condições tropicais. Viçosa: UFV, 1999. 399p.
Pereira, F. B.; Vale, J. C.; Carneiro, P. C. S.; Fritsche-Neto, R. Relação entre os caracteres determinantes das eficiências no uso de nitrogênio e fósforo em milho. Revista Ceres, v.60, p.636-645, 2013.
Ramos, S. J.; Faquin, V.; Rodrigues, C. R.; Silva, C. A. Efeito residual das aplicações de fontes de fósforo em gramíneas forrageiras sobre o cultivo sucessivo da soja em vasos. Bragantia, v.69, p.149-155, 2010. http://dx.doi.org/10.1590/S0006-87052010000100019 Rossi, M. M. S.; Rollán, A. A. C.; Bachmeier, O. A. Phosphorus
availability in the central area of the Argentine Pampean region. 1: Relationship between soil parameters, adsorption processes and wheat, soybean and corn yields in different soil and management environments. Spanish Journal of Soil Science, v.3, p.45-55, 2013.
Sandim, A. S.; Büll, L. T.; Furim, A. R.; Lima, G. S.; Garcia, J. L. N. Phosphorus availability in oxidic soils treated with lime and silicate applications. Revista Brasileira de Ciência do Solo, v.38, p.1215-1222, 2014. http://dx.doi.org/10.1590/S0100-06832014000400018
Santos, H. C.; Oliveira, F. H. T.; Salcedo, I. H.; Souza, A. P.; Silva, V. D. M. Kinetics of phosphorus sorption in soils in the state of Paraiba. Revista Brasileira de Ciência do Solo, v.35, p.1301-1310, 2011. http://dx.doi.org/10.1590/S0100-06832011000400024 Souza Júnior, R. F.; Oliveira, F. H. T.; Santos, H. C.; Freire, F. J.;
Arruda, J. A. Frações de fósforo inorgânico do solo e suas correlações com o fósforo quantificado por extratores e pelo milho. Revista Brasileira de Ciência do Solo, v.36, p.159-169, 2012. http://dx.doi.org/10.1590/S0100-06832012000100017 Tokura, A. M.; Furtini Neto, A. E.; Carneiro, L. F.; Curi, N.; Santos, J.
Z. L.; Alovisi, A. A. Dinâmica das formas de fósforo em solos de textura e mineralogia contrastantes cultivados com arroz. Acta Scientiarum Agronomy, v.33, p.171-179, 2011. http://dx.doi. org/10.4025/actasciagron.v33i1.1435
Tomasi, C. A.; Inda, A. V.; Dick, D. P.; Bissani, C. A.; Fink, J. R. Atributos químicos e área superficial específica em Latossolo subtropical de altitude sob usos e manejos distintos. Ciência Rural, v.42, p.2172-2179, 2012. http://dx.doi.org/10.1590/S0103-84782012005000095