Non-hierarchical clustering of
Manihot esculenta
Crantz germplasm
based on quantitative traits
1Agrupamento não-hierárquico em germoplasma de
Manihot esculenta
Crantz com
base em características quantitativas
Eder Jorge de Oliveira2*, Fabiana Ferraz Aud2, Cinara Fernanda Garcia Morales2, Saulo Alves Santos de
Oliveira2 and Vanderlei da Silva Santos2
ABSTRACT - The knowledge of the phenotypic variation of cassava (Manihot esculenta Crantz) germplasm allows the estimative of the genetic variability to support the selection of contrasting genitors. Therefore, the aim of this work was to define homogeneous groups of cassava germplasm based on yield traits, disease resistance and root quality using K-means as a non-hierarchical method. Breeding values estimated by Best Linear Unbiased Predictor (BLUP) were used for the cluster analysis. The number of groups was defined according to the stabilization of the smallest within-group sum of squares. Seventeen clusters were defined to represent the diversity of the germplasm, whose number of accessions ranged from 7 (Group 15) to 69 (Group 9). In general, accessions belonging to Groups 1, 4, 7, 12, 15 and 16 showed good agronomic traits, such as high fresh root yield and starch yield (> 60.7 t ha-1 and 18.6 t ha-1, respectively). In contrast, only Group 15 presented low bacterial blight
severity. The groups obtained showed strong differences, as evidenced by the within-groups sums of squares values, which ranged from 215.1 (Group 15) to 2,338.3 (Group 8). The K-means algorithm allowed the formation of consistent groups based on yield traits, disease resistance and root quality. Therefore, the K-means algorithm was efficient in the formation of groups with low within genotypic variation, especially concerning large amounts of data, such as in cassava germplasm banks. Key words:Cassava. Genetic resources. Diseases. Breeding. Genotypic data.
RESUMO - O conhecimento da variação fenotípica do germoplasma de mandioca (Manihot esculenta Crantz) permite estimar a variabilidade genética como suporte para seleção de genitores contrastantes. O objetivo deste trabalho foi definir grupos homogêneos de germoplasma de mandioca com base em características produtivas, resistência a doenças e qualidade de raízes utilizando o método não-hierárquicoK-means. Os valores genotípicos estimados pelo BLUP (Best
Linear Unbiased Predictor) foram utilizados para a análise de agrupamento. O número de grupos foi definido no início
da estabilização da menor soma de quadrados dentro dos grupos. Foram obtidos 17 grupos para representar a diversidade do germoplasma, cujo número de acessos variou de 7 (Grupo 15) a 69 (Grupo 9). Em geral, os acessos pertencentes aos grupos 1; 4; 7; 12; 15 e 16, apresentaram boas características agronômicas, tais como alta produtividade de raízes frescas e de amido (> 60,7 t ha-1 e 18,6 t ha-1, respectivamente). Por outro lado, apenas o grupo 15 apresentou menor
severidade de bacteriose. Os grupos obtidos apresentaram grandes diferenças entre si, conforme valores da soma de quadrados dentro dos grupos, que variavam entre 215,1 (Grupo 15) a 2338,3 (Grupo 8). OK-means permitiu a formação de grupos consistentes com base nas características agronômicas avaliadas. Portanto, o algoritmoK-means foi eficiente para a formação de grupos homogêneos com baixa variação genotípica dentro, especialmente para análises de grandes quantidades de dados, como em bancos de germoplasma de mandioca.
Palavras-chave:Mandioca. Recursos genéticos. Doenças. Melhoramento. Dados genotípicos.
*Autor para correspondência DOI: 10.5935/1806-6690.20160066
1Recebido para publicação em 10/10/2014; aprovado em 04/11/2015
Pesquisa financiada pelo CNPq, Fapesb e Coopamido/Bahiamido
2Embrapa Mandioca e Fruticultura, Rua da Embrapa s/n, Caixa Postal 007, Cruz das Almas-BA, Brazil, 44.380-000, [email protected],
INTRODUCTION
Cassava (Manihot esculenta Crantz) is the third
most important source of calories in Africa, Asia and Latin America (after rice and maize) and is characterized as a food security crop in these regions, where most crops are often held by small farmers on marginal lands. The enormous potential of cassava as a raw material base for a range of industrial products can generate increased interest in the culture and thus raise the demand and contribute to agricultural transformation and economic growth in developing countries (FAO, 2013).
Genetic improvement of cassava has achieved significant progress, especially increasing the crop yield potential through the development of new varieties. Furthermore, in addition to the productivity and root quality, the crop’s variety as a component of the production system plays an important role in the market diversification due to the starch specific characteristics that allow its use in several areas
(ZHANGet al., 2010).
From the point of breeding, cassava genetic resources are used as a genetic variation source for incorporation of high agronomical value genes in new cassava varieties. Many important traits have not even been discovered in this germplasm, but in general the search for new alleles for traditionally important characteristics in the cassava production system, which are increasing productivity, starch content and quality and resistance to drought, pests and diseases, is still an extremely important line of research as a step that precedes their use in breeding programs.
In general, the cassava genetic improvement is limited to the evaluation and selection of promising clones
in segregating F1 populations involving only a few dozen
parents. However, to increase the crop’s genetic base, the breeding programs should incorporate new alleles through the use of new germplasms, whether local or even wild species varieties. Thus, an early and important step is the evaluation of new genetic resources of cassava, defining the most promising accessions to be used by plant breeders. Previous studies in cassava accessions revealed that there is enough genetic variability to be exploited in breeding
programs (ESUMA et al., 2012; KIZITO et al., 2007;
KAWUKIet al., 2013; TURYAGYENDAet al., 2012).
The knowledge of the phenotypic variation for the cassava germplasm makes it possible to know the actual genetic variability and support the selection of genetically different parents, which can be used in intercrosses to obtain a high heterosis effect, thereby increasing the probability of recovering superior segregators in further generations. Although several
methods are available to analyze the phenotypic variation, some non-hierarchical methods like K-means have emerged in clustering genotypes, especially when
there is a large data set (RONNINGet al., 2003).
This study is part of an effort to characterize, evaluate and use one of the largest collections of the cassava germplasm from Brazil, which holds thousands of accessions with distinct geographical origins, selection patterns and uses. The proposal is to maximize the potential contribution of the collection to develop a database that will serve as a guide in choosing parents to be used in breeding programs. Therefore, the objective of this study was to define homogeneous groups of cassava germplasm accessions based on yield and root quality traits.
MATERIALS AND METHODS
Plant material
Six hundred and twenty-nine accessions from the cassava germplasm bank (CGB) from Embrapa Mandioca e Fruticultura (Cruz das Almas, BA, Brazil) were evaluated. This database consists of landraces and improved varieties resulting from conventional breeding procedures, such as crossing and selection, as well as the selection of local varieties with high yield potential identified by farmers or research institutions.
Experimental design
The field experiment was installed in September 2011 at the Starch Producers Cooperative (Coopamido) in the municipality of Laje (BA). The experiment was conducted in augmented block design with 629 cassava germplasm accessions as non-common treatments and 11 checks as common treatments distributed in 10 blocks with 10 plants per plot. The spacing used was 0.90 m between rows and 0.80 m between plants and cultivation was performed according to the crop’s recommendations. Plants were harvested 20 months after planting.
Evaluated characteristics
The data evaluated in t ha-1 were yield of
The evaluation for anthracnose (Colletotrichum gloesporioides) and bacterial blight (Xanthomonas axonopodis pvmanihotis) severity were performed under field conditions, disease symptoms were observed at 10 months after planting. For bacterial blight (RBB) the following rating scale was used: 0 = no symptoms; 1 = symptoms on leaves only - blight; 2 = presence of necrotic lesions on the stem or petiole; 3 = most severe symptoms on leaves and / or the presence of necrotic lesions with gum exudation; 4 = complete loss of leaves with apical death or death of the plant, while for anthracnose (RAn) the used scale was: 0 = no anthracnose symptoms; 1 = presence of small cankers or older lesion in the lower half of the plant; 2 = presence of deep cankers in the upper half of the plant; 3 = presence of deep cankers with sporulation, distortion or wilting in leaves and drying up of shoots; 4 = dieback or death of the plant.
The genotypes recoverability after disease infestation (RADI) by means of a scale (0, 1 and 2 = low, medium and high resilience, respectively) was also evaluated. The data of the plots were taken on 10 plants per plot, adopting the criterion of mode to represent the access notes.
Data Analysis
We used the method of restricted maximum likelihood (REML) as described by Resende (2007) to estimate the variance components. Breeding values were obtained from the best linear unbiased predictor (BLUP) using the software Selegen (RESENDE, 2007). Then, the data were subjected to K-means clustering analysis using R version 3.0.1 (R DEVELOPMENT CORE TEAM, 2013). This method employs a non-hierarchical group to minimize the distance between the elements to a set of centers given by = {x1, x2... xk} iteratively. The distance
between apipoint and a set of clusters given byd (pi, ), is
defined as the distance from the closest point to its center. The function to be minimized is given by: (EVERITT; HOTHORN, 2010).
RESULTS AND DISCUSSION
The identification number of the groups was based on the stabilization of the within-group sum of square, whose increase in the number of groups contributed little to the decrease of the sum of squares. Thus, according to Figure 1, 17 groups were identified to represent the genotypic diversity of cassava accessions.
The choice of this number of groups shows high genotypic variability in this analyzed germplasm set, whose mean values of each group are presented
Figure 1 - Distribution of the sum of squares according to the number of clusters. The red circle shows the number of clusters selected
in Table 1. The number of accessions in each group ranged from 7 (Group 15) to 69 (Group 9), averaging 37.6 accessions per group.
The partition of the groups with similar traits and, at the same time, with great distance between groups, was observed. This can be demonstrated by the low values of the within-group sum of square, which ranged from 215.1 (Group 15) to 2,338.3 (Group 8), with an average of 1,372.2. This represents on average only 1.2% of the total sum of squares (109,754.7). The K-means is an algorithm that minimizes the sum of distances for each pattern to each group’s centroid, over all groups, resulting in the formation of groups quite consistent as observed in the analysis of cassava germplasm. Moreover, according
to Ronninget al. (2003), with the K-means clustering of
the potato transcriptome using expressed sequence tags we were able to correlate changes in gene expression with major physiological events in potato biology, such as tuber initiation, dormancy, and sprouting.
Groups 1 and 7 showed the highest values for
YiComRoo (65.63 and 74.20 t ha-1, respectively),
constituting promising groups to select genotypes for
commercial useper se or to be used in breeding programs.
Group # of individuals SQw* Group # of individuals SQw
1 27 1538.8 10 34 1878.4
2 37 1589.7 11 56 1197
3 14 1397.7 12 30 1132.3
4 25 1040.4 13 34 1230.9
5 59 1742.5 14 25 1281.8
6 47 1367.4 15 7 215.1
7 9 661.6 16 43 1486.5
8 58 2338.3 17 65 1569.3
9 69 1660.1
Table 1 - Distribution of cassava accessions based on genotypic values predicted by best linear unbiased predictor (BLUP), through the analysis of 12 agronomic traits and disease resistance
a: SQw is the within-group sum of square
in each cluster, being effective in aiding progeny selection
(DALLASTRAet al., 2014).
Regarding the YiNComRoo, although groups are quite homogeneous, group 3 had the highest standard
deviation (0.76), ranging from 8.46 to 13.88 t ha-1 (Table
2). For ShoWe, a greater variability between the groups formed by K-means method, whose average values ranged
from 23.78 to 44.79 t.ha-1, was observed. However, averages
for groups 3 and 7 are above 43.60 t ha-1, reaching more
than 56.00 t.ha-1 for some genotypes in these groups.
More than 58% of the groups showed a harvest index above 60%, even though the means of groups 11, 13, 16 and 17 are above 65%. An important aspect of this trait is that even with accessions with high shoot production, group 7 also has a high YiComRoo, evidenced by its high harvest index (average of 65.47%). Using phenotypic
means, Ojulonget al. (2010) also observed high amplitude
for this trait (5 to 90%). Moreover, considering the high inheritability of the HI trait, as well as its correlation with fresh root production, some authors have used the HI as an indirect measure of root yield in the early breeding stages
(KAWANOet al., 1998). The balance between the plant
total weight and HI has great importance in the variety selection program, especially in low yield environments.
Plant height is an important trait in cassava crops, whereas cuttings taken from the stems are the main means for the species’ propagation. Therefore, it is desirable to have accessions to the height desired for rapid multiplication of plant genetic material as well as to increase the distribution flow of the propagation material to a greater number of farmers. In this respect, groups 15 and 7 showed average values of 2.43 m and 2.55 m, respectively, ranging from 2.20 m to 2.85 m, in these two groups’ accessions (Table 2).
Another trait of utmost importance for the cassava crop, particularly for crops for industrial production, is the starch weight. For this trait, the group’s average values ranged from 289.4 g to 551 g (groups 14 and 6, respectively) (Table 2). The means for groups 4, 12, 8, 7 and 6 are above 500 g, with some accessions reaching over 600 g, constituting themselves as groups of agronomic interest.
For DMC and StaC, groups 7 and 6 groups were also the most promising, with dry matter content of around 34% and starch levels above 29% in the roots
(Table 3). Recently, Ojulong et al. (2010) reported
averages for DMC ranging from 16.3% to 69.1%. However, these values are related to phenotypic averages of segregating populations in the early improvement stages and must; therefore, be confirmed in further trials with the greatest number of plants per plot.
In contrast, even with high starch content, a good cassava variety must have a root yield potential. Therefore, the starch yield (StaYi) reflects the relation between these two traits well. Generally, accessions present in groups 1 and 7 showed the highest starch yield. Moreover, group 1 presented high root yield, resulting in a good choice for industrial systems aimed at exploiting starch as a raw material. Moreover, accessions from group 7 seem to have a better balance between yield and starch content for fresh roots (Table 3).
Group
YiComRoo1 YiNComRoo ShoWe
Min Max SD Min Max SD Min Max SD
1 59.37 75.15 65.63 4.44 8.06 10.30 9.09 0.48 29.11 42.11 37.15 2.60
2 35.51 47.57 40.62 2.05 8.06 10.45 9.15 0.47 22.53 33.69 27.19 1.94
3 37.97 47.06 41.40 2.73 8.46 13.88 9.83 0.76 37.16 56.82 43.60 5.95
4 46.08 57.99 51.78 2.84 8.21 10.65 9.47 0.45 35.00 46.57 39.89 2.58
5 31.63 43.30 37.37 2.30 8.15 9.71 9.05 0.31 19.81 27.36 23.78 1.55
6 40.07 51.12 44.59 1.94 8.15 10.43 9.38 0.47 26.08 37.74 31.36 2.12
7 68.57 79.05 74.20 4.08 8.66 10.24 9.37 0.50 37.56 56.54 44.79 4.61
8 28.45 41.42 36.75 2.49 6.76 9.72 8.97 0.45 21.41 33.38 27.26 2.41
9 29.75 44.55 41.18 1.57 6.76 11.71 9.23 0.53 22.95 37.18 29.56 1.82
10 28.97 38.78 34.40 2.14 8.06 9.71 8.87 0.40 22.54 36.77 28.21 2.62
11 44.41 52.68 47.98 1.50 8.06 10.34 9.28 0.54 26.24 35.40 30.45 1.67
12 51.22 63.92 56.52 2.68 8.15 11.01 9.26 0.59 23.18 35.01 29.82 2.54
13 43.82 53.03 48.19 2.17 8.21 11.04 9.44 0.59 21.41 37.07 29.35 2.60
14 36.46 40.03 38.40 1.19 8.06 8.66 8.48 0.17 27.22 31.08 28.85 1.32
15 52.77 63.52 58.31 2.76 8.13 9.92 9.12 0.36 31.41 39.42 36.12 2.04
16 52.33 65.83 57.57 2.76 8.06 10.41 9.09 0.47 25.60 37.94 31.69 2.39
17 36.50 47.31 41.76 1.79 8.06 10.89 9.32 0.52 22.30 29.13 25.71 1.37
Group
HI PlHei StaWe
Min Max SD Min Max SD Min Max SD
1 62.00 73.88 65.96 1.79 2.20 2.64 2.41 0.09 420.4 571.2 498.4 35.9
2 60.14 70.76 65.39 2.15 1.97 2.67 2.28 0.10 231.0 371.5 317.3 33.9
3 51.25 59.41 55.39 2.04 2.23 2.99 2.41 0.13 410.1 588.5 488.3 46.3
4 58.76 64.77 61.35 1.00 1.99 2.81 2.41 0.13 430.5 558.6 503.2 32.5
5 61.77 72.10 66.77 2.04 1.89 2.78 2.22 0.11 326.1 463.7 404.3 24.5
6 58.44 68.95 63.44 1.89 2.03 2.90 2.36 0.12 506.5 610.0 551.0 20.9
7 62.34 68.22 65.47 1.34 2.35 2.85 2.55 0.10 471.4 589.0 532.4 32.3
8 52.93 67.92 61.56 2.42 1.90 2.67 2.31 0.13 473.9 604.7 521.5 25.5
9 58.02 68.41 62.88 1.76 2.02 2.91 2.32 0.11 368.6 532.7 430.7 24.8
10 40.38 62.44 57.06 3.09 1.95 2.55 2.25 0.12 364.6 477.3 421.0 31.6
11 62.01 71.40 65.61 1.64 2.01 2.73 2.33 0.09 423.5 511.7 467.8 22.1
12 64.25 72.76 68.69 1.97 1.93 2.56 2.30 0.12 472.9 584.9 517.1 22.5
13 61.24 73.67 67.12 2.33 2.06 2.62 2.34 0.11 313.9 423.6 376.1 21.3
14 55.33 60.03 58.21 1.57 2.11 2.42 2.30 0.10 233.1 309.8 289.4 22.5
15 61.75 68.32 64.64 1.63 2.20 2.53 2.43 0.07 282.9 358.3 314.3 21.0
16 63.79 73.84 67.26 1.83 2.12 2.73 2.36 0.11 373.5 466.5 419.7 21.9
17 62.82 72.67 67.71 2.06 1.93 2.52 2.23 0.11 449.5 546.1 489.4 22.8
Table 2 - Variation of agronomic traits present in clusters formed by K-means analysis, based on the analysis of genotypic values obtained by best linear unbiased predictor (BLUP) in cassava accessions
1: yield of commercial roots (YiComRoo); yield of noncommercial roots (YiNComRoo); shoot weight (ShoWe); harvest index (HI); plant height
Group
DMC1 StaC StaYi
Min Max SD Min Max SD Min Max SD
1 30.24 35.17 32.78 1.21 25.59 30.52 28.13 1.21 18.21 24.31 20.37 1.37
2 23.81 32.21 27.04 1.22 19.16 27.56 22.39 1.22 11.09 13.82 12.31 0.49
3 29.89 35.82 32.39 1.62 25.24 31.17 27.74 1.62 12.06 17.07 14.31 0.98
4 30.59 34.94 32.93 1.07 25.94 30.29 28.28 1.07 15.04 20.10 17.00 1.04
5 27.76 34.17 29.85 0.88 23.11 29.52 25.20 0.88 10.16 13.32 12.08 0.60
6 33.11 36.69 34.42 0.76 28.46 32.04 29.77 0.76 12.97 17.76 15.24 1.00
7 31.84 35.70 33.89 1.12 27.19 31.05 29.24 1.12 22.35 26.25 23.70 1.16
8 31.93 36.51 33.52 0.84 27.28 31.86 28.87 0.84 10.00 13.98 12.44 0.61
9 28.35 34.38 30.59 0.89 23.70 29.73 25.94 0.89 10.00 14.76 13.26 0.60
10 28.36 35.59 31.15 1.29 23.71 30.94 26.50 1.29 9.43 12.49 11.39 0.44
11 30.16 33.15 31.65 0.71 25.51 28.50 27.00 0.71 13.96 16.92 15.34 0.67
12 31.70 35.66 33.35 0.83 27.05 31.01 28.70 0.83 16.53 21.52 18.30 0.95
13 26.38 29.95 28.55 0.75 21.73 25.30 23.90 0.75 12.93 16.42 14.51 0.55
14 25.54 30.38 28.38 2.17 20.89 25.73 23.73 2.17 10.95 12.36 11.58 0.44
15 25.37 27.99 26.56 0.74 20.72 23.34 21.91 0.74 13.43 17.08 15.51 0.71
16 28.45 31.65 30.11 0.75 23.80 27.00 25.46 0.75 15.28 19.60 16.97 0.84
17 30.83 34.52 32.44 0.78 26.18 29.87 27.79 0.78 11.71 16.38 13.92 0.72
Group
RBB RAn RADI
Min Max SD Min Max SD Min Max SD
1 0.97 2.70 1.36 0.40 2.97 3.41 3.09 0.08 1.25 1.32 1.30 0.02
2 0.96 1.91 1.20 0.31 2.81 3.18 3.10 0.07 1.25 1.32 1.29 0.02
3 0.96 1.91 1.34 0.37 2.94 3.18 3.05 0.06 1.26 1.32 1.31 0.01
4 0.96 2.85 1.39 0.43 2.85 3.30 3.11 0.08 1.25 1.32 1.29 0.02
5 0.96 1.93 1.26 0.34 2.85 3.23 3.10 0.07 1.25 1.32 1.29 0.02
6 0.96 1.89 1.34 0.40 2.90 3.20 3.10 0.06 1.26 1.32 1.29 0.02
7 0.99 1.88 1.47 0.31 2.89 3.17 3.04 0.09 1.23 1.41 1.31 0.03
8 0.96 1.89 1.29 0.35 2.81 3.30 3.13 0.07 1.18 1.32 1.29 0.02
9 0.96 2.85 1.27 0.36 2.88 3.38 3.11 0.07 1.18 1.34 1.29 0.02
10 0.96 1.91 1.33 0.37 2.81 3.23 3.08 0.09 1.25 1.32 1.30 0.02
11 0.96 1.91 1.28 0.36 2.80 3.23 3.09 0.09 1.26 1.32 1.29 0.02
12 0.96 1.93 1.33 0.36 2.80 3.20 3.08 0.07 1.25 1.32 1.30 0.02
13 0.96 1.89 1.24 0.34 2.90 3.20 3.08 0.07 1.25 1.32 1.30 0.02
14 0.96 0.97 0.97 0.00 3.07 3.17 3.11 0.05 1.26 1.29 1.28 0.01
15 0.97 1.03 0.99 0.01 2.98 3.23 3.09 0.09 1.25 1.31 1.29 0.02
16 0.96 2.04 1.28 0.35 2.80 3.23 3.06 0.09 1.26 1.32 1.30 0.01
17 0.96 1.91 1.17 0.27 2.89 3.23 3.10 0.07 1.25 1.32 1.30 0.02
Table 3 - Variation of agronomic traits and disease resistance present in clusters formed by K-means analysis, based on the analysis of genotypic values obtained by best linear unbiased predictor (BLUP) in cassava accessions
1: dry matter content (DMC); starch content (StaC); starch yield (StaYi); bacterial blight severity (RBB); anthracnose severity (RAn); genotype’s
cassava in Brazil. In regions where climatic conditions are favorable, such as the South, Southeast and Midwest, this disease becomes limiting and can cause total losses when susceptible varieties are grown. In the Northeast, the disease dissemination is more located in Bahia state and is particularly found in crops in the Cerrado ecosystems, Low and Middle São Francisco, Chapada Diamantina and recently also Falcão River Valley (FUKUDA; GOMES, 2005). As the development of resistant varieties is an effective measure in controlling the disease, identification of sources resistant to the pathogen is an important step for incorporating these alleles in commercial varieties.
Considering anthracnose (RAn), the mean genotypic values of different groups were very similar; although accessions from group 8 have shown an average score of 3.13 (range 2.81 to 3.30). Anthracnose is widespread in all producing regions but is especially severe in the Northeast and Southeast regions of Brazil, where environmental conditions are more favorable for its development. Long rainy periods with temperatures between 18 and 28 °C are the ideal conditions for the disease’s occurrence and spread. Although the records of economic damage caused by anthracnose are scarce, it is necessary to take control of preventive measures to avoid risks to the production and the infection of the propagation material for the next cycles.
Genotypic data on severity caused by anthracnose and bacterial blight (RADI) is an initial indication of the resistance of cassava accessions evaluated in this work, whereas the incidence of these diseases in the field occurred by natural pathogen dispersal, and so a high uniformity on inoculums distribution and concentration is not to be expected. Hence, further evaluation should be performed so that this information could be used in the selection of sources resistant to these important cassava diseases.
In genotypic terms, differences were not observed between K-means clusters for RADI (Table 3). However, as the heritability of this trait was very low (0.02 - data not shown), it is necessary to conduct further experiments under these conditions to verify the effectiveness of this trait’s use in selecting accessions more tolerant to the infection by foliar diseases.
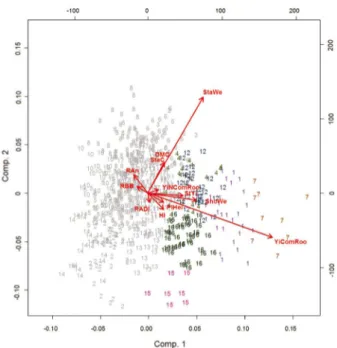
The K-means method partitioned the data into
mutually exclusive k clusters , without the building of
dendrograms to describe data grouping. However, it is possible to represent the distribution of individuals and the evaluated characteristics based on the analysis of the main components (Figure 2). Genotype grouping based on multivariate methods constitutes a strategy to summarize the information for breeders. In this case, the representative cassava accessions can be easily selected
Figure 2 - K-means clustering analysis for the 1st and 2nd
components of PCA. Numbers represent different clusters. Grey and colored numbers represent the non-selected and selected groups, respectively. Arrows indicate the projection of the traits onto the principal components dimension and their relationships with differences between and within groups
from the groups with specific characteristics of interest and used in hybridization programs with improved cultivars or accessions belonging to other groups holding other important attributes.
In general, it is observed that accessions belonging to Groups 1, 4, 7, 12, 15 and 16 present agronomic characteristics for direct use in the production system, or as parents in crossing blocks. For example, in these groups the average yield for
commercial roots and starch was 60.7 t.ha-1 and 18.6
t.ha-1, which is approximately 26.7% and 22.3%,
that may bring some agronomic advantage over the available varieties, it is expected that the evaluation of genetic variability degree for cassava germplasm promoted in this paper can lead to a more effective use of this important genetic resource.
CONCLUSIONS
The genetic variability of the 629 cassava accessions is high enough to be exploited in breeding programs. Based on this, it was possible to define groups of quite different traits to each genotype of interest. Therefore, non-hierarchical groups such as K-means are an efficient method for the formation of groups with the lowest within-genotypic variation, especially with large amount of data, such as in cassava germplasm banks.
ACKNOWLEDGEMENTS
The authors thank CNPq, Fapesb and Coopamido/ Bahiamido for the funding and support necessary for this research.
REFERENCES
DALLASTRA, A.et al. Multivariate approach in the selection of superior soybean progeny which carry the RR gene.Revista Ciência Agronômica, v. 45, n. 3, p. 588-597, 2014.
ESUMA, W.et al. Genetic diversity of provitamin A cassava in Uganda.Journal of Plant Studies, v. 1, n. 1, p. 60-71, 2012. EVERITT, B. S.; HOTHORN, T.A handbook of statistical analyses using R. 2 ed. London: Chapman & Hall, 2010. 376 p.
FOOD AND AGRICULTURE ORGANIZATION of the UNITED NATIONS. Rome, Italy. 2013. Disponível em:
<www.fao.org/ag/agp/agpc/gcds>. Acesso em: 12 fev. 2014.
FUKUDA, C.; GOMES, J. C.Bacteriose da mandioca. Cruz das Almas: Embrapa Mandioca e Fruticultura Tropical, 2005. 2 p.
KAWANO K.et al. Yield improvement in a multistage breeding program for cassava. Crop Science, v. 38, n. 2, p. 325-332, 1998.
KAWUKI, R. S.et al. Genetic diversity of cassava (Manihot esculenta Crantz) landraces and cultivars from southern, eastern and central Africa.Plant Genetics Resources, v. 11, n. 2, p. 170-181, 2013.
KIZITO E. B.et al. Genetic diversity and variety composition of cassava on small-scale farms in Uganda: an interdisciplinary study using genetic markers and farmer interviews.Genetica, v. 130, n. 3, p. 301-318, 2007.
OJULONG, H. F. et al. Yield traits as selection indices in seedling populations of cassava.Crop Breeding and Applied Biotechnology, v. 10, n. 3, p. 191-196, 2010.
R DEVELOPMENT CORE TEAM. R: a language and environment for statistical computing, reference index version 3.0.1. Vienna, Austria: R Foundation for Statistical Computing, 2013. Disponível em: <http://www.R-project. org> Acesso em: 10 jan. 2013.
RESENDE, M. D. V.Selegen-Reml/Blup: sistema estatístico e seleção genética computadorizada via modelos lineares mistos. Colombo: Embrapa Florestas, 2007. 360 p.
RONNING, C. M. et al. Comparative analyses of potato expressed sequence tag libraries.Plant Physiology, v. 131, n. 2, p. 419-429, 2003.
TURYAGYENDA, L. F.,et al. Genetic diversity among farmer-preferred cassava landraces in Uganda.African Crop Science Journal, v. 20, n. 1, p. 15-30, 2012.