Evaluation of total flavonoid content and
analysis of related EST-SSR in Chinese peanut
germplasm
Mingyu Hou
1,2, Guojun Mu
1, Yongjiang Zhang
3, Shunli Cui
1,
Xinlei Yang
1and Lifeng Liu
1*Abstract: As important antioxidants and secondary metabolites in peanut seeds,
flavonoids have great nutritive value. In this study, total flavonoid contents (TFC) were determined in seeds of 57 peanut accessions from the province of Hebei, China. A variation of 0.39 to 4.53 mg RT g-1 FW was found, and eight germplasm samples containing more than 3.5 mg RT g-1 FW. The TFC of seed embryos ranged from 0.14 to 0.77mg RT g-1 FW. With a view to breeding high-quality peanut varieties with high yields and high TFC, we analyzed the correlations between TFC and plant and pod characteristics. The results of correlation analysis indicated that TFC was significantly negatively correlated with pod number per plant (P/P) and soluble protein content (SPC). We used 251 pairs of expressed sequence tag - simple sequence repeat (EST-SSRs) primers to sequence all germplasm samples and found four EST-SSR markers that were significantly related to TFC.
Key words:Peanut (Arachis hypogaea L.), flavonoid, germplasm, EST-SSR, cor -relation analysis.
Crop Breeding and Applied Biotechnology 17: 221-227, 2017 Brazilian Society of Plant Breeding. Printed in Brazil
http://dx.doi.org/10.1590/1984-70332017v17n3a34
ARTICLE
*Corresponding author:
E-mail: [email protected]
Received: 16 June 2016 Accepted: 04 January 2017
1 Agricultural University of Hebei, Laboratory
of Crop Germplasm Resources for Northern China, Ministry of Education/Key Laboratory of Crop Germplasm Resources of Hebei Prov-ince/College of Agronomy, Baoding 071001,
China
2 Agricultural University of Hebei, College of
Life Science, Baoding 071001, China
3 Agricultural University of Hebei, College of
Agronomy, Baoding 071001, China
INTRODUCTION
Flavonoids are secondary metabolites contained in a wide variety of plants, and their pharmacological effects include anti-inflammatory, anti-hyperlipidemia, anti-cancer, immunity-promoting, and obesity-preventing effects (Shao et al. 2011, Destro et al. 2013). Flavonoid content is used as an important index of crop quality in breeding, where screening of high-flavonoid germplasm in crops such as rice and wheat has been reported. Additional reports have found a correlation between flavonoid content and other characters, including grain shape and seed-coat color, as well as related quantitative trait loci (QTLs) (Zhang et al. 2010, Shao et al. 2011, Wang et al. 2015).
FW: fresh weight), but found no correlation between TFC and seed-coat color. Studies on peanut flavonoids, however, have so far focused on the flavonoid types found in seeds (Wang et al. 2008), the variation in the range of flavonoid contents, and the relationship between flavonoid content and seed-coat color (Wang et al. 2013, Chukwumah et al. 2009, Yoav et al. 2012). High quality is important for cultivar breeding, at the same time yield and resistant traits are also major factors in breeding research. Godoy et al. (2014) developed some peanut cultivars with high oleic and high yield. And some peanut cultivars with leaf spot resistance and high yield were breeded by Suassuna et al. (2015). So it will be significant to study the relationships between flavonoid content and other biological characteristics.
Flavonoid content can be considered a quantitative characteristic, as it varies according to each peanut accession (Chukwumah et al. 2009, Wang et al. 2013). The development of molecular markers associated with flavonoid content could greatly improve the efficiency of screening germplasm for high flavonoid content. At present, some studies based on molecular markers associated with peanut traits have addressed the contents of protein, fat, and fatty acid, but few those of flavonoids. Sarvamangala et al. (2011) and Pandey et al. (2014) successfully identified QTLs for peanut protein, fat, and fatty acid content using an SSR genetic map constructed with a population of recombinant inbred lines (RIL). In addition, transgenic can also promote peanut breeding. Hassan et al. (2016) transformated chitinase gene into peanut to enhance resistance to leaf spot. A RIL population was also used for the initial location of QTLs for peanut TFC by Mondal et al. (2015), but further research on this topic is required.
China has the largest peanut–producing area in the world. The province of Hebei ranks third in total production and fourth in planted area in China. In this study, we determined the TFC of 57 peanut landraces and assessed correlations between TFC and botanical yield as well as nutritional quality traits. In addition, we screened EST-SSR markers to detect associations with TFC. The results of this study not only defined the distribution of TFC in peanut germplasm in more detail, but also provide important guidance for molecular breeding of peanut with high yield, high quality, and high flavonoid content.
MATERIAL AND METHODS
The 57 peanut landraces from the province of Hebei used in this study (Table 1) were provided by the Crop Germplasm Resource Laboratory, of the Agricultural University of Hebei. The experiments were carried out at the experimental station of Baoding of this university (lat 38° 81’ N, long 115° 67’ E, alt 19 m asl). The above peanut landraces were planted on May 10, 2013, routinely managed, and harvested at maturity in September. Three plants per variety were harvested and dried, and the seeds within the browned outer shells were stored at 4 °C.
The peanut seeds were ground with a universal high-speed smashing machine, passed through a 20-mesh sieve, and weighed. The resulting extract was analyzed to evaluate TFC, fat content (FC), SPC and total sugar content (TSC). The FC was calculated by the Chinese National Standard Method GB/T 14772-2008. The SPC and TSC were determined as proposed by Wang et al. (2009).
The TFC of the peanut seeds in the shell was determined according to the protocol of Chukwumah et al. (2009). The alumina colorimetric method was used, and the absorbance value of reactants determined at 510 nm. Rutin (RT) purchased from Shanghai Yuanye Bio-Technology Co., Ltd. was used as a standard. After removing the seed coat, the TFC of the peanut embryo was determined by the above method. Results were expressed as rutin equivalent on a fresh weight basis (mg RT g-1 FW).
Three individual plants with varietal characteristics were selected during the harvest for each landrace. Plant characteristics were determined, including plant height (PH), branch length (BL), and branching number (BN). A single plant was harvested and dried naturally, and we subsequently measured pod traits, such as P/P, 100-pod weight (100 PW), 100-seed weight (100 SW), pod kernel thickness (PKT), and reticulation depth (RD); the latter two were measured with a Vernier caliper.
synthesized by Beijing TsingKe Co., Ltd. The functions of correlated markers were determined by BLAST searches of the NCBI GenBank database. The SAS 9.1.3 software package was used for correlation analysis.
RESULTS AND DISCUSSION
The TFC in seeds of the 57 peanut accessions varied between 0.39 and 4.53 mg RT g-1 FW, with a 11.6 times higher maximum than minimum value. The TFC of 35 accessions were between 1.5 and 3.5 mg RT g-1 FW (Figure 1). The TFC of the Yanshanwuyawo landrace was highest (4.53 mg RT g-1 FW), followed by Renqiuyiwohou (4.32 mg RT g-1 FW), Longyaoyiwohou (4.04 mg RT g-1 FW), Xinnongyiwohou (3.92 mg RT g-1 FW), Xiangheyiwohou (3.87 mg RT g-1 FW), Luanpingdahuasheng (3.84 mg RT g-1 FW), Damingyibajiu (3.79 mg RT g-1 FW), and Lulongxiaohuasheng (3.61 mg RT g-1 FW). The highest TFC among the 27 peanut cultivars in the study by Chukwumah et al. (2009) was 1.40 mg CE g-1 FW, while the average TFC determined in this study was higher than 1.40 mg CE g-1 FW. Both rutin and catechin are standards for flavonoid analysis. This discrepancy may be due to the different germplasm used in each study. The highest isoflavone content in wild soybean germplasm found in the province of Heilongjiang was 6.81 mg g-1 FW (Lin et al. 2005). Germplasm sources of resistance to leaf spot were more abundant in wild peanut species and landraces than in commercial cultivars (Suassuna et al. 2015). For being members of the Leguminosae family, wild peanut and peanut landraces are likely to contain germplasm with higher flavonoid contents, which is a yet untapped potential. The eight high-flavonoid accessions identified in this experiment will be useful references for the genetic breeding of high-flavonoid peanut.
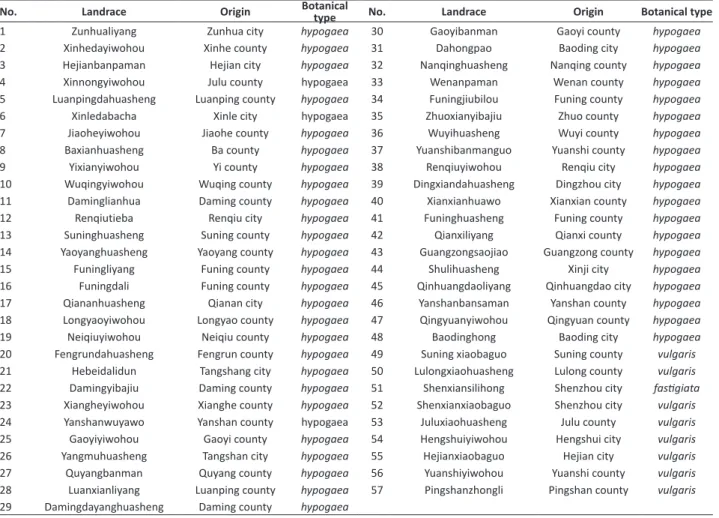
Table 1. Peanut landraces for research
No. Landrace Origin Botanical type No. Landrace Origin Botanical type
1 Zunhualiyang Zunhua city hypogaea 30 Gaoyibanman Gaoyi county hypogaea
2 Xinhedayiwohou Xinhe county hypogaea 31 Dahongpao Baoding city hypogaea
3 Hejianbanpaman Hejian city hypogaea 32 Nanqinghuasheng Nanqing county hypogaea
4 Xinnongyiwohou Julu county hypogaea 33 Wenanpaman Wenan county hypogaea
5 Luanpingdahuasheng Luanping county hypogaea 34 Funingjiubilou Funing county hypogaea
6 Xinledabacha Xinle city hypogaea 35 Zhuoxianyibajiu Zhuo county hypogaea
7 Jiaoheyiwohou Jiaohe county hypogaea 36 Wuyihuasheng Wuyi county hypogaea
8 Baxianhuasheng Ba county hypogaea 37 Yuanshibanmanguo Yuanshi county hypogaea
9 Yixianyiwohou Yi county hypogaea 38 Renqiuyiwohou Renqiu city hypogaea
10 Wuqingyiwohou Wuqing county hypogaea 39 Dingxiandahuasheng Dingzhou city hypogaea
11 Daminglianhua Daming county hypogaea 40 Xianxianhuawo Xianxian county hypogaea
12 Renqiutieba Renqiu city hypogaea 41 Funinghuasheng Funing county hypogaea
13 Suninghuasheng Suning county hypogaea 42 Qianxiliyang Qianxi county hypogaea
14 Yaoyanghuasheng Yaoyang county hypogaea 43 Guangzongsaojiao Guangzong county hypogaea
15 Funingliyang Funing county hypogaea 44 Shulihuasheng Xinji city hypogaea
16 Funingdali Funing county hypogaea 45 Qinhuangdaoliyang Qinhuangdao city hypogaea 17 Qiananhuasheng Qianan city hypogaea 46 Yanshanbansaman Yanshan county hypogaea
18 Longyaoyiwohou Longyao county hypogaea 47 Qingyuanyiwohou Qingyuan county hypogaea
19 Neiqiuyiwohou Neiqiu county hypogaea 48 Baodinghong Baoding city hypogaea
20 Fengrundahuasheng Fengrun county hypogaea 49 Suning xiaobaguo Suning county vulgaris 21 Hebeidalidun Tangshang city hypogaea 50 Lulongxiaohuasheng Lulong county vulgaris 22 Damingyibajiu Daming county hypogaea 51 Shenxiansilihong Shenzhou city fastigiata 23 Xiangheyiwohou Xianghe county hypogaea 52 Shenxianxiaobaguo Shenzhou city vulgaris 24 Yanshanwuyawo Yanshan county hypogaea 53 Juluxiaohuasheng Julu county vulgaris 25 Gaoyiyiwohou Gaoyi county hypogaea 54 Hengshuiyiwohou Hengshui city vulgaris 26 Yangmuhuasheng Tangshan city hypogaea 55 Hejianxiaobaguo Hejian city vulgaris 27 Quyangbanman Quyang county hypogaea 56 Yuanshiyiwohou Yuanshi county vulgaris
28 Luanxianliyang Luanping county hypogaea 57 Pingshanzhongli Pingshan county vulgaris
The TFC of the 57 peanut germplasm embryos varied between 0.14 and 0.77 mg RT g-1 FW, of which 42 accessions had contents between 0.3 and 0.6 mg RT g-1 FW (Figure 1). The TFC of two landraces exceeded 0.60 mg RT g-1 FW: Pingshanzhongli (0.67 mg RT g-1 FW) and Shenxianxiaobaguo (0.77 mg RT g-1 FW). The amount of flavonoids distributed in the seed coat and embryo varied according to each peanut accession. In 48 accessions, the embryo accounted for less than 30% of the TFC of the seeds (Figure 2) and in only four accessions, the embryo contained more than 50% of the seed TFC, namely Qingyuanyiwohou (0.42 mg RT g-1 FW in embryos, accounting for 59.25%), Juluxiaohuasheng (0.26 mg RT g-1 FW, 66.98%), Yuanshibanmanguo (0.41 mg RT g-1 FW, 54.84%), and Yuanshiyiwohou (0.28 mg RT g-1 FW, 68.39%).
Flavonoid secondary metabolites are abundant in plant seed coats. Research on soybean and rice has shown that the flavonoid content in the seed coat is higher than in the embryo per unit of seeds (Bordiga et al. 2014, Min et al. 2015). Research has also indicated that the flavonol content in rice embryos is much higher than that in seed coats (Galland et al. 2014); however, few studies have analyzed the flavonoid content in peanut seed embryos. It has been hypothesized that the types and amounts of flavonoids distributed in the seed coat and embryo may be related to the plant genotype. As an index of edible quality, the flavonoid content in the embryo has gained particular attention in peanut breeding. While the TFC in the embryos of the above four accessions (Qingyuanyiwohou, etc.) were not the absolute highest among the tested germplasm,
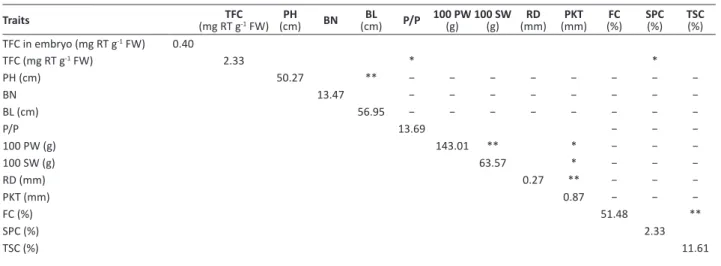
Table 2. Phenotypic values of plant, pod and quality traits and their correlation analysis with TFC in peanut germplasm
Traits (mg RT gTFC-1 FW) (cm)PH BN (cm)BL P/P 100 PW (g) 100 SW (g) (mm)RD (mm)PKT (%)FC SPC(%) TSC(%)
TFC in embryo (mg RT g-1 FW) 0.40
TFC (mg RT g-1 FW) 2.33 * *
PH (cm) 50.27 ** − − − − − − − −
BN 13.47 − − − − − − − −
BL (cm) 56.95 − − − − − − − −
P/P 13.69 − − −
100 PW (g) 143.01 ** * − − −
100 SW (g) 63.57 * − − −
RD (mm) 0.27 ** − − −
PKT (mm) 0.87 − − −
FC (%) 51.48 **
SPC (%) 2.33
TSC (%) 11.61
* and **: significant correlation at the 0.05 and the 0.01 probability levels, respectively. −: not detected.
TFC: total flavonoid content; PH: plant height; BN: branching number; BL: branch length; P/P: pod number per plant; 100 PW: 100-pod weight; 100 SW: 100-seed weight; RD: reticulation depth; PKT: pod kernel thickness; FC: fat content; SPC: soluble protein content; TSC: total sugar content.
Figure 1.Histogram for the frequency distribution of TFC of seed
(A) and embryo (B) in peanut germplasm
Figure 2. The percentage of TFC contained in the embryos of
the TFC in the embryos were higher than those in the seed coats, indicating that there is a pathway for concentrating flavonoids in the embryo. The types of flavonoids distributed in the seed coat and embryo, as well as the regulation mechanisms of flavonoid concentration in the seed coat and embryo still require further study.
Among the 57 peanut accessions there was abundant genetic variation for each assessed plant characteristic, including the traits related to pod, plant, and quality (Table 2). Among plant and pod characteristics, 100 PW demonstrated the highest variation with a standard deviation (SD) of 28.50, while the range was largest for RD, with a 36.5-fold difference between the maximum and minimum values. In terms of quality characteristics, the SPC ranged from 0.17% (Dahongpao) to 4.42% (Xianxianhuawo), while the TSC ranged from 7.81% (Fengrundahuasheng) to 18.01% (Luanpingdahuasheng). The FC of landrace Shenxiansilihong was the highest (58.97%) and that of Funingdali the lowest (45.16%).
Adequate vegetative growth of plants can generate a sufficient photosynthetic output to provide raw materials for seeds and improve their yield and quality. The yield level of legumes influences their fat and protein contents. For example, 100-seed weight is positively correlated with oil content in Ricinus communis (Severino et al. 2015). In this study, the TFC in peanut was negatively correlated with plant and pod characteristics. Only the negative correlation between TFC and P/P was significant (Pearson correlation co-efficient = -0.244, P = 0.034). In a future study, the genetic mechanisms underlying this relationship should be investigated to establish a theoretical basis for the breeding of peanut varieties with high yields and flavonoid contents.
As a secondary metabolite, flavonoids are synthesized via the phenylpropanoid pathway, while the initiator phenylalanine is generated in the shikimate pathway. The aromatic amino acids in plant proteins are also derived from the shikimate pathway, and the synthesis of fatty acids begins with the decarboxylation of the glycolytic intermediate pyruvic acid. Therefore, the flavonoids, proteins and fats stored in seeds originate from and compete for the same glycolytic intermediate pyruvic acid. It is hypothesized, therefore, that flavonoids would be negatively correlated with proteins and fats and positively correlated with sugar. In soybean seeds, however, the oil content is negatively correlated with protein content, and soybean isoflavone is negatively correlated with fat and positively correlated with protein content (Charron et al. 2005). In the above-mentioned mini-core collection of American peanut studied by Wang et al. (2013), no significant correlation between the fatty acid content and the contents of flavonoids such as quercetin and genistein was detected. In this study, we analyzed the correlation between TFC in peanut and several primary storage substances. Our results were similar to those found for soybean by Charron et al. (2005). Peanut TFC was negatively correlated with FC and SPC, though the correlation was only significant for SPC (Pearson correlation coefficient: -0.254, P = 0.028). TFC also exhibited a weak positive correlation with TSC (Table 2). The Luanpingdahuasheng landrace exhibited the highest TSC (18.01%) and a high TFC (3.84 mg RT g-1 FW).
Compared to other secondary metabolites such as salicylic acid and lignin, the heritability of flavonoid content is higher (Caseys et al. 2015). Germplasm with high flavonoid contents can therefore be selected by breeding. Molecular markers could accelerate genetic breeding for high flavonoid content (Sakiyama et al. 2014). Rhodes et al. (2014)
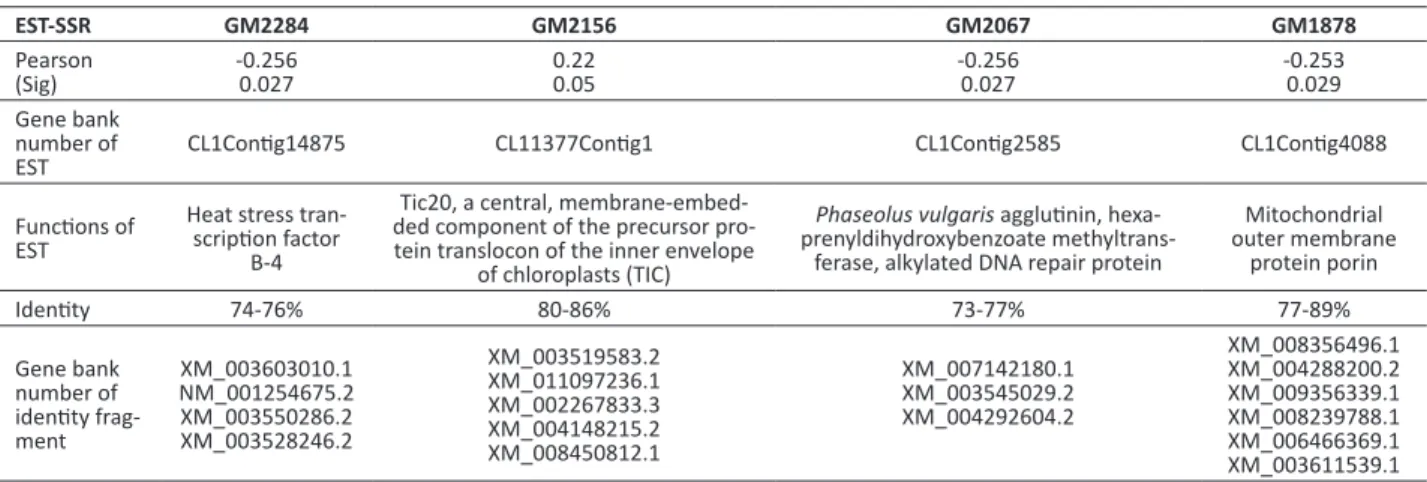
Table 3.The marker loci associated with flavonoid of peanut seed
EST-SSR GM2284 GM2156 GM2067 GM1878
Pearson
(Sig) -0.2560.027 0.220.05 -0.2560.027 -0.2530.029
Gene bank number of
EST CL1Contig14875 CL11377Contig1 CL1Contig2585 CL1Contig4088
Functions of EST
Heat stress tran-scription factor
B-4
Tic20, a central, membrane-embed-ded component of the precursor pro-tein translocon of the inner envelope
of chloroplasts (TIC)
Phaseolus vulgaris agglutinin, hexa-prenyldihydroxybenzoate
methyltrans-ferase, alkylated DNA repair protein
Mitochondrial outer membrane
protein porin
Identity 74-76% 80-86% 73-77% 77-89%
Gene bank number of identity frag-ment
XM_003603010.1 NM_001254675.2 XM_003550286.2 XM_003528246.2
XM_003519583.2 XM_011097236.1 XM_002267833.3 XM_004148215.2 XM_008450812.1
XM_007142180.1 XM_003545029.2 XM_004292604.2
identified a QTL for flavonoid synthesis genes in sorghum in a genome-wide association study (GWAS). On the basis of 50 extant QTLs for isoflavone in soybean, Wang et al. (2015) located 21 new QTLs using a RIL population, including many sites related to the environment. In peanut, Mondal et al. (2015) located five QTLs for flavonoid content using a RIL population, including pPGPseq_12A07–UBC 841, GM 633–Ah242, RM14E11–TE 389, ARS 796–SSR_HO115593, and S89–TC11D09, with a minimum distance between markers of 21.0 cM. In this study, 215 pairs of EST-SSR markers were used to determine genetic differences in the 57 accessions. As a result, we discovered polymorphisms in 57 EST-SSRs. By correlation analysis, we found that four EST-SSRs were significantly correlated with TFC (Table 3): GM2284, GM2156, GM2067, and GM1878.
The functions of these four TFC-related EST-SSR markers were analyzed and each EST had more than 70% identity with gene sequences of other species (Table 3). The outer membrane protein porin is essential for transmembrane transport and signal transduction, while the heat-shock transcription factor promotes the transcription of genes when the plant is under stress. Lectins respond to the secondary metabolites generated under biotic stress to help plants adapt to the environment. As flavonoids are secondary metabolism products of plants under external stress, theoretically, the expressions of these genes should be positively correlated with flavonoid content in plants, however, we found that all markers except GM2156 were negatively correlated with TFC. The distance of these markers to flavonoid QTLs and the regulation mechanism of these ESTs need to be corroborated to confirm their functions in flavonoid synthesis in peanut seeds.
ACKNOWLEDGEMENTS
The authors thank the National Natural Science Foundation of China (31471523) and Introduction of International Advanced Agriculture Science and Technology (2013-Z65) for financial support.
REFERENCES
Bordiga M, Gomez-Alonso S, Locatelli M, Travaglia F, Coïsson J,
Hermosin-Gutierrez I and Arlorio M (2014) Phenolics characterization and antioxidant activity of six different pigmented Oryza sativa L. cultivars grown in Piedmont (Italy). Food Research International 65: 282-290. Caseys C, Stritt C, Glauser G, Blanchard T and Lexer C (2015) Effects of
hybridization and evolutionary constraints on secondary metabolites: The genetic architecture of phenylpropanoids in European populus species. PLOS ONE 26: e0128200. doi: 10.1371/journal.
pone.0128200.
Charron CS, Allen FL, Johnson RD, Pantalone VR and Sams CE (2005) Correlations of oil and protein with isoflavone concentration in soybean [Glycine max (L.) Merr.]. Journal of Agricultural and Food Chemistry 53: 7128-7135.
Chukwumah Y, Walker LT and Verghese M (2009) Peanut skin color: a biomarker for total polyphenolic content and antioxidative capacities of peanut cultivars. International Journal of Molecular Science 10:
4941-4952.
Destro D, Faria AP, Destro TM, Faria RT, Gonçalves LSA and Lima WF (2013) Food type soybean cooking time: a review. Crop Breeding and Applied Biotechnology 13: 194-199.
Galland M, Boutet-Mercey S, Lounifi I, Godin B, Balzergue S, Grandjean O, Morin H, Perreau F, Debeaujon I and Rajjou L (2014) Compartmentation and dynamics of flavone metabolism in dry and germinated rice seeds. Plant Cell Physiology 55: 1646-1659.
Godoy IJ, Santos JF, Carvalho CRL, Michelotto MD, Bolonhezi D, Freitas
RS, Kasai FS, Ticelli M, Finoto EL and Martins ALM (2014) IAC OL 3 and IAC OL 4: new Brazilian peanut cultivars with the high oleic trait.
Crop Breeding and Applied Biotechnology14: 200-203.
Hassan M, Akram Z, Ali S, Ali GM, Zafar Y, Shah ZH and Alghabari F (2016) Whisker-mediated transformation of peanut with chitinase gene enhances resistance to leaf spot disease. Crop Breeding and Applied Biotechnology16: 108-114.
Lin H, Lai YC, Qi N, Li H, Zhang XB and Yang XF (2005) Screening of germplasm with high content of isoflavones in wild and cultivated soybean in Heilongjiang. Journal of Plant Genetic Resources 6: 53-55. Lopes RM, da Silveria Angostini-Costa T, Gimenes MA and Silveria D (2011)
Chemical composition and biological activities of Arachis species.
Journal of Agriculture and Food Chemistry 59: 4321-4330.
Min HK, Kim SM, Baek SY, Woo JW, Park JS, Cho ML, Lee J, Kwok SK, Kim SW and Park S (2015) Anthocyanin extracted from black soybean seed coats prevents autoimmune arthritis by suppressing the development of Th17 cells and synthesis of proinflammatory cytokines by such cells, via Inhibition of NF-kB. PLOS ONE 10: e0138201.
Mondal S, Phadke RR and Badigannavar AM (2015) Genetic variability for total phenolics, flavonoids and antioxidant activity of testaless seeds of a peanut recombinant inbred line population and identification of their controlling QTLs. Euphytica 204:311-321.
Pandey MK, Wang ML, Qiao L, Feng S, Khera P, Wang H, Tonnis B, Barkley NA, Wang J, Holbrook CC, Culbreath AK, Varshney RK and Guo B (2014) Identification of QTLs associated with oil content and mapping FAD2 genes and their relative contribution to oil quality in peanut (Arachis
Rhodes DH, Hoffmann Jr L, Rooney WL, Ramu P, Morris GP and Kresovich S (2014) Genome-wide association study of grain polyphenol concentrations in global Sorghum [Sorghum bicolor (L.) Moench] germplasm. Journal of Agriculture and Food Chemistry 62: 10916-10927.
Sakiyama NS, Ramos HCC, Caixeta ET and Pereira MG (2014) Plant breeding with marker-assisted selection in Brazil. Crop Breeding and Applied Biotechnology 14: 54-60.
Santos JM, Barbosa GVS, Neto CER and Almeida C (2014) Efficiency of biparental crossing in sugarcane analyzed by SSR markers. Crop Breeding and Applied Biotechnology 14: 102-107.
Sarvamangala C, Gowdaa MVC and Varshney RK (2011) Identification of quantitative trait loci for protein content, oil content and oil quality for groundnut (Arachis hypogaea L.). Field Crops Research 122: 49-59.
Severino LS, Mendesa BSS and Lima GS (2015) Seed coat specific weight and endosperm composition define the oil content of castor seed.
Industrial Crops and Products 75:14-19.
Shao YF, Jin L, Zhang G, Lu Y, Shen Y and Bao JS (2011) Association mapping of grain color, phenolic content, flavonoid content and antioxidant capacity in dehulled rice. Theoretical and Applied Genetics 122: 1005-1016.
Suassuna TMF, Suassuna ND, Moretzsohn MC, Bertioli SCML, Bertioli DJ and Medeiros EP (2015) Yield, market quality, and leaf spots partial resistance of interspecific peanut progenies. Crop Breeding and Applied Biotechnology15: 175-180.
Wang DM, Lv SX and Wang JS (2009) Laboratory course of biochemistry.
Science Press, Peking, 92p.
Wang ML,Chen CY, Tonnis B, Barkley NA, Pinnow DL, Pittman RN, Davis J, Holbrook CC, Stalker HT and Pederson GA (2013) Oil, fatty acid, flavonoid, and resveratrol content variability and FAD2A functional SNP genotypes in the U.S. peanut mini-core collection. Journal of Agriculture and Food Chemistry 61:2875-82.
Wang ML, Gillaspie AG, Morris JB, Pittman RN, Davis J and Pederson GA (2008) Flavonoid content in different legume germplasm seeds quantified by HPLC. Plant Genetic Resources 6:62-69.
Wang Y, Han YP, Zhao X, Li YG, Teng WL, Li DM, Zhan Y and Li WB (2015) Mapping isoflavone QTL with main, epistatic and QTL × Environment effects in recombinant inbred lines of soybean. PLOS ONE 10:
e0118447.
Wei XY, Liu L F, Cui S L, Chen HY and Zhang JJ (2011) Development of EST-SSR markers in peanut (Arachis hypogaea L.). Frontier Agriculture
of China 5: 268-273.
Yoav Shem-Tov, Hana B, Aharon S, Ilan H, Shmuel G and Ran H (2012) Determination of total polyphenol, flavonoid and anthocyanin contents and antioxidant capacities of skins from peanut (Arachis
hypogaea) lines with different skin colors. Journal of Food
Biochemistry 36:301-308.
Zhang MW, Zhang RF, Zhang FX and Liu RH (2010) Phenolic profiles and antioxidant activity of black rice bran of different commercially available varieties. Journal of Agriculture and Food Chemistry 58: