Genetic characterization of cassava (
Manihot esculenta
) landraces
in Brazil assessed with simple sequence repeats
Marcos V.B.M. Siqueira, Jurema R. Queiroz-Silva, Eduardo A. Bressan, Aline Borges,
Kayo J.C. Pereira, José G. Pinto and Elizabeth Ann Veasey
Departamento de Genética, Escola Superior de Agricultura “Luiz de Queiroz”,
Universidade de São Paulo, Piracicaba, SP, Brazil.
Abstract
Based on nine microsatellite loci, the aim of this study was to appraise the genetic diversity of 42 cassava (Manihot esculenta) landraces from selected regions in Brazil, and examine how this variety is distributed according to origin in several municipalities in the states of Minas Gerais, São Paulo, Mato Grosso do Sul, Amazonas and Mato Grosso. High diversity values were found among the five above-mentioned regions, with 3.3 alleles per locus on an average, a high percentage of polymorphic loci varying from 88.8% to 100%, an average of 0.265 for observed heterozygosity and 0.570 for gene diversity. Most genetic diversity was concentrated within the regions themselves (HS= 0.52). Cluster analysis and principal component based scatter plotting showed greater similarity among landraces from São Paulo, Mato Grosso do Sul and Amazonas, whereas those from Minas Gerais were clustered into a sub-group within this group. The plants from Mato Grosso, mostly collected in the municipality of General Carneiro, provided the highest differentiation. The migration of human populations is one among the possible reasons for this closer resem-blance or greater disparity among plants from the various regions.
Key words:genetic diversity, microsatellites, SSR markers, traditional farming.
Received: April 25, 2008; Accepted: August 26, 2008.
Introduction
Traditional or slash-and-burn farming is a system with characteristics related to the pre-colonial period, and which is preserved by both indigenous and other popula-tions that employ techniques transmitted culturally by their ancestors (Faraldoet al., 2000). The basic evolutionary unit of traditional farming, the “swidden field”, is where bothin situconservation of landraces from many species of eco-nomic importance and genetic amplification of diversity occur, with subsequent benefits to the farmer (Martins, 1994, 2001; Peroni and Martins, 2000; Sambatti et al., 2001). The terms landrace, ethno-variety and folk or local variety define plant populations which are ecologically or geographically distinct, and are differentiated in their inter-nal genetic composition, as a result of local selection by tra-ditional farmers (Brown, 1978). Tratra-ditional agro-systems are of particular interest as they usually represent high crop diversity. It is common to find numerous varieties in the same field (Eliaset al., 2000). Some of these species have received attention by researchers through the focus on ge-netic characterization, for example sweet potato (Veaseyet
al., 2007, 2008), yam (Malapaet al., 2005), taro (Jianchuet al., 2001), maize (Louetteet al., 1997), bananas (Cresteet al., 2003), and most important of all, cassava (Sambattiet al., 2000; Mühlenet al., 2000; Faraldoet al., 2000; Peroni, 2007).
Cassava (Manihot esculentaCrantz), known in Brazil as “mandioca”, “macaxeira” or “aipim”, is the main crop cultivated in traditional farming systems in Brazil, as well as other areas in tropical America (Martins, 1994). It is an important subsistence crop for many communities with flexible planting and harvest times (Mkumbiraet al., 2003). Represented by a high number of varieties, cassava stands out as a suitable model for analyzing the inter-relationship between societies, genetic resources and ecological condi-tions. Studies concerning cassava diversity are scarce when compared with the great ethnical and territorial diversity of the populations that growM. esculenta. Socio-cultural con-texts, as well as economic and ecological processes, exert an influence on the management of this crop with variable intensity. The high diversity observed in those traditional populations that cultivate cassava reflects a pre- and post-colonial history, consisting of migrations, inter-ethnic con-tacts and economic pressures (Emperaireet al., 2001).
In order to understand the important role of tradi-tional farmers in maintaining and even amplifying genetic Send correspondence to E.A. Veasey. Departamento de Genética,
diversity in cassava landraces in Brazil and other countries, various studies have been undertaken with isozyme mark-ers (Sambattiet al., 2000; Faraldoet al., 2000; Cabralet al., 2002; Resendeet al., 2004), randomly amplified polymor-phic DNA (RAPD) markers (Colomboet al., 1998; Car-valho and Schaal, 2001; Zacariaset al., 2004), and micro-satellites or simple sequence repeats (SSR) (Mühlenet al., 2000; Carvalho and Schaal, 2001; Peroni, 2007), the latter being an appropriate marker for the detection of genetic polymorphisms, widely used to characterize genetic diver-sity in traditional crops (Mühlenet al., 2000; Fregeneet al., 2003; Eliaset al., 2004; Veaseyet al., 2008).
In order to assess the genetic diversity of local variet-ies in farmers’ homesteads and their distribution through-out different regions in Brazil, as a means of devising better conservation approaches and identifying progenitors with a wide genetic base for breeding, 42 landraces were evalu-ated with nine SSR markers. The plants were divided into five groups according to geographic origin: MG - Minas Gerais; SP São Paulo; MS Mato Grosso do Sul; AM -Amazonas; and MT - Mato Grosso. Certain groups, such as MS and MT, were either not represented or poorly so in the previous studies mentioned above. Thus, further informa-tion should be propitious concerning the genetic diversity of cassava in these regions.
Materials and Methods
Plant material
A total of 42 landraces from the cassava germplasm bank of the Genetics Department of ESALQ/USP, Pira-cicaba, SP, were assessed according to their geographical origin, with the aim of obtaining a representative sample from different parts of Brazil. These plants were collected from homesteads undertaking traditional farming methods, in several municipalities in five regions of Brazil, and were classified into five groups, according to their place of origin: MG municipality of Frutal, Minas Gerais State; SP -municipalities of Eldorado, Cananéia and Ilha Comprida, in the Vale do Ribeira, São Paulo State; MS - municipalities of Sonora, Pedro Gomes, Rio Verde de Mato Grosso, Costa Rica, Cassilândia, Paranaíba and Inocência, Mato Grosso do Sul State; AM - municipalities of Uarini, Maraã and Alvarães, in the Mamirauá and Amanã Sustainable Devel-opment Reserves, Amazonas State; and MT - municipality of General Carneiro, Mato Grosso State (Figure 1; Table 1).
DNA extraction and quantification
DNA was extracted from recently expanded young leaves of each accession and then dehydrated for 72 h at 60 °C by using a modified CTAB method (Elias et al., 2004). Fifty milligrams of ground powder were transferred to a 1.5 mL micro-tube containing 800mL of CTAB
extrac-tion buffer [30 mM EDTA pH 8.0, 0.1 M Tris-HCL pH 8.0, 1.2 M NaCl, 3% CTAB, plus 1% 2-mercaptoethanol added
just before use]. After incubation at 65 °C for 1 h, 500mL of
chloroform-isoamylalcohol (24:1) were added and the mix-ture subsequently centrifuged at 8,000 rpm for 10 min. This step was repeated once again. The supernatant (400 mL)
was then transferred to a fresh tube with 350mL of -20 °C
isopropanol and stored at -4 °C for 1 h, whereupon it was once more centrifuged at 8,000 rpm for 10 min. After dry-ing, 200mL of TE buffer (10 mM Tris-HCl pH 8.0, 1 mM
EDTA) and 4mL RNAse (10 mg/mL) were added to each
tube. The DNA was quantified in 4% polyacrylamide gel electrophoresis by using the silver nitrate staining tech-nique (Bassamet al., 1991), so as to visualize the DNA bands in the gels.
Microsatellite amplification
The amplification reaction was run on a total volume of 10.2 mL, consisting of 0.2 mL of Taq Polymerase
(5 U/mL); 1.0mL 10x Buffer ; 1.0mL MgCl2(50 mM);
0.5mL of each primer (F/R) (5pmoles/mL); 1.0mL dNTP
(2.5 mM of each deoxyribonucleotide); 3.0 mL Milli-Q
H2O and 3.0mL DNA (5 ng). Based on previous studies
were stained with silver nitrate (Bassamet al., 1991) and photo-documented.
Statistical analyses
Genetic diversity parameters, such as the number of alleles per locus, allelic frequency, percent of polymorphic loci, observed average heterozigosity and gene diversity (expected heterozygosity) obtained per locus and per group of accessions, were estimated using GDA software (Lewis and Zaykin, 2000). Allelic frequencies and Nei (1973) ge-netic diversity parameters were estimated with FSTAT software (Goudet, 2001).
Cluster analysis with the 42 landraces was performed with NTSYS software, by using binary data whereby al-leles were transformed into the presence or absence of an SSR band, as well as with the Jaccard similarity coefficient and UPGMA (Unweighted Pair Group Method with an Arithmetic Mean) method. A principal component analysis with binary data was also carried out using the SAS (1999) program, BioStat 4.0 software (Ayreset al., 2005) provid-ing a scatter plot.
Results
A total of 46 alleles were amplified with nine SSR loci analyzed in the 42 landraces, the number of alleles ob-served per locus varying from 3 to 6 alleles (Table 2). The number of alleles per polymorphic locus in the five cassava groups varied from 2.1 to 3.8, with an average of 3.3 (Table 3). Specific alleles were detected in the MS, MT and SP groups. Some of these alleles were considered to be rare (0.050 frequency), such as alleles 3 and 5 for GA-5 in the MS group and allele 3 for GA-126 in that of MT.
The groups MS, AM and MT revealed 100% poly-morphism, while those of MG and SP presented 88.8%. The observed heterozygosity, 0.265 on an average, varied from 0.233 to 0.288, while higher values, varying from 0.427 to 0.677, were estimated for gene diversity, with an average of 0.570.
According to Nei diversity indices (Nei, 1973), high total diversity (HT= 0.635) was observed in all the 42
cas-sava landraces, thus confirming the high variability which can be found in this cross-pollinated and vegetatively
prop-Code Municipality
(community), State
Folk name
Classi-fication
Group MG
MG1 Frutal (Aparecida de Minas), MG -1 Sweet
MG2 Frutal (Aparecida de Minas), MG - Sweet
MG3 Frutal (Boa Esperança), MG - Sweet
MG4 Frutal (Boa Esperança), MG - Sweet
MG5 Frutal (Aparecida de Minas), MG - Sweet
Group SP
SP1 Eldorado, SP Mandioca roxa
-SP2 Cananéia (Agrossolar), SP Aipim 5 min Sweet
SP3 Cananéia (Rio Branco), SP Mandioca amarela Sweet
SP4 Cananéia (Rio Branco), SP Mandioca roxa Sweet
SP5 Cananéia (Rio Branco), SP Mandioca branca Sweet
SP6 Cananéia (Porto Cubatão), SP Mandioca manteira Sweet
SP7 Ilha Comprida (Pedrinhas), SP Branca Bitter
Group MS
MS1 Sonora, MS Vassourinha Bitter
MS2 Sonora, MS Macaxeira Sweet
MS3 Pedro Gomes, MS -
-MS4 Pedro Gomes, MS Amarela
-MS5 Rio Verde de MT, MS Amarela manteiga
-MS6 Rio Verde de MT, MS Macaxeira Sweet
MS7 Costa Rica, MS -
-MS8 Cassilândia, MS Amarela
-MS9 Paranaíba, MS -
-MS10 Inocência, MS Vassoura amarela
-Code Municipality
(community), State
Folk name
Classi-fication
Group AM
AM 1 Uarini (Aiucá), AM Pelonha Bitter
AM 2 Maraã (Monte Sinai), AM Tambaqui Sweet
AM 3 Maraã, (Boa Esperança), AM Leônico Bitter
AM 4 Maraã (Boa Esperança), AM Caboclinha Sweet
AM 5 Maraã (S. Paulo do Coraci), AM Tartarugão Bitter
AM 6 Maraã (Calafate), AM Catombo Bitter
AM 7 Uarini (Aiucá), AM Valdivina Bitter
AM 8 Alvarães (Jarauá), AM Brasileirinha Sweet
AM 9 Maraã (Nova Samaria), AM Bodozinho Bitter
AM 10 Uarini (Marirana), AM Sem nome Bitter
Group MT
MT1 G. Carneiro, Household 1, MT Da praia
-MT2 G. Carneiro, Household 2, MT Castelão Sweet
MT3 G. Carneiro, Household 2, MT Pracati Bitter
MT4 G. Carneiro, Household 3, MT Cenoura Sweet
MT5 G. Carneiro, Household 4, MT Cacau Sweet
MT6 G. Carneiro, Household 4, MT Menina Sweet
MT7 G. Carneiro, Household 5, MT Mucuruna Bitter
MT8 G.Carneiro, Household 5, MT Matrinxã Sweet
MT9 G. Carneiro, Household 3, MT Engana vizinho Sweet
MT10 G. Carneiro, Household 4, MT Paraguainha Bitter
agated crop. However, most of this SSR variability was concentrated within ethno-variety groups (HS = 0.552),
while lower values were due to the proportion of diversity distributed among the groups themselves (GST’ = 0.131)
(Table 4).
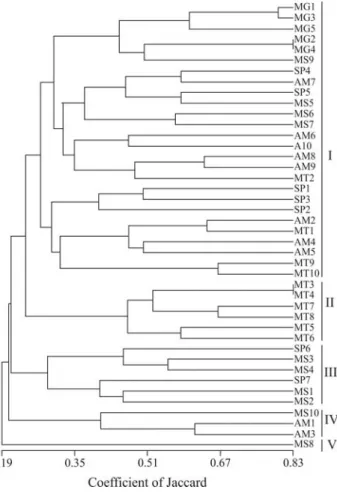
The dendrogram in Figure 2 shows the high genetic variability of landraces, this varying from 0.19 to 0.83 in the Jaccard similarity coefficient. Five groups were defined through cluster analysis. Landraces from all the five re-gions were classified in the first of these, the five accessions from Frutal (MG) being gathered into a small sub-group of this larger one. As to clustering in the other four groups, landraces only from General Carneiro (MT) were classified in the second group, four from Sonora and Pedro Gomes
(MS), and two, one from Cananéia and the other from Ilha Comprida (SP) in the third, two from the Amazon region plus one from Inocência (MS) in the fourth and finally, only one single specimen from Cassilândia (MS) in the fifth.
Similar results were observed through principal com-ponent analysis when examining the distribution of the five groups in the four quadrants of a scatter plot compounded with the two principal components, and which explained Table 2- Primer sequences (forward/reserve) used in SSR analyses and their respective size- range (bp)1, annealing temperature (T
a), number of alleles per locus (A), observed heterozygosity (Ho) and expected heterozygosity (He).
Microsatellite name1 5’ to 3’ Primer sequence Size-range (bp)2 T
a(ºC) A Ho He
GA-5 TAATGTCATCGTCGGCTTCG
GCTGATAGCACAGAACACAG
120-130 60 5 0.405 0.459
GA-12 GATTCCTCTAGCAGTTAAGC
CGATGATGCTCTTCGGAGGG
140-150 57 5 0.167 0.752
GA-21 GGCTTCATCATGGAAAAACC
CAATGCTTTACGGAAGAGCC
110-120 62 3 0.190 0.615
GA-126 AGTGGAAATAAGCCATGTGATG
CCCATAATTGATGCCAGGTT
170-210 57 6 0.500 0.784
GA-127 CTCTAGCTATGGATTAGATCT
GTAGCTTCGAGTCGTGGGAGA
210-235 59 6 0.262 0.773
GA-131 TTCCAGAAAGACTTCCGTTCA
CTCAACTACTGCACTGCACTC
95-140 54 5 0.119 0.707
GA-134 ACAATGTCCCAATTGGAGGA
ACCATGGATAGAGCTCACCG
295-310 52 5 0.095 0.641
GA-136 CGTTGATAAAGTGGAAAGAGCA
ACTCCACTCCCGATGCTCGC
145-165 64 5 0.143 0.746
GA-140 TTCAAGGAAGCCTTCAGCTC
GAGCCACATCTACTCGACACC
150-165 62 5 0.476 0.684
Mean 5 0.262 0.684
1Chavarriaga-Aguirreet al.(1998). 2
Values obtained in this study, similar to those of Chavarriaga-Aguirreet al.(1998).
Table 3- Number of individuals analyzed (N), mean number of alleles per polymorphic locus (A), percentage of polymorphic loci (P), mean ob-served heterozygosity (Ho) and gene diversity (He) for five groups of cassava: MG Minas Gerais; SP São Paulo; MS Mato Grosso do Sul; AM -Amazonas; MT - Mato Grosso.
Mean heterozygosity
Groups N A P(%) Ho He
MG 5 2.11 88.88 0.288 0.427
SP 7 3.66 88.88 0.269 0.610
MS 10 3.77 100.00 0.255 0.677
AM 10 3.44 100.00 0.233 0.588
MT 10 3.44 100.00 0.277 0.550
Mean 8.40 3.28 95.55 0.265 0.570
Table 4- Nei (1973) genetic diversity parameters1for each locus and for the total evaluated loci considering five groups of cassava: MG - Minas Gerais; SP São Paulo; MS Mato Grosso do Sul; AM Amazonas; MT -Mato Grosso.
Loci HS HT DST GST
GA-5 0.450 0.453 0.003 0.006
GA-12 0.418 0.618 0.200 0.324
GA-21 0.316 0.574 0.258 0.450
GA-126 0.679 0.711 0.032 0.045
GA-127 0.632 0.737 0.105 0.142
GA-131 0.556 0.610 0.054 0.089
GA-134 0.577 0.616 0.039 0.063
GA-136 0.706 0.730 0.025 0.034
GA-140 0.637 0.668 0.031 0.047
Total 0.552 0.635 0.083 0.131
1
25.8% of total variation (data not shown), besides indicat-ing the high genetic variability of the material.
Discussion
In our study, high genetic diversity was detected in all the five regions in Brazil, with an average of 5.0 alleles per locus, which is in agreement to similar studies with cassava (Muhlenet al., 2000; Faraldoet al., 2000; Fregeneet al., 2003; Mkumbiraet al., 2003; Eliaset al.,2004; Lokkoet al., 2006). Peroniet al.(2007) evaluated 137 cassava speci-mens representing 58 landraces from Brazil, by using nine SSR loci, thereby reporting an average of 4.56 alleles per locus, this varying from 2 to 7 alleles. When analyzing 283 accessions from various countries with 67 SSR loci, Fre-geneet al.(2003) found an average of 5.02 alleles per locus for Brazilian landraces.
High gene diversity values of 0.570 on an average were also encountered in our study. By using SSR markers, gene diversity was found to be high in all the cluster groups of cassava analyzed by Lokkoet al.(2006), with an average of 0.447. When assessing 283 accessions of cassava
land-with 67 SSR loci. On the other hand, on studying 137 cas-sava plants from 58 landraces in Brazil, Peroni (Peroni N, PhD Thesis, UNICAMP, 2004) obtained the even higher value of 0.637 for average expected heterozygosity or gene diversity. All these values are high when compared to the average gene diversity for outcrossing species of 0.205, es-timated for all plant species, and 0.159 for dicots (Hamrick and Godt, 1997). These high values also substantiate both the cassava outcrossing breeding system, with multi-loci outcrossing rates estimated at 91.5% when using isozyme markers (Silvaet al., 2003), as well as its highly heterozy-gous nature due to its vegetative mode of reproduction. In French Guiana, Pujol et al. (2005) noted a positive correlationship between plant size and heterozygosity, thus concluding that during weeding farmers tended to elimi-nate the less vigorous plantlets, which in itself could ex-plain the higher levels of heterozygosity reported in the literature.
A larger portion of diversity in this study was found to be concentrated within the groups themselves (HS= 0.552)
on the contrary to group diversity (GST’= 0.131). Faraldoet
al. (2000), Mühlen et al. (2000) and Asante and Offei (2003) also observed that most morphological, isozymatic and molecular variability was concentrated within either the cassava ‘swidden’ fields cultivated by traditional farm-ers or geographic regions. Peroniet al.(2007), when using nine SSR loci to analyze 58 cassava landraces, arrived at similar results, thereby explaining that each farmer main-tains an appreciable representation of total diversity in his homestead, this diversity not being different from that of other farmers in the same region, and is due to material ex-change between relatives and neighbors. Lokko et al. (2006) also found that most gene diversity assessed with SSR markers was concentrated within cluster groups of cassava from Africa. The same pattern was observed with sweet potato landraces from the Vale do Ribeira, with greater genetic variability within swidden fields for both morphological (Veasey et al., 2007) and SSR markers (Veaseyet al., 2008).
In addition to measuring genetic diversity, one of the objectives in our study was to verify how landraces origi-nating from five different regions in Brazil were mutually related. Results showed a greater proximity of landraces from the states of São Paulo, Mato Grosso do Sul and Amazonas. Faraldoet al.(2000), on studying cassava land-races from three distinct groups (the Indigenous Park of Xingu, the Vale do Ribeira in São Paulo and the Amazon region), found greater likeness among landraces from São Paulo and the Amazon. Peroniet al.(2007) also identified greater genetic similarity among landraces from the Vale do Ribeira and those of the Rio Negro (Amazon). Accord-ing to these authors, the samples from São Paulo, repre-sented here by landraces from the Vale do Ribeira, may Figure 2- Dendrogram obtained with the Jaccard similarity coefficient
represent a “historical sample” of Amazonian cassava di-versity.
The landraces from Minas Gerais were clustered into a sub-group in the dendrogram (Figure 2), within a larger group of landraces from São Paulo, Mato Grosso do Sul and Amazonas. The landraces collected in Frutal, Minas Ge-rais, an area dominated by soybeans, pineapples, sugar and pasture dedicated to milk and beef production, were all cul-tivated in home-gardens and not in ‘swidden’ fields. These are known as sweet-varieties and are used for home-cooking. The origin of these landraces is apparently local, with plant material being exchanged among relatives, friends and neighbors and, according to the villagers, have been under cultivation in this area over a long period (An-gelo and Amorozo, 2006).
The most differentiated landraces were those from General Carneiro, Mato Grosso. In Mato Grosso, tradi-tional farming is undertaken by local populations, particu-larly by indians, “quilombolas” and “pantaneiros”. After the 50’s more recent settlers began coming from diverse re-gions of the country, mainly from the south, northeast, Goiás and Minas Gerais (Amorozo, 2000). General Car-neiro is an important area for settlement, the high genetic variability of cassava landraces being a consequence of the introduction of genetic material from the settler’s place of origin. This municipality presents certain peculiarities that may help to explain the differentiation of local landraces from those of other regions. More extensive modern farm-ing with soybean and cotton crops, predominant in other parts of the state, is a reality for farmers in this area. Infor-mation on modern cassava varieties and released by plant breeding institutes in Brazil (Instituto Agronômico - IAC, Embrapa) can easily reach local farmers through the radio and satellite television. However, due to economical and transport limitations, access to this material is very rare. Some local farmers reported impediments in obtaining new varieties for homestead planting, even of those from the same area, due to the difficulty and high cost in transporta-tion. Under local conditions, distances as short as 20 kilo-meters can constitute an isolation factor.
Both sweet and bitter varieties of cassava are grown by farmers in the States of São Paulo (Amorozo, 2000) and Mato Grosso do Sul, substantial diversity of sweet varieties being encountered in the latter (Zatarin M and Valle TL, personal communication). Sweet varieties have a low level of cyanogenic glucoside content in their roots, whereas the bitter type presents more than 100 ppm fresh weight of cya-nide therein which must be detoxified before consumption (Valle et al., 2004). The Vale do Ribeira region, repre-sented by Cananéia, Ilha Comprida and Eldorado, is an area with a high diversity of species and varieties, especially cassava, and it is possible that Tupi-Guarani populations were the main disseminators of both cultivation techniques as well as of the species and varieties to be found there (Peroni N, PhD Thesis, UNICAMP, 2004). It is possible
that the greater similarity among landraces from São Paulo and Mato Grosso do Sul can be traced back to migrating populations coming from southern Amazonia, bringing va-rieties which were introduced into the Vale do Ribeira together with their traditional cultivation techniques (Scha-den, 1974). Some cassava varieties were probably carried along with Tupi-Guarani indians migrating from São Paulo to communities in Mato Grosso do Sul (Ladeira MI, PhD Thesis, USP, 2001). Thus, these could be some of the fac-tors contributing to an explanation of the proximity of land-races from São Paulo with those collected in the cerrado ecosystem of Mato Grosso do Sul and the tropical Amazon Forest.
In this study we intended to contribute to a better knowledge of cassava genetic diversity and distribution within and among different regions in Brazil, and promote in situconservation by traditional farmers, also known as on farm in situconservation, of an important genetic and autochthon resource.
Acknowledgments
This study was supported by scholarships provided by FAPESP and CNPq. The authors wish to thank MSc Gercina Aparecida Angelo, a graduate student from UNESP, Rio Claro, and Dr. Teresa Losada Valle, from Instituto Agronômico (IAC), Campinas, for contributing part of the germplasm studied, and the anonymous review-ers for their relevant contributions.
References
Amorozo MCM (2000) Management and conservation of
Manihot esculentaCrantz germplasm by traditional farmers in Santo Antonio do Leverger, Mato Grosso State, Brazil. Etnoecologica 4:69-83.
Angelo GA and Amorozo MCM (2006) Diversidade de tubér-culos alimentícios em povoados rurais no Município de Frutal, Minas Gerais, Brasil. In: Albuquerque UP, Marins JFA and Almeida CFCBR (eds) Tópicos em Conservação e Etnobotânica de Plantas Alimentícias. NUPEEA, Recife, pp 119-140.
Asante IK and Offei SK (2003) RAPD-based genetic diversity study of fifty cassava (Manihot esculenta Crantz) geno-types. Euphytica 131:113-119.
Ayres M, Ayres Jr M, Ayres DL and Santos AAS (2005) BioEstat 4.0: Aplicações estatísticas nas áreas das ciências biológicas e médicas. 4th edition. Sociedade Civil Mamirauá, Belém. Bassam BJ, Caetano-Anolles G and Gresshoff PM (1991) Fast
and sensitive silver staining of DNA in polyacrylamide gels. Anal Biochem 196:80-83.
Brown AHD (1978) Isozymes, plant population genetic structure and genetic conservation. Theor Appl Genet 52:145-157. Cabral BLR, Souza JAB, Ando A, Veasey EA and Cardoso ER
(2002) Isoenzymatic variability of cassava accessions from different regions in Brazil. Sci Agric 59:521-527.
satellites in cassava (Manihot esculentaCrantz): Discovery, inheritance and variability. Theor Appl Genet 97:493-501. Colombo C, Second G, Valle TL and Charrier A (1998) Genetic
diver-sity characterization of cassava cultivars (Manihot esculenta
Crantz). I. RAPD markers. Genet Mol Biol 21:105-113. Creste S, Neto AT, Silva SO and Figueira A (2003) Genetic
char-acterization of banana cultivars (Musaspp.) from Brazil us-ing microsatellite markers. Euphytica 132:259-268. Elias M, Panaud O and Robert T (2000) Assessment of genetic
vari-ability in a traditional cassava (Manihot esculenta Crantz) farming system, using AFLP markers. Heredity 85:219-230. Elias M, Mühlen GS, McKey D, Roa AC and Tohme J (2004)
Ge-netic diversity of traditional South American landraces of cassava (Manihot esculentaCrantz): An analysis using mi-crosatellites. Econ Bot 58:242-256.
Emperaire L, Pinton F and Second G (2001) Dinámica y manejo de la diversidad de las variedades de yuca del noroccidente amazónico (Brasil). Etnoecológica 5:38-59 (Abstract in En-glish).
Faraldo MIF, Silva MR, Ando A and Martins PS (2000) Varia-bilidade genética de etnovariedades de mandioca em regiões geográficas do Brasil. Sci Agric 57:499-505 (Abstract in English).
Fregene M, Suarez M, Mkumbira J, Kulembeka H, Ndedya E, Kulaya A, Mitchel S, Gullberg U, Rosling H, Dixon A,et al. (2003) Simple sequence repeat marker diversity in cassava landraces: Genetic diversity and differentiation in an asexu-ally propagated crop. Theor Appl Genet 107:1083-1093. Goudet J (2001) FSTAT, v. 1.2: A computer program to calculate
F-statistics. Heredity 86:485-486.
Hamrick JL and Godt MJW (1997) Allozyme diversity in culti-vated crop. Crop Sci 37:26-30.
Jianchu X, Yongping Y, Yingdong P, Ayad WG and Eyzaguirre PB (2001) Genetic diversity in taro (Colocasia esculenta
Schott, Araceae) in China: An ethnobotanical and genetic approach. Econ Bot 55:14-31.
Lokko Y, Dixon A, Offei S, Danquah E and Fregene M (2006) As-sessment of genetic diversity among African cassava
Manihot esculentaCrantz accessions resistant to the cassava mosaic virus disease using SSR markers. Genet Resour Crop Evol 53:1441-1453.
Louette D, Charrier A and Berthaud J (1997)In situconservation of maize in Mexico, genetic diversity and maize seed man-agement in a traditional community. Econ Bot 51:20-39. Malapa R, Arnau G, Noyer JL and Lebot V (2005) Genetic
diver-sity of the greater yam (Dioscorea alataL.) and relatedness toD. nummulariaLam. andD. transversaBr. as revealed with AFLP markers. Genet Resour Crop Evol 52:919-929. Martins PS (1994) Biodiversity and agriculture: Patterns of
do-mestication of Brazilian native plants species. An Acad Bras Cienc 66:219-224.
Martins PS (2001) Dinâmica evolutiva em roças de caboclos amazônicos. In: Vieira ICG, Silva JMC, Oren DC and D’In-cao MA (eds) Diversidade Biológica e Cultura da Amazô-nia. Goeldi Editoração, Belém, pp 369-384 (Abstract in English).
Mkumbira J, Chiwona-Karltun L, Langercrantz U, Mahungu N, Saka J, Mhone A, Bokanga M, Brimer L, Gullberg U and Rosling H (2003) Classification of cassava into ‘bitter’ and ‘cool’ in Malawi: From farmers’ perception to characteriza-tion by molecular markers. Euphytica 132:7-12.
Mühlen GS, Martins PS and Ando A (2000) Variabilidade gené-tica de etnovariedades de mandioca, avaliada por marca-dores de DNA. Sci Agric 57:319-328 (Abstract in English).
Peroni N (2007) Manejo e domesticação de mandioca por caiçaras da Mata Atlântica e ribeirinhos da Amazônia. In: Boef WS, Thijssen MH, Ogliari JB and Sthapit BR (eds) Biodiver-sidade e Agricultores: Fortalecendo o Manejo Comunitário, v. 1. Porto L&PM, Porto Alegre, pp 234-242.
Peroni N and Martins PS (2000) Influência da dinâmica agrícola itinerante na geração de diversidade de etnovariedades culti-vadas vegetativamente. Interciencia 25:22-29 (Abstract in English).
Peroni N, Kageyama PY and Begossi A (2007) Molecular differ-entiation, diversity, and folk classification of ‘‘sweet’’ and ‘‘bitter’’ cassava (Manihot esculenta) in Caiçara and Cabo-clo management systems (Brazil). Genet Resour Crop Evol 54:1333-1349.
Pujol B, Gigot G, Laurent G, Pinheiro-Kluppel M, Elias M, McKey HM and McKey D (2005) Germination ecology of cassava (Manihot esculentaCrantz, Euphorbiaceae) in tradi-tional agroecosystems: Seed and seedling biology of a vege-tatively propagated domesticated plant. Econ Bot 56:366-379.
Resende AG, Filho PSV and Machado MFPS (2004) Esterase polymorphism marking cultivars of Manihot esculenta, Crantz. Braz Arch Biol Technol 47:347-353.
Sambatti JBM, Martins PS and Ando A (2000) Distribuição da diversidade isoenzimática e morfológica da mandioca na agricultura autóctone de Ubatuba. Sci Agric 57:75-80 (Ab-stract in English).
Sambatti JBM, Martins PS and Ando A (2001) Folk taxonomy and evolutionary dynamics of cassava: A case study in Ubatuba, Brazil. Econ Bot 55:93-105.
SAS (1999) The SAS System for Windows. Software, Release 8.2 TS Level02MO. SAS Institute Inc., Cary, NC.
Schaden E (1974) Aspectos Fundamentais da Cultura Guarani. 3rd edition. E.P.U/EDUSP, São Paulo, 190 pp.
Silva RM, Bandel G and Martins PS (2003) Mating system in an experimental garden composed of cassava (Manihot esculentaCrantz) ethnovarieties. Euphytica 134:127-135. Valle TL, Carvalho CRL, Ramos MTB, Mühlen GS and Villela
OV (2004) Conteúdo cianogênico em progênies de mandio-ca originadas do cruzamento de variedades mansas e bravas. Bragantia 63:221-226 (Abstract in English).
Veasey EA, Silva JRQ, Rosa MS, Borges A, Bressan EA and Peroni N (2007) Phenology and morphological diversity of sweet potato (Ipomoea batatas) landraces of the Vale do Ribeira. Sci Agric 64:416-427.
Veasey EA, Borges A, Rosa MS, Queiroz-Silva JR, Bressan EA and Peroni N (2008) Genetic diversity assessed with micro-satellites in Brazilian sweetpotato (Ipomoea batatas (L.) Lam) landraces. Genet Mol Biol 31:725-733.
Zacarias AM, Botha AM, Labuschagne MT and Benesi IRM (2004) Characterization and genetic distance analysis of cas-sava (Manihot esculentaCrantz) germplasm from Mozam-bique using RAPD fingerprinting. Euphytica 138:49-53.
Internet Resource
Lewis PO and Zaykin D (2000) Genetic data analysis: Computer program for the analysis of allelic data, v. 1.0 (d15). http://alleyn.eeb.uconn.edu/gda (25 April 2003).
Associate Editor: Everaldo Gonçalves de Barros