ABSTRACT Quantitative approach study with the aim of building an evaluative baseline of the management capacity of Epidemiological Surveillance in the state of Bahia, Brazil. The primary data were obtained through online questionnaire, and the secondary data through document analysis, being considered three dimensions of analysis: organizational, operation-al and sustainability of the results. It was concluded that the decentroperation-alized management of the Epidemiological Surveillance is unable to sustain the results obtained in relation to the health indicators of the population, being necessary the sharing of the decision-making process and a planning oriented by local priorities.
KEYWORDS Health management. Evaluation. Epidemiological Surveillance.
RESUMO Estudo de abordagem quantitativa com objetivo de construir uma linha de base avali-ativa da capacidade de gestão da Vigilância Epidemiológica do estado da Bahia, Brasil. Os da-dos primários foram obtida-dos através de questionário on-line, e os dada-dos secundários através de análise documental, sendo consideradas três dimensões de análise: organizacional, operacio-nal e da sustentabilidade dos resultados. Conclui-se que a gestão descentralizada da Vigilância Epidemiológica no estado da Bahia não é capaz de sustentar os resultados obtidos em relação aos indicadores de saúde da população, sendo necessários o compartilhamento do processo decisório e um planejamento orientado pelas prioridades locais.
PALAVRAS-CHAVE Gestão em saúde. Avaliação. Vigilância Epidemiológica.
Baseline evaluation study about the
decentralized management capacity of the
Epidemiological Surveillance
Estudo de linha de base avaliativa sobre capacidade de gestão
descentralizada da Vigilância Epidemiológica
Silvone Santa Bárbara da Silva Santos1, Cristina Maria Meira de Melo2, André Renê Barboni3, Carlos Antonio de Souza Teles Santos4, Alexandro Gesner Gomes dos Santos5
1 Universidade Estadual de
Feira de Santana (UEFS), Departamento de Saúde (DSAU) – Feira de Santana (BA), Brasil.
silvone.santabarbara@ gmail.com
2 Universidade Federal da
Bahia (UFBA), Escola de Enfermagem – Salvador (BA), Brasil.
3 Universidade Estadual
de Feira de Santana (UEFS), Departamento de Saúde (DSAU), Centro de Referência de Informação em Saúde (Cris) – Feira de Santana (BA), Brasil. [email protected]
4 Universidade Estadual de
Feira de Santana (UEFS), Departamento de Ciências Exatas (Dexa) – Feira de Santana (BA), Brasil. [email protected]
5 Secretaria Municipal
Introduction
The objective of this study was to construct a baseline evaluation of the decentralized management capacity of the Epidemiological Surveillance (ES) of the state of Bahia. In this, it is assumed that decentralization is a process in which each sphere of government, in an articulated manner and with decision-making power, is responsible for conducting health policy, in order to guarantee the inte-grality of attention and popular participation in the formulation, in the implementation, control and evaluation of public policies1-6.
It is understood that, in the decentral-ization of the ES regarding municipalities, rather than defining it as one of the priorities of government, it is necessary to contemplate the effective transfer of power and resources to the municipal body, which, in turn, must reveal ability to govern. This translates into the capacity to generate and control actions, in order to produce results according to the content of the government project and to maintain the governability of the system7,8.
Adopting the government conception of Matus and Guimarães et al.6-9, in this study, the capacity of the decentralized management of the ES is revealed through the capacity of the actors to mobilize available resources and/ or to seek new resources, whether normative, material, relational, information and technical, as well as from the position (power) that these actors occupy to negotiate with others, with the objective of developing actions that implies im-proving the health indicators of the population and the sustainability of results. Management capacity is revealed through three dimensions: organizational (ability to decide); operational (ability to execute); and sustainability (ability to build and maintain partnerships and alliances).
Methods
This is a cropping of the doctoral thesis entitled ‘Evaluation of the Decentralized
Management Capacity of Epidemiological Surveillance in the State of Bahia’6. The present article details the methodology used to con-struct the evaluative baseline and the results achieved. The loci of investigation were mu-nicipalities of the state of Bahia, in a sample per cluster, being considered as primary clusters the macro-regions and as secondary clusters the municipalities, taking as reference the Regionalization Master Plan10, which contem-plates nine macro-regions. The municipalities were selected for the construction of the evalu-ative baseline according to the following cri-teria: municipality reference macro-regional; micro-regional municipality not included in the previous criterion; municipality headquar-ters of the Regional Health Board (Dires) not included in the previous criteria; municipality with full management of the health system not included in the previous criteria.
Adopting these criteria, the largest number of municipalities, 12, was concen-trated in the Eastern Macro-region. As an additional criterion for all clusters to have the same number of municipalities, those excluded from the previous criteria were selected and obtained a percentage equal to or greater than 70% of timely closure in epidemiological investigations, in 2007. For this last criterion, it was necessary to make a draw, as some macro-regions exceeded the necessary number of municipalities to com-plete the clusters6.
On the other hand, even with this addi-tional criterion, in the three macro-regions (North, West and Northeast) the set of 12 municipalities established from the macro-region with the largest number of munici-palities selected to compose the cluster were not formed, being, then, included those municipalities whose percentage of timely closing in the epidemiological investigations approached 70%. In this situation, three mu-nicipalities were added, one in each cluster, one with a timely closing percentage of 66.7% and two municipalities with 60%. Therefore, the initial sample for the construction of the
evaluative baseline was in 108 municipali-ties. For the construction of the evaluative baseline, an online questionnaire was sent to the 108 managers of the municipal ESs, and responses were obtained from 38 of them6.
The questionnaire was made avail-able by the institutional website of the Epidemiological Surveillance Board (Divep). Each manager of the ES received a pass-word to access the questionnaire, ensuring, thus, the confidentiality of the information. Attached, it followed the Informed Consent Form (ICF). According to the recommenda-tion of the Narecommenda-tional Research Council, data collection began only after the approval of the project by the Ethics Committee, under the Opinion n° 350/2009 of the Research Ethics Committee of the State of Bahia (CEP-Sesab), being protected the names of the municipalities.
The indicators plan for the construction of the evaluative baseline contemplated the following variables, according to the analysis dimensions:
ORGANIZATIONAL DIMENSION: A1. competences and abilities of the manager [Does the ES manager have training in the area? Does the ES manager have at least experience of two years in management ac-tivities? Does the municipality have mobi-lization committees? Which are? Does the ES manager participate in meetings with the mobilization committee?]; A2. decision-making process [Does the manager imple-ment the actions in accordance with the guidelines defined in the Municipal Health Plan and in the Municipal Health Agenda? Does the manager observe the goals agreed in the Program of Health Surveillance Actions (PAVS) and in the Pact for Life?]; A3. social control [Are Municipal Health Council (MHC) meetings held monthly? Do the board members participate in the prepa-ration of ES plans and projects?]; A4. formal mechanisms of communication [Are there mechanisms or protocols that define the flow of information? Which ones are they? Is the
protocol known to network professionals?]; A5. managers who report knowing the goals contained in the PAVS and the Pact for Life [Does the ES manager know the goals of the PAVS and the Pact for Life? Is this informa-tion shared among health workers, MHC, and other segments of civil society?]; A6. popula-tion registered by the Family Health Strategy (FHS) [Does the municipality have 100% of the population registered by the FHS?].
OPERATIONAL DIMENSION: B1. opera-tional resources [Does the municipality have a minimum structure to carry out ES activi-ties?]; B2. management of people [What are the arrangements for hiring people? How many employees of the ES are from the ef-fective staff of the ES?]; B3. systematic mechanisms of continuing education [How many and what were the qualifications that ES workers received during the year?]; B4. technical capacity to develop ES actions [Do ES workers adequately investigate and timely close reported cases? What is the tet-ravalent vaccine coverage in children under 1 year?]; B5. monitoring and evaluation of the Notification of Injury Information System (Sinan) [Are the informations generated by Sinan carried out? What is the periodicity of such evaluations?]; B6. decentralization of the ES for Family Health Teams (EqSF) [Do EqSF develop ES actions? How many EqSF develop ES actions? What are the actions that the EqSF develop?].
management?]; C5. formulation of plans and projects [Is there any plan and/or project under development, approval or execution?]; C6. revenue applied for health [What is the proportion of own revenue of the municipal-ity applied in health?].
For the analysis of the quantitative indi-cators, the standardized global index was constructed, which resulted from the com-bination (arithmetic mean) of standardized scores of index 0 (obtained through second-ary data) and index 1 (resulting from the indicators defined for each capacity dimen-sion of the ES management, that is, the op-erational, organizational and sustainability dimensions).
Index 1 was generated by the proportion of the affirmative answers given by manag-ers to each of the dimensions. Subsequently, the indicators were standardized, in z-score, to be on the same scale as index 0, which was generated by the combination of some municipal health indicators. Thus, for each municipality, a standard score was assigned to the organizational, operational, sustain-ability and health indicators. Therefore, the standardized index 1 corresponds to the arithmetic mean of the three indicators and the index 0.
The global index was categorized through quartiles, resulting in four categories defined as: very bad, bad, regular and good. This same categorization was also applied to index 0, in order to group the municipali-ties in the different categories (very bad, bad, regular and good).
It is presented, below, the syntax, de-veloped in the SPSSWin software, for the estimation of the indices, which were con-structed based on the secondary data of the
sampled and non-sampled municipalities. Index 0 represents the index generated from the secondary data, and index 1 represents the general index (the combination of index 0 with the indicators of organizational, oper-ational, and sustainability dimensions). Both indices were generated by standardization in z-scores, resulting from the application of the arithmetic mean.
Index0=MEAN (Zpop, Zlbirths, Zproperties, Zphealth, Zplweight, Zpvaccine, Zpcnd, Zptvvaccine, Zprevenue, Zsinan, Zpleprosys, Zpdcauses, Zpcure_tub).
Index1=MEAN (Zpop, Zlbirths, Zproperties, Zphealth, Zplweight, Zpvvaccine, Zpcnd, Zptvvaccine, Zsinan, Zpleprosy, Zpdcauses, Zpcure_tub, ZORGANIZATIONAL, ZOPERATIONAL, ZSUSTAINABILITY).
Comparing the diagrams, it is observed that the magnitude of the proportion of live births has a distribution in the order of tens, which presented flattened in the first diagram. However, with standardization, the effect of the scale of the variables (variables with different scales) is removed, allowing the comparison, without distortion, between the indicators. In addition, standardization reduced data variability, leaving the distri-bution of indicator data more symmetrical.
The losses in relation to the sample of
municipalities initially established (n=108) were assumed to be random, after evaluating that there were no statistically significant differences between the municipalities that answered the questionnaire, denominated sampled municipalities (n1=38), and the group of municipalities that did not respond (n2=70), called non-sampled municipalities, when comparing the standardized global index, defined on the basis of the secondary data, as well as its components, in individual terms (table 1).
Figure 1. Variables of index 0 and standardized variables of index 0
84
200 4
150 2
100 0
50 -2
0 -4
Zscore (plbirths)
plbirths pproperties phealth plweight pvaccine Zscore (pproperties) Zscore (phealth) Zscore (pvaccine) 107
95
107 23 12
42 42
95
92
94 17
49 46 90 96
Source: Own elaboration
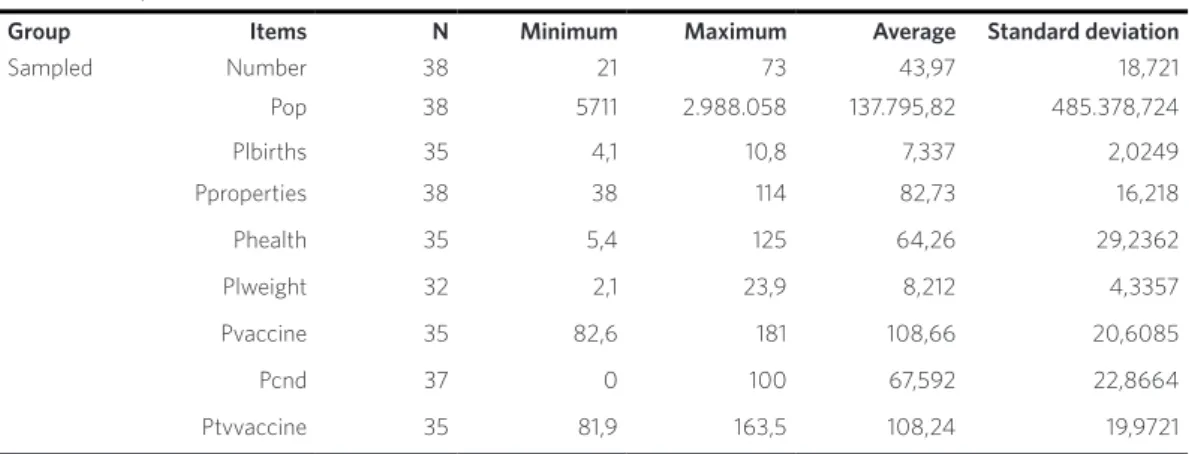
Table 1. Descriptive measures of the items studied for index 0
Group Items N Minimum Maximum Average Standard deviation
It was verified that there was no statisti-cally significant difference (p>0.05) of the studied variables between the sampled and non-sampled municipalities. In this way, it can be assumed that, possibly, the non-return of all questionnaires did not compro-mise the selection of municipalities cases.
Results and discussion
Of the 108 online questionnaires sent, a re-sponse was obtained from 38 managers of the municipal ES, corresponding to 35.2% of the total sample selected.
Although the initial selection was 12 mu-nicipalities per macro-region, the largest number of municipalities sampled was con-centrated in the Northeast Macro-region.
Notably in the central-eastern and eastern macro-regions, those with the most popu-lous municipalities, the questionnaires were returned to a lesser extent. However, the state capital, located in the Eastern Macro-region, as well as the second largest mu-nicipality in the state, which is part of the Central-East Macro-region, are among the municipalities sampled.
Social disparities in the state are re-flected in health indicators. The health problems of the population show the main-tenance and/or resurgence of diseases such as dengue, tuberculosis, leprosy, Acquired Immunodeficiency Syndrome (Aids), as well as the emergence of cardiovascular diseases, violence and mental disorders, and eleva-tion of chronic-degenerative diseases10. It is in this complex and unequal situation Table 1. (cont.)
Sampled Prevenue 21 7 27 17,91 4,133
Sinan 38 0 100 43,16 41,247
Pleprosy 32 43,8 100 81,156 16,8042 Pdcauses 38 60,6 100 84,568 10,2118 Pcure_tub 27 12 100 62,16 31,154 Not samples Number 70 21 73 47,61 19,084 Pop 70 6.455 318.904 47.910,47 59.985,681 Plbirths 67 2,3 10,6 7,051 1,9818 Pproperties 69 41 131 84,33 18,041 Phealth 64 7 145,3 68,861 28,4118 Plweight 60 2,4 50 8,93 7,8619 Pvaccine 67 54,3 133,9 101,14 14,9354 Pcnd 70 0 100 73,03 22,5503 Ptvvaccine 67 76,2 136,4 104,673 14,8562 Prevenue 30 3 24 17,49 4,004
Sinan 70 0 100 45,99 39,575
Pleprosy 53 33,3 100 82,611 20,0401 Pdcauses 69 39,1 100 78,071 16,1118 Pcure_tub 45 9 100 62,25 31,241
Source: Own elaboration.
that great challenges are expressed for the strengthening of ES management capacity in the municipalities of Bahia.
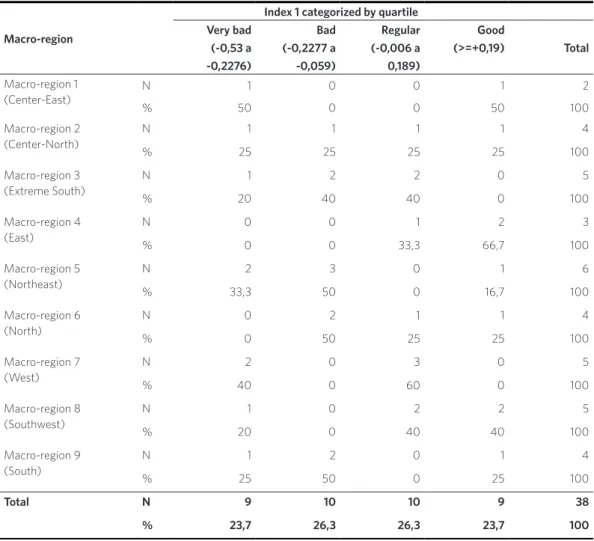
In this aspect, as shown in table 2, it can be observed that 50% of the municipalities
present management capacity of the ES between very bad and bad, compared to 26.3% of municipalities with a regular man-agement capacity, and 23.7% of municipali-ties with good management capacity.
Table 2. General evaluation of the management capacity of Epidemiological Surveillance, by macro-region of the state of Bahia, 2010
Macro-region
Index 1 categorized by quartile Very bad
(-0,53 a -0,2276)
Bad (-0,2277 a -0,059)
Regular (-0,006 a 0,189)
Good
(>=+0,19) Total
Macro-region 1 (Center-East)
N 1 0 0 1 2
% 50 0 0 50 100
Macro-region 2 (Center-North)
N 1 1 1 1 4
% 25 25 25 25 100
Macro-region 3 (Extreme South)
N 1 2 2 0 5
% 20 40 40 0 100
Macro-region 4 (East)
N 0 0 1 2 3
% 0 0 33,3 66,7 100
Macro-region 5 (Northeast)
N 2 3 0 1 6
% 33,3 50 0 16,7 100
Macro-region 6 (North)
N 0 2 1 1 4
% 0 50 25 25 100
Macro-region 7 (West)
N 2 0 3 0 5
% 40 0 60 0 100
Macro-region 8 (Southwest)
N 1 0 2 2 5
% 20 0 40 40 100
Macro-region 9 (South)
N 1 2 0 1 4
% 25 50 0 25 100
Total N 9 10 10 9 38
% 23,7 26,3 26,3 23,7 100
Source: Own elaboration.
By evaluating the data from the macro-regions, separately, taking as a reference the general index (combination of index 0 with indicators of organizational, opera-tional and sustainability dimensions), it is verified that the Eastern Macro-region is in
capacity. In the opposite situation, is the Northeast Macro-region, since the majority of the municipalities obtained an evaluation between very bad (33.3%) and bad (50%). However, this particular aspect should be treated with caution, because its insufficient number of municipalities that can be framed in all situations may have distorted the real situation. This is a problem that presents as a potential limitation in this work, but remains as an experiment and alert so that future studies can take extra measures in order to minimize the sample loss.
This evaluation converges in the same direc-tion of the distribudirec-tion of services indicated in the State Health Plan, from 2007 to 201011:
It is noticed an irregular distribution of ser-vices in the macro-regions: the East Macro-region, without any doubt, is the one that presents the highest concentration of health services. On the other hand, it is observed that the macro-regions of Central-North, Ex-treme South, Northeast, North and West are the health regions that present lower.
In this way, it can be affirmed that the dif-ferentiated degrees of resources and, conse-quently, of power are configured as elements
that can hinder the management of the ES in the municipalities, as the existing inequali-ties are not minimized through agreed man-agement processes and shared.
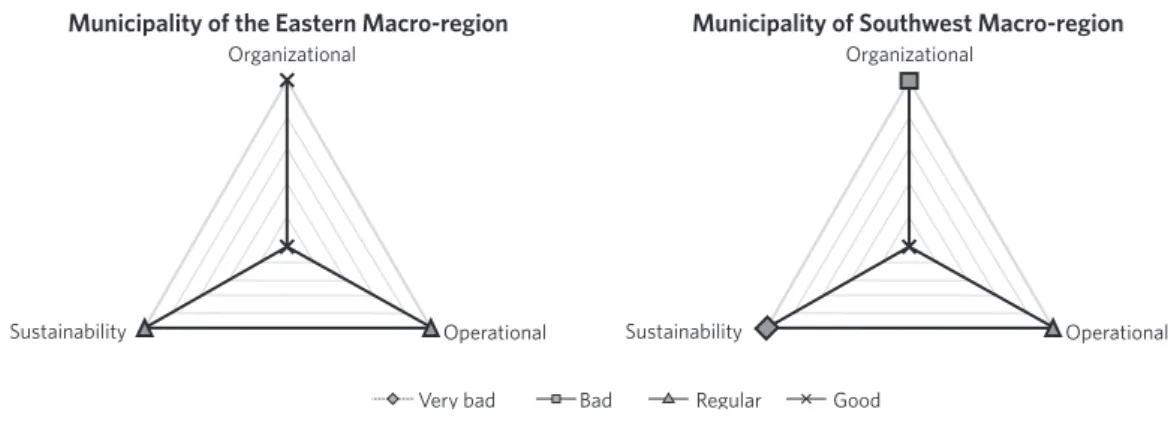
When assessing the attributes by mu-nicipality, it is observed that the municipal-ity with the best management capacmunicipal-ity is located in the Eastern Macro-region, and the municipality with less favorable conditions is located in the Southwest Macro-region.
As can be observed in figure 2, the munici-pality located in the Eastern Macro-region has a good management condition in the or-ganizational dimension and a regular condi-tion in the operacondi-tional dimension and in the sustainability dimension. The municipality with a less favorable evaluation obtained a poor evaluation in the organizational sion, very bad when evaluated the dimen-sion of sustainability, and regular condition in the operational dimension. Although they have a similar population size, with less than 20 thousand inhabitants, the municipalities have a differentiated resource input, such as the Gross Domestic Product (GDP) per capita: the municipality with the best man-agement capacity of the ES has R$ 9.975,00 and the other, R$ 3.214,00, three times lower than the other12.
Figure 2. Epidemiologic Surveillance management capacity of the municipalities selected for the case study. Bahia, 2009
Source: Own elaboration.
Municipality of the Eastern Macro-region Municipality of Southwest Macro-region
Organizational Organizational
Sustainability Sustainability
Very bad Bad Regular Good
In a general evaluation by dimension, it is observed that municipalities have a regular capacity (71%) and a very bad capacity (2.6%) to maintain and mobilize resources that guarantee desirable management condi-tions, ensuring implementation of ES actions (operational dimension).
Regarding the organizational dimension, 39.5% of the municipalities presented a very poor evaluation, compared to 26.3% that ob-tained a good evaluation, showing weaknesses in the decision-making autonomy of the local authorities, reinforcing the assertion that the decentralization of the management of the ES assumes a character more normative than po-litical, characterizing, therefore, as a deconcen-tration of actions and activities.
In the sustainability dimension, it is ob-served that 50% of the municipalities were evaluated between bad and very bad, and the other 50% evaluated between regular and good. This result allows us to infer that man-agement mechanisms and strategies are still fragile to expand or strengthen partnerships and alliances that favor the sustainability of the decisions and results declared by MHS manag-ers and workmanag-ers.
Evaluating, separately, the attributes of the operational dimension, with respect to the competence of the manager, 100% have
full superior course, with a predominance of nurses (71%), followed by biologists (10%) and physiotherapists (7.3%). The predominance of nursing in the management of the ES is an expected result, considering that historically, this is the profession that assumes the actions of ES, not only in the management, but also as a member of the FHS13,14.
It is considered, in this study, that a minimum experience of two years and man-agement training are desirable to obtain the technical legitimacy of the manager, as this increases his/her ability to decide. There was a weakness with regard to the man-ager’s competence criteria, highlighting the Extreme South Macro-region, where 80% of managers do not have previous experience in management activities in health services.
There are few municipalities that develop an inter-sectoral articulation, through mobi-lization committees against dengue, forums of women, maternal mortality committees and infant mortality committees (chart 1). However, even though there are commit-tees, some managers say that they do not participate in the meetings, which makes it possible to infer that the establishment of committees alone does not ensure that this articulation is developed, and may constitute a space with attributions.
Chart 1. Indicators related to the organizational, operational and sustainability dimensions of Epidemiological Surveillance in the state of Bahia, 2009
Organizational Dimension
Macro-regions
Indicators Center-East Center-North Extreme South East Northeast North West Southwest South
Previously held a position or management
function 100% 50% 20% 66,7% 66,7% 75% 60% 60% 50% Participate in meetings with mobilization
committees
0% 50% 0% 100% 50% 25% 0% 0% 25%
Know the guidelines of the MHP 100% 100% 80% 100% 100% 100% 100% 80% 100% Participated in the preparation of MHP 0% 50% 0% 33% 33% 50% 40% 40% 25% Affirm consistency between ES actions
and MHP guidelines
50% 100% 80% 67% 100% 100% 100% 100% 100%
Affirm consistency between the actions of the ES and the goals of the Municipal Health Agenda
Decision making in coherence with the MHP, with the Municipal Health Agenda and with the Pact for Life is a desirable requi-site for the technical and political legitimacy of the manager. In this respect, only in two macro-regions – South and Southwest – 20% of the managers reported that there was no MHP. Of the municipalities sampled, 94.7% developed MHP; 91.9% of the ES actions
carried out are consistent with the guide-lines defined in this instrument (chart 1).
The existence and performance of health councils give greater political legitimacy to the organization and indicate the expan-sion of the capacity to decide. Regarding the participation of the council members in the elaboration of plans and projects, while in the Eastern Macro-region all municipalities
Source: Own elaboration.
Chart 1. (cont.)
Affirm monthly frequency of MHC me-etings
100% 100% 100% 66,7% 100% 100% 100% 100% 75%
Affirm the participation of the directors in the preparation of ES plans and projects
50% 50% 20% 100% 33% 50% 60% 40% 25%
Affirm the existence of protocols defining flows of information between health units and network professionals
0% 25% 80% 100% 66,7% 75% 40% 20% 50%
Know goals of the PAVS 100% 100% 100% 100% 100% 100% 100% 100% 100% Know goals of the Pact for Life 100% 100% 100% 100% 100% 100% 100% 80% 100%
Operational Dimension
Macro-regions
Indicators Center-East Center-North Extreme South East Northeast North West Southwest South
Affirm that the municipality has a mini-mum structure to carry out the actions of ES
50% 100% 80% 33,3% 50% 75% 100% 100% 75%
Affirm the evaluation of the information generated by Sinan
50% 100% 100% 100% 100% 100% 100% 80% 100%
Affirm that EqSF perform ES actions 100% 100% 100% 100% 100% 100% 80% 100% 100%
Sustainability Dimension
Macro-regions
Indicators Center-East Center-North Extreme South East Northeast North West Southwest South
Affirm that the municipality has partner-ships and alliances with other institutions
50% 50% 60% 66,7% 50% 25% 80% 40% 75%
Affirm that the MHS elaborated Epide-miological Reports in 2008
100% 75% 70% 100% 60% 66,7% 80% 20% 50%
Affirm the existence of mechanisms for receiving opinions or denunciations, in response to the citizen
0% 25% 50% 100% 66,7% 66,7% 100% 60% 25%
State that the available supplies were sufficient for the first three months of management, in 2009
100% 75% 50% 66,7% 66,7% 75% 100% 80% 75%
Affirm the existence of a plan and/or pro-ject in the process of elaboration, approval or execution of the municipal ES
count on this participation, the South (20%) and Extreme South (25%) macro regions showed the lowest percentage in this regard. In the Eastern Macro-region, 66.7% of mu-nicipalities hold monthly meetings with MHC members.
As for the employment relationship, only 45% of ES workers have it effective, compared to 55% with temporary work ties. This is a negative aspect of management, as it is an area that requires a body of up-to-date knowledge and practical experience. The high frequency of workers without an effective bond results in discontinuation of the actions of the ES and other health practices (chart 1).
Regarding the number of trainings, 67.5% of municipalities carry out two or more trainings per year, the mean being defined as adequate in this study. However, the topics addressed are specific and focused on dis-eases – notably, communicable disdis-eases – and for immunization, with emphasis on vaccination campaigns.
One cannot deny the importance of these themes. However, they are not enough to stimulate changes in ES practice, especially towards the paradigm of health promotion, and not just disease prevention14,15.
It agrees with Ceccim and Merhy15,16 when they affirm that the production of knowledge must happen in the daily life of health organizations, based on the experi-ences, experiexperi-ences, and concerns of the involved actors, in a way that promotes transformations in health practices and organization of work.
Regarding the evaluation of the in-formation generated by Sinan, only the central-eastern and south-western macro-regions do not reach a percentage of 100% (chart 1). With respect to the frequency of these evaluations, the weekly (44.7%) predominates.
It is understood that, the higher the per-centage of FHS developing ES actions, the greater the capacity for local intervention. Note that only the Western Macro-region
does not reach 100%. The practices of the ES in FHS are carried out through compul-sory notifications of diseases and injuries, epidemiological investigation and some control measures (collective efforts and vaccination).
In this study, it is assumed that the for-mation of partnerships and alliances is an important strategy to make the actions of ES effective and directed to the local reality, since integration and articulation with other partners broaden the govern-ability. In this aspect, the West Macro-region (80%) stands out, followed by the East (66.7%). The macro-regions with the lowest performance are North (25%) and Southwest (40%) (chart 1). Among the partners mentioned by the manag-ers, the Municipal Secretary of Education stands out, and only two municipali-ties mentioned a partnership with Dires. Therefore, it is observed that the inter-sectoral and intra-inter-sectoral articulations are still timid, fundamental to ensure the sharing of management, co-responsibility and social participation.
Regarding the dissemination of infor-mation, it is assumed that the elabora-tion and disseminaelabora-tion of epidemiological reports allow the knowledge of the local health situation, which adds value to the management capacity. The Southwest Macro-region has the lowest performance, with 80% of the municipalities sampled without publishing at least two reports per year, a goal agreed between the mu-nicipalities and the state.
The appropriateness of supplies (notifi-cation/inquiry forms, educational material, material for examination collection) is a desirable condition so that there is no interruption in the development of the actions of the ES. In the Extreme South Region, 50% of the managers report the unavailability of supplies in their first three months of management of the ES. Of the municipalities surveyed, in 75.7% there are supplies necessary for the devel-opment of actions of the ES.
When evaluating some indicators of health and financial resources, according to the database of the Secretariat of Health of the State of Bahia (Sesab) in 2008, it can be observed: 71% of all municipalities reaching the goal of 95% vaccination in children less than one year, by the tetra-valent vaccine; 50% of the municipalities presenting a percentage greater than 80% of cure among the new leprosy cases diag-nosed; only 34% of municipalities infested by Aedes aegypti with a proportion of real estate inspected equal to or greater than 90%. As for the percentage of own revenue of municipalities, 17 do not report, 20 municipalities provide a percentage of 15% or more of their revenue – minimum percentage regulated in Constitutional Amendment (CA 29/2000 – and 1 munici-pality reported a percentage below 10%.
In spite of the growing responsibility of the municipality for the implementation of health policies, it is still contradictory the form of transfer of resources through the fi-nancing blocks, insofar as this prevents the decision-making autonomy of municipali-ties, becoming mere executors of established policies by the federal sphere12,17,18.
It can be inferred that the results of this study are consistent with the conclusions of Matus and Guimarães et al.8,9, when they affirm that government capacity (operational dimension) conditions and is conditioned by the govern-ment project (organizational dimension) and by the of the system (sustainability dimension).
Conclusions
The overall results, even with the sample loss of potential questionnaires (64.8%), point towards the studies of Barreto and Guimaraes and Landim when they point out that the decision-making autonomy of municipalities in relation to other spheres of government is still fragile, to the definition of political guidelines19,20. The municipali-ties also reveal a vulnerable technical auton-omy regarding the management of people, translated by the precariousness of the labor relations, the employment bonds and the way in which the processes of permanent education are developed; in the planning processes, which are still not very participa-tive, as well as in the evaluation of actions; in the deficient physical structure, of equip-ment and of personnel, that makes difficult the accomplishment of the actions; in a man-agement process that reveals a much more administrative rather than strategic nature; in alliances and partnerships built, albeit timidly, but which may indicate progress in management practices.
It is in the operational dimension that the results presented by the municipalities are better, although in a regular evaluation. This fact may be related to the technical capacity and the commitment of the middle managers and workers who develop the actions of ES, since the results of the evaluative baseline reveal that maximum managers of the MHS and mayors do not yet support the services and actions of the ES.
should be explained so that it does not repeat itself in new studies. However, even with the initial sample loss, the study revealed that there was no statistically significant differ-ence in the comparison between the stan-dardized global index based on secondary data from the municipalities that answered the questionnaire (n1=38) and those who did not respond (n2=70), indicating that, even if the sample was smaller than expected, the data obtained could be extended to the others, when analyzed globally.
It is considered that the decentralized management of the ES, by itself, is not capable of sustaining the results obtained in relation to the health indicators of the popu-lation. In this context, it is necessary to share the decision-making process and the adop-tion of a planning oriented to local priorities,
including with regard to the allocation of financial and operational resources.
Collaborators
Silvone Santa Bárbara da Silva Santos elabo-rated the article based on her doctoral thesis. Cristina Maria Meira de Melo, advisor of the thesis, contributed to the conception and was responsible for the final critical review of the article. André Renê Barboni participated in the elaboration of the research methodology and data analysis. Carlos Antonio de Souza Teles Santos participated in the elaboration and vali-dation of the research methodology, and data analysis. Alexandro Gesner Gomes dos Santos contributed to the review of the article. s
References
1. Arretche MTS. Políticas sociais no Brasil: des-centralização em um Estado federativo. Rev Bras
Ci Soc [internet]. 1999 Jun [acesso em 2017 jun 30]; 14(40):111-141. Disponível em: http://www. scielo.br/scielo.php?script=sci_arttext&pid =S0102-69091999000200009& lng=en&nrm=iso.
2. Assis MMA. A municipalização da saúde: intenção ou realidade? Análise de uma experiência concreta. Feira de Santana: Universidade Estadual de Feira de
Santana; 1998.
3. Baguernand J. Que sais-je: la décentralisation. Paris: Presses Universitaires de France; 2004.
4. Fundação de Empreendimentos Científicos e Tecnológicos (Finatec). Descentralização e poder local: a experiência das subprefeituras no município
de São Paulo. São Paulo: Hucitec; 2004.
5. Guimarães MCL. Descentralização da saúde, in-teresses e conflitos decisórios: o processo de de-cisão nas instâncias colegiadas estaduais, Bahia, 1993-1998 [tese]. Salvador: Universidade Federal da
Bahia, Escola de Administração; 2000. 385 p.
6. Santos SSBS, Melo CMM, Costa HOG, et al. Avaliação da capacidade de gestão descentralizada
da vigilância epidemiológica no estado da Bahia. Ciênc Saúde Colet. [internet]. 2012 Abr [acesso em 2017 jun 30]; 17(4):873-882. Disponível em: https:// www.scielosp.org/pdf/csc/v17n4/v17n4a10.pdf.
8. Matus C. Política, planejamento e governo. Brasília, DF: IPEA; 1993.
9. Guimarães MCL , Santos SMC, Melo C, et al. Avaliação da capacidade de gestão de organiza-ções sociais: uma proposta metodológica em de-senvolvimento. Cad Saúde Pública. 2004 Dez;
20(6):1642-1650.
10. Bahia (Estado). Secretaria da Saúde do Estado da Bahia. Plano Diretor de Regionalização. Resolução
CIB, no. 57, de 27 de março de 2008. Diário Oficial do Estado da Bahia, 2008 mar 27.
11. Bahia (Estado). Secretaria da Saúde do Estado
da Bahia. Plano Estadual de Saúde: gestão 2007-2010. Rev Baiana Saúde Pública. 2009 Nov; 33(supl.1):13-87.
12. Instituto Brasileiro de Geografia e Estatística (IBGE). Informações estatísticas 2007. Rio de Janeiro: IBGE; 2007.
13. Melo CMM. Divisão social do trabalho e enferma-gem. São Paulo: Cortez; 1986.
14. Santos SSBS, Melo CMM. Avaliação da
descen-tralização da vigilância epidemiológica para a Equipe de Saúde da Família. Ciênc Saúde Colet. [internet]. 2008 Dez [acesso em 2017 jun 30]; 13(6):1923-1932. Disponível em: http://www.
scielo.br/scielo.php?script=sci_arttext&pid =S1413-81232008000600028& lng=en&nrm=iso
15. Ceccim RB. Educação Permanente em Saúde:
des-centralização e disseminação de capacidade pe-dagógica na saúde. Ciênc Saúde Colet. 2005 Dez; 10(4):975-986.
16. Merhy EE. O desafio que a educação permanen-te permanen-tem em si: a pedagogia da implicação. Inpermanen-terface Comun Saúde Educ [internet]. 2005 Fev
[aces-so em 2017 jun 1]; 9(16):172-174. Disponível em: http://www.scielo.br/scielo.php?script=sci_ arttext&pid=S1414-32832005000100015&lng=en& nrm=iso.
17. Arretche MTS. Relações federativas nas políticas sociais. Educ Soc [internet] 2002 Set [acesso em 2017 jan 28]; 23(80):25-48. Disponível em: http://
www.scielo.br/pdf/es/v23n80/12922.pdf
18. Arretche MTS. Financiamento federal e gestão local de políticas sociais: o difícil equilíbrio entre
regulação, responsabilidade e autonomia. Ciênc Saúde Colet. [internet] 2003 [acesso em 2017 jun 1]; 8(2);331-345. Disponível em: http://www.scie-
lo.br/scielo.php?script=sci_arttext&pid=S1413-- 8 1 2 3 2 0 0 3 0 0 0 2 0 0 0 0 2 & l n g = e n & n r m = i so.
19. Barreto JL, Guimarães MCL. Avaliação da gestão
descentralizada da assistência farmacêutica básica em municípios baianos, Brasil. Cad Saúde Pública. 2010 Jun; 26(6):1207-1220.
20. Landim ELAS. Descentralização da gestão do Programa de DST/AIDS no Estado da Bahia: desa-fios para o município como território de práticas da saúde [dissertação]. Salvador: Universidade Federal
da Bahia; 2008. 145 p.
Received on 07/31/2017 Approved on 01/07/2018 Conflict of interests: non-existent