*e-mail: [email protected]
Research Center for Nanotechnology, Changchun University of Science and Technology, 130022 Changchun, P. R. China
A novel nanofibrous film chemosensor was designed and fabricated for detecting Fe3+. It
displayed good sensitivity and selectivity as a sensing material for Fe3+. The addition of Fe3+ would
induce obvious fluorescent quenching of the nanofibrous film and the other common metal ions did not interfere in the recognition of Fe3+. The detection limit for Fe3+ of this sensing material
was calculated to be 10.63 µmol L-1. Moreover, the nanofibrous film could not only be regarded
as a chemosensor for detecting Fe3+, but also as an adsorbent to remove Fe3+ with high efficiency
in solution. The adsorption capacity was calculated to be 13.93 mg g-1 of Fe3+/nanofibrous film
from Langmuir plot.
Keywords: electrospinning, nanofibrous film, ferric ion, fluorescent sensor, adsorbent
Introduction
Fe3+ is one of the most essential elements in human body. As a cofactor, it plays a role in plenty of enzymatic reactions in physiological processes. Lack of Fe3+ can cause many physiological changes, leading to low immunity, mental decline, neurological disorders, reduced ability to resist infection and to regulate the body temperature, along with other symptoms.1,2 Meanwhile, excessive Fe3+ in the body will result in methemoglobinemia, which is a metabolic disease that influences oxygen blood flow.3 So it is of great significance to develop chemosensors for Fe3+ in modern society. With the development of fluorescence technology, fluorescent sensors for metal ions have received great attention in the last few decades due to their useful applications in various areas. Fluorescent nanomaterials are playing important role in environmental sciences, biology and chemistry. Indeed, enormous efforts have been devoted to the research of Fe3+ nanosensors.
Electrospinning is one of the simplest techniques for preparing nanofibrous film, which has been a currently hot topic. The film structure is endowed with high specific area and porosity, and the porous network structure can greatly improve the diffusion velocity of analytes inside nanofibrous film, which allows its interaction with the functional groups distributed along the whole film.5-7 The above advantages make nanofibrous film very suitable for grafting fluorescent probes. So a large number of
electrospun fibrous film chemosensors for some analytes were designed and synthetized in recent years. They have been used to detect or adsorb different kinds of substances, such as anions, metal ions or other organic compounds.8-11 So, the synthesis of a functionalized electrospun nanofibrous film for recognizing and adsorbing Fe3+ is of great importance.
Experimental
Synthesis of 7-(diethylamino)-3-formyl-coumarin12
4-(Diethylamino)-2-hydroxybenzaldehyde (1.33 g, 6.9 mmol), diethyl malonate (1.65 g, 10.35 mmol), piperidine (1.77 g, 20.8 mmol) and two drops of acetic acid were dissolved in 100 mL ethanol. The mixture was refluxed under N2 for 12 h, then, the solvent was distilled and the crude product was purified by column chromatography, ethyl acetate:dichloromethane (EtOAc:CH2Cl2 = 1:4, v/v) on silica gel to obtain 7-(diethylamino)-3-formyl-coumarin as a yellow oil (2.18 g, yield 75%). 1H NMR (300 MHz, CDCl3)d 1.38 (m, 4H, CH2), 1.53 (m, 6H, CH3), 6.82 (s, 1H, Ph-H), 6.76 (s, 1H, Ph-H), 8.50 (s, 2H, Ph-H).
Synthesis of poly (acrylonitrile-co-acroleic acid) (PANA)
into the flask for 5 min to remove O2 and the bottle was sealed under 70 °C for 24 h. After that, yellow viscous polymer was generated, the crude product was washed with methanol for 3 times to obtain almost transparent viscous polymer, which was dried under vacuum at 50 °C for 24 h to remove the residual methanol.
Synthesis of poly (acrylonitrile-co-acroleic acid-co
-diamino-pyridine) (PANAD)
PANA (2.6 g), 2,6-diaminopyridine (4.4 g, 40 mmol) and 1-(3-dimethylaminopropyl)-3-ethylcarbondiimide hydrochloride (EDC) (0.1 g) were dissolved in 25 mL DMF, heated to 110 °C for 12 h. DMF was removed by vaccum distillation and the crude product was washed with methanol for 4 times to obtain brown viscous polymer, which was dried under vacuum at 50 °C for 24 h to remove the residual methanol, then 3.6 g PANAD was collected (yield 40%). 1H NMR (300 MHz, CDCl
3) d1.24 (m, H, CH), 2.89 (m, 2H, CH2), 3.31 (m, H, CH), 3.94 (m, 2H, CH2), 6.96 (m, H, Ph-H), 7.01 (m, H, Ph-H), 7.60 (m, H, Ph-H), 7.71 (d, H, J 3.3 Hz, Ph-H), 10.69 (s, H, NH).
Synthesis of poly (acrylonitrile-co-acroleic acid-co
-diamino-pyridine-co-coumarin) (PANADC)
PANAD (2.0 g), and 7-(diethylamino)-3-formyl-coumarin (3.86 g, 20 mmol) were dissolved in 40 mL DMF. The mixture was heated to 80 °C for 8 h, the crude product was washed with methanol 4 times to obtain PANADC as a yellow viscous polymer. 1H NMR (300 MHz, CDCl
3) d0.63 (m, H, CH), 0.94 (s, 2H, CH2), 1.02 (s, H, CH2), 1.68 (s, H, CH2), 2.13 (s, 2H, CH2), 2.76 (m, H, CH3), 7.23 (s, H, Ph-H), 7.86 (m, H, Ph-H), 7.90 (m, H, Ph-H), 8.01 (m, H, Ph-H), 8.09 (m, H, Ph-H), 8.42 (s, H, Ph-H), 8.59 (d, H,
J 2.7 Hz, Ph-H), 11.04 (s, H, NH).
Preparation of electrospinning precursor solution and film
PANADC (1.00 g) was dissolved in DMF (4.0 g) solution to prepare precursor solution with a concentration of 20 wt.%. The solution was rapidly stirred for 24 h at room
temperature. The resulting clear homogenous solution was used for fabricating the nanofibrous film. A syringe with an inserted wire to connect the high-voltage supply was filled with the precursor solution. An aluminum foil served as a receiver. The distance between syringe and receiver was 15 cm. The high-voltage supply was fixed at 16 kV. The spinning rate was controlled at about 4 mL h-1 by the microinfusion pump. Electrospinning was performed at room temperature. After the electrospinning process, the generated nanofibrous film was removed from the receiver with tweezers.
Results and Discussion
Fourier transform infrared (FTIR) investigations of PANADC film
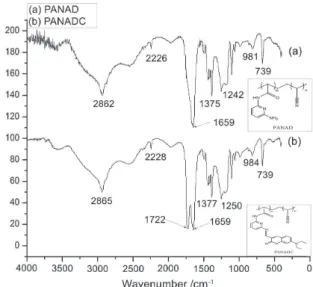
FTIR was utilized to confirm that the recognition group was successfully grafted onto PANADC. Figures 1a and 1b displayed the FTIR spectra of PANAD and PANADC, respectively. The bending vibrations at 739 cm-1 testified the pyridine group in PANAD and PANADC, meanwhile the stretching vibration at 1242 cm-1 in PANAD and 1250 cm-1 in PANADC were also ascribed to pyridine group. The characteristic bands around 980 cm-1 represented the C–H in PANAD and PANADC. Moreover, the characteristic bands of PANAD at 1375 cm-1 and the bands of PANADC at 1377 cm-1 proved the existence of C=O, and the bands exhibited at 2862 cm-1 in PANAD and at 2865 cm-1 in PANADC represented the stretching vibration of Ar–H. In addition, the band at 2226 cm-1 in PANAD and the band at 2228 cm-1 in PANADC were ascribed to cyanogroup. The characteristic bands displayed at 1659 cm-1 in both PANAD and PANADC confirmed that imine were successfully introduced into PANAD and PANADC, this phenomenon indicated that 2,6-diaminopyridine and PANA generated
−NH− structure in the PANAD, and the larger peak
width indicated that there was a large amount of grafting. Compared with Figure 1a, Figure 1b exhibited an obvious band at 1722 cm-1, which was assigned to coumarin lactone ring, so we considered that coumarin group was introduced in PANADC.
Morphologies of PANADC
Figure 2 shows the typical scanning electron microscopy (SEM) images of the PANADC nanofibrous film under 10 and 2 µm. It depicted that PANADC film was composed of numerous, randomly oriented nanofibers, and there were no obvious serious cracks or degradation in the surface of PANADC nano-fiber under the preparation conditions. The average nanofiber diameter (D) can be estimated based on the following equation.13
(1)
where n stands for the number of nanofibers in the SEM images, X stands for the diameter of each nanofiber, B is the scale bar, and L refers to the length of the scale bar. So the average diameter of PANADC nanofiber is about 0.97 µm on the basis of Figure 2b. In summary, PANADC nanofibrous provides a valuable network structure with high specific surface area, and this unique porous structure could evidently promote the external analyte to approach the recognition group on the surface of nano-fiber and also greatly accelerate the detection efficiency.14
acid]-sodium hydroxide (HEPES-NaOH) buffer solution at pH 7.1 (CH3CN:H2O = 1:1, v/v). As illustrated in Figure 3, PANADC exhibited an absorption maximum at 416 nm in the UV absorption spectrum. Upon the addition of Fe3+, the absorption band had some degree of change, so 416 nm was utilized as excitation wavelength in fluorescence titration experiment. The PANADC nanofibrous film emit fluorescence at 467 nm in fluorescent emission spectra (excited at 416 nm). When Fe3+ was introduced in the testing system, as illustrated in Figure 4, the fluorescence intensity of PANADC nanofibrous film obviously decreased. In addition, Figure 5 depicted that the relation between the decreasing fluorescence intensity of the nanofibrous film and the concentration of Fe3+ was in a linear manner (R2 = 0.99375), and the detecting limit could be reckoned from the linear relationship. The limit of detection (LOD) was calculated to be 1.063 × 10⁻⁵ mol L-1 based on LOD equation (LOD = KSb1/S, where K = 3; Sb1 is the standard deviation of the blank solution; S is the slope of the calibration curve).15 Moreover, the outstanding linear relationship proved that PANADC nanofibrous film had potential application for quantitative detection of Fe3+.
The effect of pH
The effect of operational pH is one of the most influential factors for fluorescent sensor in detecting metal ions. The fluorescence intensities of PANADC nanofibrous film and PANADC with Fe3+ in different pH values were shown in Figure 6. We could find that the pH values have
Figure 1. FTIR spectra of (a) PANAD and (b) PANADC.
Figure 2. SEM image of PANADC nanofibers under different scales: (a) 10 µm and (b) 2 µm.
certain influence on both PANADC nanofibrous film and PANADC with Fe3+ under the condition of strong acid
and alkali, this phenomenon may be attributed to the intramolecular charge transfer of receptor in PANADC, but the fluorescence intensities were relatively stable in the condition of pH 3-10, so we consider that PANADC nanofibrous film could maintain its sensitivity to Fe3+ in pH 3-10.
Selective and competitive experiments
To test the selectivity of PANADC nanofibrous film towards Fe3+, selective and competitive experiments were conducted in CH3CN and HEPES-NaOH buffer solution at pH 7.1 (CH3CN:H2O = 1:1, v/v). Some common metal ions in the environment such as K+, Cu2+, Co2+, Ni2+, Ca2+, Mg2+, Mn2+, Cd2+, Pb2+, Fe2+, Hg2+, Cr3+, Al3+ and Fe3+ were introduced to examine their influence on the fluorescence response of PANADC nanofibrous film. As illustrated in Figure 7, black bar represented selective experiments and red bar represented competitive experiments. In selectivity experiments, 100 µmol L-1 of K+, Cu2+, Co2+, Ni2+, Fe2+, Ca2+, Mg2+, Mn2+, Cd2+, Pb2+, Hg2+, Cr3+, Al3+ and Fe3+ were taken into PANADC in CH
3CN and buffer solution, only Fe3+ caused fluorescence quenching at 467 nm in the emission spectra, the introduction of other metal ions slightly affected the fluorescence at 467 nm. Furthermore, competition experiments were performed to further test the interference of other metal ions in the detecting Fe3+, PANADC nanofibrous film were the first to induce fluorescence quenching by 100 µmol L-1 of Fe3+ before mixed 1 mmol L-1 of K+, Cu2+, Co2+, Ni2+, Ca2+, Fe2+, Mg2+, Mn2+, Cd2+, Pb2+, Hg2+, Cr3+, Al3+ each, and all of the fluorescence intensity of PANADC nanofibrous film at 467 nm exhibited still quenching. So it was clearly indicated that these ions did not interfere with the detection of Fe3+. Therefore the above experiments had proven that Figure 4. Fluorescent emission spectra of PANADC nanofibrous film in
different Fe3+ concentrations in CH3CN-H2O solution.
Figure 5. Response of flourescent signal in different Fe3+ concentrations.
Figure 6. Fluorescence emission of PANADC nanofibrous film in (CH3CN-H2O = 1:1, v/v) solution at different pH values.
fluorophore. In the absence of Fe3+,the excited electrons in coumarin fluorophore directly transit to the ground state to emit fluorescence. After adding Fe3+, the coordinates of Fe3+ and acceptor moiety will block the electron transit from the electrondonating C=N moiety to the coumarin ring, and restrain the fluorescence emission of coumarin fluorophore, which result in a substantial decrease in fluorescence intensity. For other metal ions, their presences will not inhibit the electron transfer in the system, so this phenomenon results in a good selectivity of the PANADC nanofibrous film to Fe3+.
Adsorption kinetics of Fe3+ onto PANADC nanofibrous film
At present most fluorescence sensors are used for detecting analytes, but not as adsorbents from solution. The innovation of PANADC nanofibrous film is that the prepared nanofibrous film is not only a sensor for Fe3+, but also an efficient adsorbent for Fe3+. The equilibrium adsorption amounts and Langmuir adsorption curve were investigated in Figure 8. The PANADC nanofibrous film was cut into the shape of 1.0 × 2.5 cm, and added to aqueous solution in different concentrations of Fe3+ for 24 h.16 The concentration of Fe3+ ions left in aqueous solution was measured by inductively coupled plasma mass spectrometry (ICP-MS). The equilibrium adsorption amounts in different equilibrium concentrations were illustrated in Figure 8a. It was found that the adsorption of Fe3+ increased sharply with the increase in concentration until the Fe3+ reach 100 mg L-1, then the adsorption amounts tend to stabilize. The reason why the adsorption curve leveled off might be
(2)
where qe is the equilibrium quantity of the metals ions adsorbed onto the PANADC nanofibrous film (mg g-1), Ce is the equilibrium concentration (mg L-1), and qm (mg g-1), KL (L mg-1) are the Langmuir constants related to the saturation adsorption capacity and binding energy (affinity), respectively.19 As shown in Figure 8b, the relationship between Ce qe-1 and Ce was of linearity (R2 > 0.98). Based on the Langmuir theory, each reaction location absorbed Fe3+ solely in this nanofibrous film. Thus, monolayer adsorption occurred on the poly PANADC nanofibrous film.20 Therefore, we could calculate from the slope and intercept of the Ce qe-1 versus Ce plot in Figure 8b. The adsorption capacity was calculated to be 13.93 mg of Fe3+ ions per gram of PANADC film (Table 1).
Conclusions
A novel fluorescent nanofibrous film for sensing and adsorbing Fe3+ was successfully developed, the nanofibrous Table 1. The Langmuir constants for Fe3+ on PANADC nanofibrous film
Metal ion KL / (L mg-1) qm / (mg g-1) R2
Fe3+ 5.209 13.93 0.988
KL: Langmuir constant related to the binding energy (affinity); qm: Langmuir constat related to the saturation adsorption capacity; R2: linearity.
film not only possessed good selectivity and sensitivity for Fe3+, but also achieved adsorption for Fe3+. We expect that such Fe3+ nanofibrous film sensor will have application value in environmental detection.
Supplementary Information
Supplementary information is available free of charge at http://jbcs.sbq.org.br as a PDF file.
Acknowledgments
The authors gratefully acknowledge the support of the Youth Science Foundation of Changchun University of Science and Technology (XQNJJ-2016-11) and the Natural Science Foundation of Inner Mongolia (No. 2015BS0202).
References
1. Dong, L.; Wu, C.; Zeng, X.; Mu, L.; Xue, S. F.; Tao, Z.; Zhang, J. X.; Sens. Actuators, B 2010, 145, 433.
2. Barman, A.; Hamelberg, D.; ACS Omega2016, 1, 837. 3. Mabrouk, M.; Savoyant, A.; Giovanelli, L.; Clair, S.; Hayn, R.;
Chaabane, R.; J. Phys. Chem. C2017, 121, 4253.
4. Markevich, A.; Baldoni, M.; Warner, J.; Kirkland, A.; Besley, E.; J. Phys. Chem. C2016, 120, 21998.
5. Yang, Y.; Li, X.; Shen, L.; Wang, X.; Hsiao, B.; Ind. Eng. Chem. Res. 2017, 56, 3077.
6. Wang, Z.; Ma, Q.; Dong, X.; Li, D.; Xi, X.; Yu, W.; Wang, J.; Liu, G.; ACS Appl. Mater. Interfaces 2016, 8, 26226.
7. Sun, L.; Yu, X.; Sun, M. D.; Wang, H. G.; Xu, S. F.; Dixon, J. D.; Wang, Y. A.; Li, Y. X.; Yang, Q. B.; Xu, X. Y.; J. Colloid Interface Sci. 2011, 358, 73.
8. Kong, N.; Lin, F.; Zhao, W.; Lombardi, J.; Almihdhar, M.; Liu, K.; Yan, S.; Kim, J.; Luo, J.; Hsiao, B.; Poliks, M.; Zhong, C.;
ACS Sens. 2016, 1, 1060.
9. Si, Y.; Li, J.; Zhao, C.; Deng, Y.; Ma, Y.; Wang, D.; Sun, G.;
ACS Biomater. Sci. Eng. 2017, 3, 854.
10. Fan, J.; Chang, X.; He, M.; Shang, C.; Wang, G.; Yin, S.; Peng, H.; Fang, Y.; ACS Appl. Mater. Interfaces 2016, 8, 18584. 11. Wang, W.; Li, Y. P.; Sun, M. D.; Zhou, C.; Zhang, Y.; Li, Y. X.;
Yang, Q. B.; Chem. Commun. 2012, 48, 6040.
12. Lin, W. J.; Yuan, L.; Feng, J. B.; Cao, X. W.; Eur. J. Org. Chem.
2008, 16, 2689.
13. Wang, W.; Yang, Q. B.; Sun, L.; Wang, H. G.; Zhang, C. Q.; Fei, X. L.; J. Hazard. Mater. 2011, 194, 185.
14. Wang, W.; Wang, X. L.; Yang, Q. B.; Fei, X. L.; Sun, M. D.; Song, Y.; Chem. Commun. 2013, 49, 4833.
15. Zhou, C.; Song, Y.; Li, Y. P.; RSC Adv.2014, 4, 33614. 16. Haider, S.; Park, S. Y.; J. Membr. Sci.2009, 328, 90.
17. Ramazan, C.; Cengiz, S.; Mehmet, S.; Sep. Purif. Technol.2006,
49, 107.
18. Saeed, K.; Haider, S.; Oh, T. J.; Park, S. Y.; J. Membr. Sci.2008,
322, 400.
19. Deng, S.; Bai, R.; J. Colloid Interface Sci.2003, 260, 265. 20. He, Z. Y.; Nie, H. L.; White, C. B.; Bioresour. Technol. 2008,
99, 7954.
Submitted: June 16, 2017 Published online: September 1, 2017