Disparity in the gross production value of native... 1
DISPARITY IN THE GROSS PRODUCTION VALUE OF NATIVE WOOD PRODUCTS
OF THE PARAÍBA MESOREGIONS, BRAZIL (1994-2017)
1Luiz Moreira Coelho Junior2* ,Edvaldo Pereira Santos Júnior3 ,Luís Antônio Coimbra Borges4 ,Maísa Santos Joaquim5 ,Álvaro Nogueira de Souza6 and Yuri Rommel Vieira Araújo3
1 Received on 23.04.2019 accepted for publication on 19.06.2019.
2 Universidade Federal da Paraíba, Departamento de Engenharia de Energias Renováveis, João Pessoa , PB - Brasil. E-mail: <luiz@cear.
ufpb.br>.
3 Universidade Federal da Paraíba, Programa de Pós-Graduação em Energias Renováveis, João Pessoa , PB - Brasil. E-mail: <edvaldo.
junior@cear.ufpb.br> and <yuriaraujo@fl orestal.eng.br>.
4 Universidade Federal de Lavras, Departamento de Ciências Florestais, Lavras , MG - Brasil. E-mail: <luis.borges@dcf.ufl a.br>.
5 Universidade de Brasília, Faculdade de Agronomia e Medicina Veterinária, Brasília , DF - Brasil. E-mail: <maisajoaquim@unb.br>.
6 Universidade de Brasília, Departamento de Engenharia Florestal, Brasília , DF - Brasil.. E-mail: <ansouza@unb.br>.
*Corresponding author.
ABSTRACT – This paper analyzed the disparity in the gross production value of timber products from the state of Paraíba, Brazil, between 1994 and 2017. The indicators used were: the locational quotient (Lq), the
coeffi cient of location (Cl), the coeffi cient of redistribution (Cred), the coeffi cient of geographic association
(Cga), the coeffi cient of specialization (Cs) and the coeffi cient of restructuring (Cr). The results obtained
indicated that wood was the main timber product extracted in the state of Paraíba, with the Sertão paraibano region being of greater relevance, increasing the disparity between the regions; the Cred pointed out greater change for charcoal extraction; the Mata Paraibana region was the most specialized region, especially for wood extraction; and the Borborema region presented the greatest restructuring in all studied periods. The study evidenced that the extraction of wood products mainly occurred in the more arid regions of the state with the purpose of population subsistence or industrial use, especially in the red ceramics and plaster segments for which wood can be used to generate heat and thermoelectric power.
Keywords: Forest economics; Regional measures; Locational measures.
DISPARIDADE DO VALOR BRUTO DE PRODUÇÃO DOS PRODUTOS MADEIREIROS
NATIVOS NAS MESORREGIÕES DA PARAÍBA, BRASIL (1994-2017)
RESUMO – Este artigo analisou a disparidade do valor bruto de produção dos produtos madeireiros do extrativismo vegetal das mesorregiões da Paraíba, Brasil, no período de 1994 a 2017. Os indicadores empregados foram: o quociente locacional (QL), o coefi ciente locacional (CL), o coefi ciente de redistribuição (CRED), o coefi ciente de associação geográfi ca (Cag), o coefi ciente de especialização (CE) e o coefi ciente de reestruturação (Cr). Os resultados apontaram que a lenha foi o principal produto madeireiro e a mesorregião Sertão paraibano maior relevância, elevando a disparidade entre as regiões; o CRED apontou maior mudança para o carvão vegetal; a Mata Paraibana foi mais especializada em lenha e a mesorregião da Borborema apresentou a maior reestruturação em todos os períodos estudados. O estudo evidenciou que o VBP dos produtos madeireiros nativos ocorreu, principalmente, nas regiões mais áridas do estado para atender a demanda energética local e circunvizinha, com destaque aos segmentos de cerâmica vermelha e gesso. Palavras-Chave: Economia fl orestal; Medidas regionais; Medidas locacionais.
1. INTRODUCTION
Forest products come from planted or native forests and can be classifi ed as timber or non-timber. Timber comes from woody material divided into industrial wood, fi rewood and charcoal, and processed woods (chips, slats and plates), while non-wood products are all biological goods extracted from forests or wooded areas except wood (Food and Agriculture Organization of the United Nations - FAO, 1999; FAO, 2018; Instituto Brasileiro de Geografi a e Estatística – IBGE, 2017).
In 2017, Brazil had a gross production value (GPV) of R$17.22 billion for timber products (16.16% of plant extraction and 83.84% of forestry). National vegetal extraction was distributed into 69.17% (R$1.92 billion) of roundwood, 19.43% (R$54.09 million) of fi rewood and 11.40% (R$31.72 million) of charcoal. For the Brazilian regions, these corresponded to 48.62% in the North (NO), 25.85% in the Midwest (MW), 19.23% Northeast (NE), 5.20% South (SO) and 1.10%. Southeast (SE). The main timber product was roundwood in the NO and MW, and fi rewood in NO, SO and SE (IBGE, 2018).
In 2017, Northeast timber products had a GPV of R$535.33 million in plant extraction and R$1.37 billion in forestry. From the GPV of wood products from vegetal extraction, 47.53% (R$254.45 million) came from fi rewood, 37.49% (R$200.67 million) from charcoal and 14.98% (R$80.20 million) from roundwood. The use of forest resources in the region generates subsistence income for the low-income rural population focused on local energy trade, mainly used in industry (Coelho Junior et al., 2018a; IBGE, 2018; Martins et al., 2018).
In Paraíba in 2017, the gross production value (GPV) of plant extraction was R$12.92 million (94.07% of fi rewood and 5.93% of charcoal), while forestry was only R$3.63 thousand (IBGE, 2018). According to Travassos and Souza (2014), fi rewood and charcoal were important for sustaining populations, especially in times of drought, and for industry, especially in the red ceramic sectors.
Studies on productive structures are indispensable for assessing the dynamism between territories and for assessing the social, political and economic transformation of a region (Coelho Junior et al., 2013;
Simioni et al., 2017). Regional indicators are used to measure various analyzes such as industrial and population segments, employment levels and even territorial planning (Haddad, 1989, Martins et al. 2018).
Based on the specialization and location indicators, Souza and Alves (2012) studied the productive chain of economic activities in the mesoregions of Brazil. Mazur et al. (2013) analyzed the disparity between main crops in the Campo Mourão microregion in Paraná. Carvalho and Gomes (2017) developed a study based on the economic dynamics of the carnauba wax agroindustrial system in Piauí. Mattei and Mattei (2017) studied the productive structures of southern Brazil. Souza et al. (2018) evaluated the location profi le of productive activities in the Porto Nacional - TO microregion space. For timber products, the essay by Martins et al. (2018) can be highlighted, who analyzed plant extractivism for the Brazilian Northeast through locational and specialization measures.
Location and specialization indicators are tools which enable understanding regional dynamics and assisting in the orientation of public policies. Thus, this work analyzed the disparity in the gross production value of native timber products from the mesoregions in Paraíba from 1994 to 2017.
2. MATERIAL AND METHODS 2.1 Utilized data
The data used were the gross production value (GPV) in millions of Reais of the timber extraction products (TEP) of the Paraíba mesoregions from 1994 to 2017. This information was obtained from the Vegetable Extraction Production and Forestry (PEVS) through the IBGE Automatic Recovery System (SIDRA). The TEP was composed by the GPV sum of the fi rewood (Fi), charcoal (C) and roundwood (RW). Current values were defl ated by the General Price Index - Internal Availability (GPI-IA), base year of 2017 = 100, available on Ipeadata.
An analysis of the GPV evolution of Paraíba forest extraction by type of timber product and by mesoregion was carried out between 1994 and 2017. According to Coelho Junior (2013), Coelho Junior (2016) and Cuenca and Dompieri (2017), the
geometric growth rate (GGR) was used in evaluating gains or losses in production according to Equation 1:
In which: VF é GPV of the timber product or mesoregion in the fi nal year; V0 is the initial year GPV and ∆t is the temporal variation (expressed in years). 2.2 Regional and location measures
Localization measures are tools which are capable of identifying concentration patterns or spatial dispersion of activities in a given period or time interval. The location indicators used were: the location quotient (Lq), the coeffi cient of location (Cl), the coeffi cient of geographic association (Cga) and the coeffi cient of redistribution (Cred). On the other hand, the regional measures evaluate the degree of productive or sectoral diversifi cation of a territory in relation to a set of activities in a given period. Regional indicators are the coeffi cient of specialization (Cs) and the coeffi cient of restructuring (Cr) (Haddad, 1989).
The Lq (Equation 2) relates the relative share of timber product i of a given mesoregion j to the proportion of that same sector at the state level (Mazur et al., 2013).
In which: Eij = GPV of timber product i in mesoregion j; Ej = GPV of timber products in mesoregion j; Ei = GPV of timber products i in Paraíba and E = GPV of timber products in Paraíba. For Lima and Alves (2008), Lq ≥ 1.00 has a signifi cant concentration, between 0.50 ≤ Lq < 1.00 presents average concentration, and Lq < 0.5 weak concentration.
The Cl (Equation 3) relates the sum of the mesoregions, the diff erence between the share of the GPV of timber product i of a mesoregion j, and the percentage of the GPV of timber product i in Paraíba, over two (Lima et al., 2006).
The Cl varies between 0 and 1, where Cl = 0, the GPV of timber product i is equally distributed among all the timber products of the State, while for Cl = 1 there is a higher concentration than other products.
The Cga (Equation 4) represents the geographical association between the percentage distribution of two wood products (i and k) in a given mesoregion in Paraíba. Cga ranges from 0 to 1, with the following ranges: 0.15 < Cag < 0 for signifi cant association; 0.29 < Cga ≤ 0.15 medium association; 0.45 < Cga ≤ 0.29 weak association; and Cga ≥ 0.45 null association (Lima and Alves, 2008).
In which: Ekj = GPV of timber product k in mesoregion j and Ek = GPV of timber product k in Paraíba.
The coeffi cient of redistribution (Cred) (Equation 5) deals with the ratio of the GPV percentage distribution of timber products in a mesoregion to their share of GPV in Paraíba for a given time interval (t0 and t1), verifying the occurrence of a spatial concentration or dispersion pattern (Piacenti et al., 2008). The periods 2000, 2006, 2012 and 2017 were analyzed based on 1994.
where Eijt0 = GPV of timber product i in mesoregion j in the initial year; Eit0 = GPV of timber product i in Paraíba in the initial year; Eijt1 = GPV of timber product i in mesoregion j in the fi nal year and = GPV of timber product i in Paraíba in the fi nal year. Cred ranges from 0 to 1 with values close to 0, indicating that there was no change in the location pattern of product i’s GPV, while the opposite was found for values close to 1.
The coeffi cient of specialization (Cs) (Equation 6) compares the productive structure of a mesoregion with that of the state. The indicator relates the relative share of timber product i in the economy of mesoregion j with the relative share of timber product (i) in Paraíba. For Cs values close to 0, the productive structure of the mesoregion was equally distributed in Paraíba, while the opposite was found for Cs close to 1 (Lima et al., 2006).
The coeffi cient of restructuring (Cr) presented in (Equation 7) relates the production structure of a given mesoregion between two periods, verifying the degree of change in its production (Piacenti et al., 2008).
where, Ejt1 = GPV of wood product i in Paraíba in the fi nal year and Ejt0 = GPV of timber product i in Paraíba in the initial year. The value of Cr = 0 indicates that there was no signifi cant restructuring
for the mesoregion studied, while Cr = 1 indicates a complete restructuring. The periods 2000, 2006, 2012 and 2017 were analyzed based on 1994.
3. RESULTS
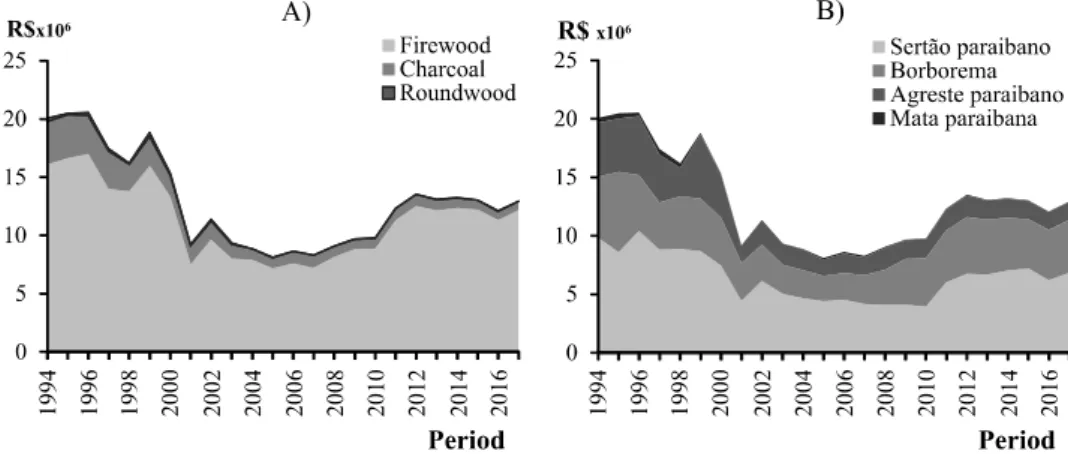
(Figure 1) shows the evolution of the GPV of Paraíba forest extraction in millions of Reais by timber product (Figure 1A) and by mesoregions (Figure 1B) from 1994 to 2017 (GPI-IA, base year 2017 = 100).
(Figure 2) shows the evolution of the GPV locational quotient (Lq) of timber products from the Paraíba mesoregions to 1994, 2000, 2006, 2012 and 2017.
(Figure 3) shows the Evolution of the coeffi cient of localization (Cl) (Figure 3A) and the coeffi cient of geographic association (Cga) (Figure 3B) of wood products from the Paraíba mesoregions from 1994 to 2017.
(Table 1) shows the evolution of the coeffi cient of redistribution (Cred) and coeffi cient of restructuring (Cr) of the GPV of the Paraíba mesoregion extracted timber products for the period 2000, 2006, 2012 and 2017 based on 1994.
Table 2 shows the evolution of the coeffi cient of specialization (Cs) of the actual GPV of timber products in the Paraíba mesoregions for 1994, 2000, 2006, 2012 and 2017.
Figure 1 – Evolution of the gross value production of the timber products of the vegetal extraction (a) and the mesoregions (b) of Paraíba, in R$ millions (R$ x10 ), from 1994 to 2017 (IGP-DI, base year 2017 = 100).
Figura 1 – Evolução do valor bruto de produção dos produtos madeireiros do extrativismo vegetal (a) e das mesorregiões (b) da Paraíba,
Figure 2 – Locational quotient (Lq) of the gross value production of timber products from the mesoregions in Paraíba for 1994, 2000, 2006, 2012 and 2017.
Figura 2 – Quociente locacional (Lq) do valor bruto de produção dos produtos madeireiros do extrativismo vegetal das mesorregiões na Paraíba, para 1994, 2000, 2006, 2012 e 2017.
Figure 3 – Evolution of the Coeffi cient of Localization (Cl) (a) and Geographic Association Coeffi cient (Cga) (b) of the gross value
production of the timber products of the mesoregions in Paraíba from 1994 to 2017.
Figura 3 – Evolução do Coefi ciente de Localização (CL) (a) e do Coefi ciente de Associação Geográfi ca (Cga) (b) do valor bruto de produção dos produtos madeireiros do extrativismo vegetal das mesorregiões na Paraíba, de 1994 a 2017.
Table 1 – Coeffi cient of redistribution (Cred) and coeffi cient of restructuring (Cr) of the gross value production of the timber products of
the mesoregions in Paraíba for 2000, 2006, 2012 and 2017 based on 1994.
Tabela 1 – Coefi ciente de redistribuição (Cred) e Coefi ciente de reestruturação (Cr) do valor bruto de produção dos produtos madeireiros do extrativismo das mesorregiões na Paraíba, para 2000, 2006, 2012 e 2017 com base em 1994.
1994 -2000 1994-2006 1994-2012 1994-2017 Cred Firewood 0,070 0,058 0,146 0,148 Charcoal 0,249 0,270 0,134 0,288 Roundwood 0,135 - - Cr Sertão Paraibano 0,028 0,027 0,060 0,056 Borborema 0,233 0,245 0,275 0,319 Agreste Paraibano 0,049 0,056 0,078 0,078 Mata Paraibana 0,047 0,481 0,453 0,453
Table 2 – Coeffi cient of specialization (Sc) of the gross value production of timber products from the mesoregions in Paraíba, for 1994,
2000, 2006, 2012 and 2017.
Tabela 2 – Coefi ciente de especialização (Cs) do valor bruto de produção de produtos madeireiros do extrativismo vegetal das mesorregiões na Paraíba, para 1994, 2000, 2006, 2012 e 2017. Mesoregions 1994 2000 2006 2012 2017 Sertão Paraibano 0,095 0,010 0,024 0,019 0,001 Borborema 0,185 0,021 0,011 0,027 0,003 Agreste Paraibano 0,044 0,026 0,022 0,002 0,016 Mata Paraibana 0,271 0,380 0,815 0,073 0,059
4. DISCUSSION
According to (Figure 1A), the average GPV of timber products in Paraíba was R$12.96 million for the period under review. In 1994, it raised to R$20.05 million and reached R$12.92 million in 2017, presenting a decrease of -1.89% per year. For fi rewood, there was a decrease in the GPV of R$16.10 million (1994) to R$12.15 million (2017), which resulted in a decrease of 1.21% per year, refl ected by the decrease in production as observed by Coelho Junior et al. (2018b). The largest collection was in 1996 with R$16.99 million, in contrast to R$7.59 million in the year 2001 which presented the lowest value among the analyzed period, in which the average participation of fi rewood was 87.24% (R$11.31 million).
Charcoal was the second most important product in the production structure, presenting a GPV of R$3.65 million in 1994, which decreased to R$765 thousand (2017) at a rate of -6.57% per year, as shown by Coelho Junior et al. (2019b). The largest collection occurred in 1995 with R$3.72 million and the lowest in 2017. Regarding timber products, the average share was 12.16% (R$1.57 million). The GPV for roundwood went from R$298.11 thousand in 1994 to R$108.70 thousand in 2003, with a decrease of 10.60% p.a. The highest value found was 1994, and the average was R$182 thousand between 1994 and 2003.
According to (Figura 1 B) and Coelho Junior et al. (2018c), the Sertão Paraíba was the mesoregion which contributed most to the state TEP’s GPV. In 1994, the mesoregion raised R$9.82 million and fell to R$6.18 million (2017), with an average rate of -1.55% per annum. The highest GPV of the period under review was R$10.41 million (1996) and the average participation of the region was 49.76% (R$6.45 million), obtained from fi rewood (89.15%) as observed by Coelho Junior et al. (2019a), charcoal (9.83%), and roundwood (1.02%). The Borborema region is the second most important for the State, and presented a reduction in the GPV from R$5.21 million (1994) to R$4.51 million (2017), with an average decrease of 0.62% p.a. The largest collection was R$6.86 million (1995) and the lowest was R$2.16 million (2005) with an average of R$3.94 million (30.42%), with 84.74% coming from fi rewood, 14.92% of charcoal and 0.34% of roundwood.
In 1994, the TEP production in Agreste generated R$4.62 million compared to R$1.52 million in 2017, while the average decrease for the region was 0.47% per year with the highest GPV of R$5.46 million (1999), the lowest of R$1.39 million (2005), and an average of R$2.46 million, with fi rewood contributing 87.11% of the mesoregion’s GPV. The Paraíba Forest collected R$397.50 thousand in 1994 and decreased to R$42.40 thousand in 2017, which represented an average fall of -0.92% p.a. The highest value recorded was R$508.85 thousand (1997) and the lowest of R$42.40 thousand (2016), while the Agreste region had the lowest average participation with 1.14% of the total state GPV.
The Lq showed migratory behavior in relation to fi rewood and charcoal during all the analyzed years, while the indicator remained constant for roundwood. Among the studied mesoregions, the Sertão Paraibano presented an average Lq of 1.018 relative to the fi rewood GPV, having Lq values higher than one in the years 1994, 2006, 2012 and 2017, representing high concentration. Coelho Junior et al. (2018) showed low competition among fi rewood-producing mesoregions in Paraíba from 1994 to 2014. The high concentration highlighted the importance of fi rewood for the regional economy associated with the socioeconomic need of more arid regions, as pointed out by Travassos and Souza (2014).
The extraction of fi rewood in the Borborema mesoregion was characterized as average concentration with the average value of the indicator being 0.974 for the analysis period, only presenting a strong concentration in 2017 with Lq of 1.003. Unlike Borborema, Agreste presented an average Lq of 1.007, being classifi ed as a region with strong concentration in relation to the fi rewood GPV; a fact explained by the high demand of the red ceramic industries present in the region. The Esperança microregion is located in this area, one of the main poles of fi rewood in the state (Reinaldo and Bezerra, 2010).
The Paraibana Forest had the lowest concentration among the mesoregions with an average Lq of 0.753, with 2007 being the lowest concentration year with Lq of 0.067. Although low in concentration, fi rewood production was important for the mesoregion as it had the second largest number of jobs associated with the red ceramic industries in the state (Paraíba State Red Ceramic Industry Union - SINDICER/PB, 2018).
The Borborema region had the highest concentration in charcoal production, with an average Lq of 1.159. In 1994, the Lq indicator presented a value of 2.013, classifying as strong concentration with the same classifi cation as the other years presented in Figure 2, except for 2017, which presented Lq of 0.909.
In Agreste, the GPV Lq of charcoal showed migratory behavior during the analysis period, being of medium concentration in 1994, 2000 and 2006, and having strong concentration in 2012 and 2017. The Paraibana Forest was the region that presented the highest concentration for charcoal, with an average Lq for the region being 2.623 between 1994 and 2008, justifi ed by the low and zero production of fi rewood.
Only two mesoregions in Paraíba showed forest extraction during the analysis period. The Sertão Paraibano with an average Lq of 0.731 was the region which most contributed to roundwood GPV for the state; strong concentrations were recorded for the region from the 10 years of input production (1994 to 2003), except for 1995 and 1996, which presented average concentration. The Borborema mesoregion presented Lq of 0.242 for the studied period, especially for the years 1996 and 1997, which presented a strong concentration.
The Cl analysis showed that the fi rewood extraction pattern showed the most similarity with the pattern of wood products in the state, with an average Cl value for fi rewood of 0.016. The low Cl values were caused by the high participation of fi rewood in the total extraction of Paraíba, resulting in a regional distribution similar to that of the total timber products.
The initial years for charcoal extraction pointed out the most signifi cant diff erence for which the average Cl value was 0.105, highlighting the period from 1994 to 1997, which presented the highest concentration in the input extraction with an average of 0.232, as presented by Coelho Junior et al. (2019b). Roundwood extraction showed the biggest diff erence in distribution compared to the state, considering that only two mesoregions contributed to the extraction; the average value for the roundwood Cl from 1994 to 2003 was 0.466.
The coeffi cient of geographic association (Cga) pointed to the largest geographical association between charcoal and fi rewood. The average value
of the association between these products was 0.121, which indicated signifi cant association. The year with the lowest association was 1995 (0.378), while the year with the highest association was 2003 (0.026).
The Cga for fi rewood and roundwood had an average value of 0.462, classifying the association as null and showing that the extraction of inputs occurs in diff erent locations, considering that fi rewood production occurred in all mesoregions, while the production of roundwood only occurred in Sertão Paraibano and Borborema. In turn, the association between charcoal and roundwood was the lowest found with an average Cga value of 0.521 and zero association classifi cation, while the lowest concentration year was 1995 (0.839), which may be justifi ed by the fact for being the year with the lowest GPV for charcoal in the Sertão Paraibano, the most important region for roundwood.
The most signifi cant change in the studied ranges for Cred was found for charcoal exploitation, as identifi ed by Martins et al. (2018) for the states in northeastern Brazil. The indicator indicated little change to roundwood in all analysis periods.
The most signifi cant Cred value was 0.288 for charcoal from 1994 to 2017. In 1994, the charcoal GPV was concentrated in the Borborema mesoregion, which accounted for 52.38% of the input GPV in the state; however, the Sertão mesoregion became the main region in 1998, leading to redistribution. Sertão Paraibano accounted for 52.16% of charcoal GPV, while Borborema had a drop in share to 33.07%.
The largest redistribution interval for fi rewood was 1994-2017 (0.148), while in 2017 53.13% of the GPV was obtained by Sertão Paraibano, 35.07% by Borborema, 11.45% by Agreste and 0.35% by the Paraibana Forest. Due to its low production and lack of data, roundwood did not present signifi cant results for this indicator, thus showing that it was concentrated in the same regions in the production years.
The coeffi cient of restructuring (Cr) pointed to the largest restructuring for the mesoregions of Borborema and Paraibana Forest. There was no signifi cant restructuring regarding Sertão and Agreste. The highest Cr value was found for the 1994 and 2006 interval. The Paraibana Forest presented a Cr of 0.481, showing that there was a signifi cant change in its productive structure.
In 1994, the region had fi rewood as its main extraction product among timber products, with 54.69% of the share and 45.31% related to the GPV of charcoal production. There was an inverse scenario in 2006 with 93.42% of the GPV coming from charcoal, showing high concentration; high Cr values for the Paraibana forest were associated with low exploitation of timber products, as shown by Coelho Junior et al. (2019b); thus, small changes in the extraction of products signifi cantly changed the productive structure of the region. Regarding Borborema, Cr values were signifi cant due to the high extraction of charcoal in the initial years of analysis.
The Cs showed that the Paraíba regions do not have specialization in relation to the forest extraction of timber products, except for the Paraibana Forest (1994, 1995 and 2005 to 2008), which presented high Cs values indicating distinct composition of the reference region, as evidenced by the Lq for charcoal production.
Cs values were mostly close to zero, demonstrating an identical productive composition between the regions and the state of Paraiba. The Borborema Paraibana Forest region presented the highest Cs values presented throughout the analysis period from 2005 to 2008, with a maximum value in 2005 (0.829), respectively, showing to be the most specialized among the analyzed mesoregions.
The Paraibana Forest mesoregion had 94.67% of its timber GPV from charcoal extraction in 2005, while only 11.78% of the state of Paraíba GPV was obtained from charcoal. Borborema was another region that presented a slightly diff erent composition from the state with Cs of 0.185 in 1994.
5. CONCLUSION
From the analyzes performed, it is possible to state that fi rewood was the main timber product extracted in the state of Paraíba; Paraíba Sertão was the most relevant region for the extraction of timber products during the analyzed period, increasing the disparity between the regions; Cred pointed to a greater change for charcoal extraction and did not point to changes in the roundwood pattern, showing that few regions extracted the resource; the timber product extraction structure in the Paraíba mesoregions did not change signifi cantly compared to 1994; Paraibana Forest
region was the most specialized and most restructured region and charcoal was the product with the highest redistribution in all the studied periods.
The study showed that the extraction of timber products mainly occurred in the most arid regions of the state where they are commonly used as a means of subsistence of the population or in industrial centers where they can be used for heat and electricity generation, such as the red ceramic and plaster segments.
6. REFERENCES
Carvalho JNF, Gomes JMA. Dinâmica econômica do sistema agroindustrial da cera de carnaúba no Piauí. Informe Gepec, 2017; 21(1):48-65.
Coelho Junior LM. Concentração regional do valor bruto de produção da banana do Paraná, Brasil (1995 a 2010). Ciência Rural, 2013; 43(12): 2304-2310. Coelho Junior LM, Rezende JLP; Oliveira AD. Concentração das exportações mundiais de produtos florestais. Ciência Florestal, 2013; 23(4): 691-701. Coelho Junior LM. Concentração regional do valor bruto de produção o pinhão do Paraná. Ciência Florestal, 2016; 26(3): 853-861.
Coelho Junior LM, Burgos MC, Santos Júnior EP, Pinto PALA. Regional concentration of the gross value of production of firewood in Paraíba. Floram, 2019a.; 26(3): e20170887.
Coelho Junior LM, Medeiros MG, Santos Júnior EP, Borges LAC, Joaquim MS, Silva ML. Regional concentration of charcoal production in Paraíba state, Brazil (1994-2016). Revista Árvore (on-line), 2019b; 43(1): e430105.
Coelho Junior LM, Martins KLC, Silva MVB. Spatial convergence of the gross value of production of firewood in the mesoregions of the Brazilian Northeast. Revista Árvore, 2018a; 42(2): e420203. Coelho Junior LM, Burgos MC, Santos Júnior EP. Concentração regional da produção de lenha da Paraíba. Ciência Florestal (01039954), 2018b; 28(4):1729-40.
Coelho Junior LM, Martins KLC; Silva MVB, Pinto PALA. Spatial distribution of firewood production
in Northeastern Brazil (1994-2013). Revista Árvore, 2018c; 42(4): e420402,.
Cuenca MAG, Dompieri MHG. Dinâmica espacial da canavicultura e análise dos efeitos sobre o valor bruto da produção, na região dos tabuleiros costeiros da Paraíba, Pernambuco e Alagoas. Revista Econômica do Nordeste, 2017; 47(4):91-106.
Food And Agriculture Organization Of The United Nations - FAO. FAO forestry. Towards a harmonized definition of non-wood forest products. Unasylva, 1999 [cited 2019 Feb 15] 50 (198). Available from: http://www.fao.org/3/ x2450e/x2450e0d.htm
Food And Agriculture Organization Of The United Nations - FAO. El estado de los bosques del mundo - Las vías forestales hacia el desarrollo sostenible. Roma, 2018 [cited 2019 Feb 25] Available from: http://www.fao.org/3/I9535ES/ i9535es.pdf
Haddad PR. Medidas de localização e de especialização. In: Haddad PR et al. (Org.). Economia regional: teorias e métodos de análise. Fortaleza: Bnb-Etene; 1989.
Instituto Brasileiro de Geografia e Estatística - IBGE. Produção da Extração Vegetal e da Silvicultura 2017. Rio de Janeiro 2017 [cited 2019 jun 06]. Available from: https://agenciadenoticias. ibge.gov.br/media/com_mediaibge/
arquivos/15f538e9095614fc3204f828b22fa714.pdf Instituto Brasileiro de Geografia e Estatística - IBGE. Sistema IBGE de Recuperação Automática. [Acessado em: 01 out. 2018]. Disponível: <http://www2.sidra.ibge.gov.br/bda/tabela/listabl. asp?c=292&z=t&o=18>.
Ipeadata. Índice Geral de Preços - Disponibilidade Interna. [Acessado em: 20 out. 2018]. Disponível: <www.ipeadata.gov.br/Default.aspx>.
Lima JF, Alves LR, Piffer M, Piacenti CA. Análise regional das mesorregiões do estado do Paraná no final do século XX. Revista de Análisis Económico, 2006; 24(46): 7-25. <https://doi.org/10.22456/2176-5456.10845>.
Lima JF, Alves LR. Localização, concentração e vantagem competitiva dos ramos produtivos na geoeconomia paranaense. Caderno de Geografia, 2008; 18(29): 98-124.
Martins KLC, Melquiades TF, Rezende JLP, Coelho Junior LM. Plant extractivism production disparity between Northeast Brazil and Brazil. Floresta e Ambiente, 2018; 25(4): e20160456. < https://doi. org/10.1590/2179-8087.045616>.
Mattei TF, Mattei, TS. Métodos de Análise
Regional: um estudo de localização e especialização para a Região Sul do Brasil. Revista Paranaense de Desenvolvimento-RPD, 2017; 38(133): 227-243. Mazur AI, Romero EA, Ecker AEA. Análise Locacional da produção das principais culturas na microrregião de Campo Mourão – Paraná. Revista em Agronegócios e Meio Ambiente, 2013; 6(1): 31-45.
Piacenti C, Alves LR, Lima JF. O Perfil Locacional do Emprego Setorial no Brasil. Revista Econômica do Nordeste, Fortaleza,2008; 39(3): 482-502. Reinaldo Filho LL, Bezerra FD. Informe setorial cerâmica vermelha. Fortaleza: Banco do Nordeste, 2010.
Simioni FJ, Magalhães ÁPMJM, Fachinello AL, Buschinelli CCA, Matsuura MISF. Evolução e concentração da produção de lenha e carvão vegetal da silvicultura no Brasil. Ciência Florestal, 2017; 27(2): 731-742.
Sindicato da Indústria de Cerâmica Vermelha do Estado da Paraíba – SINDICER/PB. O setor cerâmico. [Acessado em: 07 de março de 2018]. Disponível: http://www.sindicerpb.com.br/ setorceramico.
Souza CCG, Alves LR. A especialização e a reestruturação produtiva das atividades econômicas entre as mesorregiões do Brasil entre 2000 a 2009. Informe GEPEC, 2012; 15(3): 145-161.
Travassos IS, Souza BI. Os negócios da lenha: indústria, desmatamento e desertificação no Cariri paraibano. GEOUSP – Espaço e Tempo (Online), São Paulo, 2014; 18(2): 329-340.