HUMAN GENETICS
Dispersals and genetic adaptation of
Bantu-speaking populations in Africa
and North America
Etienne Patin,1,2,3*Marie Lopez,1,2,3Rebecca Grollemund,4,5Paul Verdu,6 Christine Harmant,1,2,3Hélène Quach,1,2,3Guillaume Laval,1,2,3George H. Perry,7 Luis B. Barreiro,8Alain Froment,9Evelyne Heyer,6Achille Massougbodji,10,11
Cesar Fortes-Lima,6,12Florence Migot-Nabias,13,14Gil Bellis,15Jean-Michel Dugoujon,12 Joana B. Pereira,16,17Verónica Fernandes,16,17Luisa Pereira,16,17,18
Lolke Van der Veen,19Patrick Mouguiama-Daouda,19,20Carlos D. Bustamante,21,22 Jean-Marie Hombert,19Lluís Quintana-Murci1,2,3*
Bantu languages are spoken by about 310 million Africans, yet the genetic history of Bantu-speaking populations remains largely unexplored. We generated genomic data for 1318 individuals from 35 populations in western central Africa, where Bantu languages originated. We found that early Bantu speakers first moved southward, through the equatorial rainforest, before spreading toward eastern and southern Africa. We also found that genetic adaptation of Bantu speakers was facilitated by admixture with local populations, particularly for theHLAandLCTloci. Finally, we identified a major contribution of western central African Bantu speakers to the ancestry of African Americans, whose genomes present no strong signals of natural selection. Together, these results highlight the contribution of Bantu-speaking peoples to the complex genetic history of Africans and African Americans.
L
inguistic and archaeological records indi-cate that Bantu languages, together with agriculture, expanded ~4000 to 5000 years ago from western central Africa to eastern and southern Africa (1). Population genet-ics studies have informed us about the genetic structure of African populations and demonstra-ted that the expansion of Bantu languages was accompanied by a diffusion of people (2–5). How-ever, most genomic studies have focused on com-parisons between farming and hunter-gathering populations (6,7) rather than on patterns of di-versity among Bantu-speaking populations across the continent. Thus, although Bantu speakers today account for one-third of sub-Saharan Africans, many aspects of their genetic history remain unknown.One debated question concerns the routes fol-lowed by Bantu speakers during their dispersal across sub-Saharan Africa, owing to the poor pop-ulation coverage in the Bantu heartland (i.e., the Nigeria/Cameroon frontier) or the limited genetic resolution of previous studies (2–5). Furthermore, documentation of how Bantu speakers adapted
to the new environments they encountered—from the grasslands of Cameroon to the African rain-forest, the East African plateau, and the Kalahari desert—is unknown. Their rapid adaptation may have been facilitated by the acquisition, via ad-mixture, of adaptive alleles from local popula-tions; the impact of this process on recent human evolution remains largely unexplored (7,8). Finally, large-scale movements of Bantu peoples have not been limited to Africa, as historical records indicate that people from western central Africa were mas-sively deported to North America during the trans-atlantic slave trade (9).
We dissected the genetic and adaptive histo-ry of Bantu-speaking populations (BSPs, which refers here to traditional farming groups and does not include Bantu-speaking rainforest hunter-gatherers) by generating genome-wide single-nucleotide polymorphism (SNP) data for 1318 individuals from 35 linguistically and anthro-pologically well-defined populations of western and western central Africa, including the Bantu homeland (Fig. 1A and table S1). After quality control (fig. S1) (10), we combined these data with
data sets for other BSPs and non-BSPs from sub-Saharan Africa (table S2). We obtained a total of 548,055 high-quality SNPs in 2055 individuals from 57 populations.
Genetic cluster analyses (11) showed that BSPs from western central (wBSP), eastern (eBSP), southwestern (swBSP), and southeastern (seBSP) Africa clustered together (Fig. 1B and figs. S2 to S4), echoing their modest levels of genetic differ-entiation (analysis of molecular variance–based FST< 0.01) (table S3). This relative homogeneity
reflects the recent separation of BSPs after their expansions throughout sub-Saharan Africa (5,12). Furthermore, wBSPs, eBSPs, and seBSPs dis-played moderate proportions of ancestry from western rainforest hunter-gatherers (~16%), Afroasiatic-speaking farmers (~17%), and San hunter-gatherers (~23%), respectively, suggest-ing admixture with local populations.
Two hypotheses have been proposed concern-ing the dispersal of Bantu-speakconcern-ing populations across sub-Saharan Africa (2–4). According to the“early-split”hypothesis, the western and east-ern branches split early, within the Bantu heart-land, into separate migration routes. By contrast, the“late-split”model suggests an initial spread southward from the Bantu homeland into the equatorial rainforest (i.e., Gabon/Angola), fol-lowed by expansions toward the rest of the subcontinent. We tested these hypotheses by determining whether eBSPs and seBSPs were genetically closer to wBSPs from the southern part, relative to wBSPs from the northern part, of western central Africa. The populations from this core region can be distinguished along the first axis of the haplotype-based principal com-ponent analysis (PCA) (Fig. 1C and figs. S5 to S7) (13), mirroring genetic isolation due to both geo-graphy and linguistic barriers (fig. S8) (10). We overcame problems due to the levels of non-BSP ancestry detected in eBSPs and seBSPs (Fig. 1B) by using haplotype-based admixture inference with GLOBETROTTER (14) to account for poten-tial admixture.
The GLOBETROTTER method estimated that eBSPs resulted from two consecutive ad-mixture events (P< 0.05) occurring 1000 to 1500 years ago and 150 to 400 years ago between a wBSP (~75% contribution) and an Afroasiatic-speaking population from Ethiopia (~10% contribution) (table S4). For both events, the best-matching parental wBSP was located in Angola and support for a northern central African origin was weak (Fig. 2A and figs. S9 and S10). In southern Africa, seBSPs displayed
1Human Evolutionary Genetics, Institut Pasteur, 75015 Paris, France.2Centre National de la Recherche Scientifique URA3012, 75015 Paris, France.3Center of Bioinformatics, Biostatistics, and
Integrative Biology, Institut Pasteur, 75015 Paris, France.4Evolutionary Biology Group, School of Biological Sciences, University of Reading, Reading RG6 6BX, England.5Departments of English and Anthropology, University of Missouri, Columbia, Missouri, MO 65211, USA.6
Centre National de la Recherche Scientifique UMR7206, Muséum National d’Histoire Naturelle, Université Paris Diderot, Sorbonne Paris Cité, 75016 Paris, France.7
Departments of Anthropology and Biology, Pennsylvania State University, University Park, PA 16802, USA.8
Université de Montréal, Centre de Recherche CHU Sainte-Justine, Montréal, Québec H3T 1C5, Canada.9
Institut de Recherche pour le Développement, UMR 208, Muséum National d’Histoire Naturelle, 75005 Paris, France.10
Centre d’Etude et de Recherche sur le Paludisme Associé à la Grossesse et l’Enfance (CERPAGE), Cotonou, Bénin.11
Institut de Recherche Clinique du Bénin (IRCB), 01 BP 188 Cotonou, Bénin.12
Anthropologie Moléculaire et Imagerie de Synthèse, Centre National de la Recherche Scientifique UMR 5288/Université Paul Sabatier Toulouse 3, 31073 Toulouse Cedex 3, France.13
Institut de Recherche pour le Développement, UMR 216, 75006 Paris, France.14
Communautés d’Universités et Etablissements (COMUE) Sorbonne Paris Cité, Faculté de Pharmacie, Université Paris Descartes, 75006 Paris, France.15
Institut National d’Etudes Démographiques, 75020 Paris, France.16
Instituto de Investigação e Inovação em Saúde (i3S), Universidade do Porto, Porto 4200-135, Portugal.17
Instituto de Patologia e Imunologia Molecular da Universidade do Porto (IPATIMUP), Porto 4200-465, Portugal.18
Faculdade de Medicina da Universidade do Porto, Porto 4200-319, Portugal.19
Centre National de la Recherche Scientifique UMR 5596, Dynamique du Langage, Université Lumière-Lyon 2, 69007 Lyon, France.20
Laboratoire Langue, Culture et Cognition (LCC), Université Omar Bongo, 13131 Libreville, Gabon.21
Department of Genetics, Stanford University, Stanford, CA 94305, USA.22
Department of Biomedical Data Science, Stanford University, Stanford, CA 94305, USA. *Corresponding author. Email: epatin@pasteur.fr (E.P.); quintana@pasteur.fr (L.Q.-M.)
on May 5, 2017
http://science.sciencemag.org/
signals of a unique admixture event (P< 0.01) occurring ~700 years ago between a parental BSP (~70% contribution) and the Ju/’hoansi San from Namibia (~23% contribution). The best parental BSP was located in Angola, with some contribution from eBSPs (Fig. 2B and figs. S9 and S10). Furthermore, eastern and southeast-ern Bantu speakers shared more identical-by-descent segments with Angolans, relative to northern wBSPs (Mann-Whitney test;P< 10−16) (table S5). Although additional sampling of African populations may further refine these patterns, our results, together with previous ge-netic data supporting the late-split model (2,3), indicate that BSPs first moved southward through the rainforest before migrating toward eastern and southern Africa, where they admixed with local populations. This model is further supported by linguistics (15) and archaeoclimate data (16), suggesting that a climatic crisis ~2500 years ago fragmented the rainforest into patches and fa-cilitated the early movements of BSPs farther southward from their original homeland.
As they dispersed through the rainforest, Bantu speakers encountered local populations of rainforest hunter-gatherers (RHGs). We found that the RHG ancestry detected in wBSPs (Fig. 1B and figs. S2 and S5) resulted from an ture event occurring ~800 years ago, using admix-ture linkage disequilibrium decay with ALDER (P< 10−8) (table S6) (17) and GLOBETROTTER (P< 0.01) (table S4) (14). These results, together
with the low western RHG ancestry detected among BSPs from eastern and southeastern Africa (<5%), indicate that admixture between wBSPs and RHGs occurred mostly after BSPs had expanded throughout sub-Saharan Africa.
The adaptive history of farming BSPs, which were rapidly exposed and had to adapt to new
ecosystems, remains largely unknown. We scanned their genomes for signatures of strong, recent positive selection—i.e., regions showing a high proportion of SNPs presenting both greater ex-tended haplotype homozygosity and population differentiation, relative to a closely related ref-erence population (10). We detected eight, five, and
Patinet al.,Science356, 543–546 (2017) 5 May 2017 2 of 4
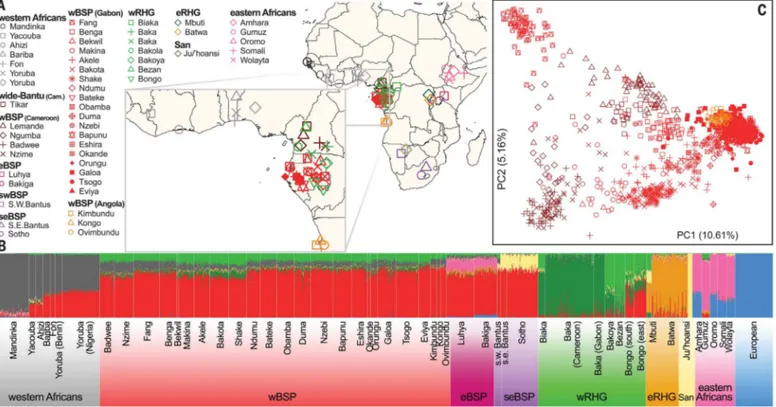
Fig. 1. Genetic structure of African populations.(A) Geographic locations of sampled populations. The inset shows the homeland of Bantu expansions. wRHG and eRHG correspond to western and eastern rainforest hunter-gatherers, respectively. (B) Clustering analysis was performed on 2055 individuals and 406,798 independent SNPs with ADMIXTURE (11). Results for varying numbers of postulated ancestral populations (K) are shown in fig. S2. (C) Haplotype-based PCA of wide-Bantu-speaking and narrow-Bantu-speaking populations from western central Africa, on 1015 individuals and 429,972 SNPs, with the software fineSTRUCTURE (13). The proportions of variance explained, expectedly larger than for unlinked SNP data, are shown in brackets.
Fig. 2. Reconstructing the dispersal of Bantu-speaking populations.Haplotype-based inference of the genetic origins of (A) eBSPs and (B) seBSPs. The names of the tested admixed populations are shown in italics. Circle sizes are proportional to the relative genetic contribution of parental populations to admixed populations. Only the oldest admixture event in eBSPs is represented; the most recent admixture event and other examples are shown in fig. S9.
R ES E A RC H | R E P O R T
on May 5, 2017
http://science.sciencemag.org/
seven genomic regions presenting strong signa-tures of recent positive selection in wBSPs, eBSPs, and seBSPs, respectively (tables S7 to S9) (10).
The HLAlocus, which mediates immune response, presented the genome-wide highest proportion of selection signals in both wBSPs and eBSPs (50.5 and 62.4%, respectively) (Fig. 3, A and B, and tables S7 and S8). The most prominent peaks for individual SNP scores were observed in the vicinity ofHLA-Dgenes [rs3129302, empiricalP(Pemp) = 2.9 × 10⁻⁵and
rs6907291,Pemp= 6.9 × 10⁻⁵, respectively] (Fig.
3D and figs. S11 to S14). In wBSPs, the second-strongest hit encompassedCD36(Fig. 3A; figs. S11 and S12; and table S7), associated with
sus-ceptibility toPlasmodium falciparummalaria (18). The putatively selected SNP inCD36was observed at 25% frequency in wBSPs, yet was essentially absent from non-BSPs from western Africa (rs3211881,Pemp= 5.8 × 10⁻⁶) (fig. S11F).
Adaptive evolution has been demonstrated for a different, unlinked variant atCD36in the west-ern African Yoruba of Nigeria (rs3211938) (19), suggesting convergent adaptation.
In eBSPs, the next-strongest selection signal overlapped theLCTgene region, which encodes the lactase enzyme (28.7%) (Fig. 3, B and E; figs. S13 and S14; and table S8). The derived allele of the best candidate SNP at this locus (rs4954204, Pemp= 5.7 × 10−
6
) displayed high levels of both
haplotype homozygosity and genetic differen-tiation and was linked to the lactase persistence allele C-14010 (20). In seBSPs, the proportions of selection signals were lower (<24%) (Fig. 3, C and F; fig. S15; and table S9), possibly reflecting a different demographic and adaptive history.
We scanned the genomes of BSPs for the presence of regions with unusually high levels of non-BSP ancestry (10). Again, theHLAregion in wBSPs showed a strong excess of ancestry from rainforest hunter-gatherers, at 38%, 6.74 SD higher than the genome-wide average of 16% (Fig. 3A). Similar results were obtained when excluding the classicalHLAregion and restrict-ing the analysis to data from a srestrict-ingle SNP array
Fig. 3. Genomic signatures of recent positive selection.(AtoC) Genomic signatures of recent positive selection in (A) wBSPs, (B) eBSPs, and (C) seBSPs. Blue points, and their sizes, indicate the proportion, in 100-SNP windows, of SNPs showing outlier neutrality statistics (10). (DtoF) Local selection signatures for (D) theHLAregion in wBSPs, (E) theLCTregion in eBSPs, and (F) theGPR156region in seBSPs. Blue points indicate selection scores for individual SNPs (10). The blue line indicates the proportion, in 100-SNP windows, of SNPs showing outlier neutrality statistics. Other candidate loci are shown in figs. S11, S13, and S15. [(A) to (F)] The green, pink, and gold solid lines indicate the local ancestry in BSPs from western RHG, Eastern African, and San populations, respectively.
on May 5, 2017
http://science.sciencemag.org/
(fig. S11, A and B), indicating that our findings are unlikely to result from the incorrect model-ing of the complexHLAhaplotype structure or misalignments of alleles between SNP arrays. Simulations under realistic demographic models showed that drift or continuous gene flow from RHGs could not account for the high frequency of introgressedHLAvariants in wBSPs (P< 0.0001) (fig. S16 and table S10). Given that these intro-gressed variants are independent from those presenting the strongest selection signals (10), our results indicate that the HLA locus has been a hotspot of recent adaptation in BSPs.
We found a local excess of eastern African an-cestry in theLCTregion of eBSPs, and the intro-gressed variants were those that also showed the strongest positive selection scores of the region (Fig. 3, B and E) (10). Simulations indicated that the high frequency of these variants in eBSPs (up to 30% in the Bakiga eBSP and <1% in wBSPs) (fig. S13D and table S8) could not be explained by strong drift or continuous gene flow from eastern Africans (P< 0.0001) (fig. S17 and table S10). These observations support a model in which eBSPs acquired the lactase persistence trait from eastern Africans (20) and illustrate that the rapid adaptation of human populations migrating to new environments can be facilitated by admix-ture with local populations.
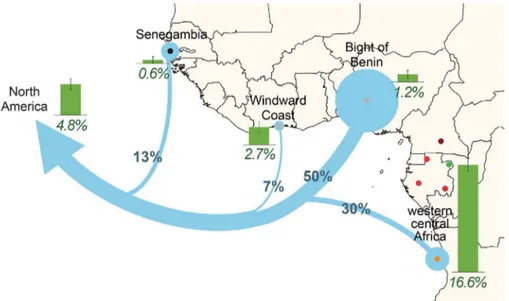
Last, we estimated the genetic contribution of Bantu-speaking populations to African Americans by analyzing the African ancestry of 5244 African Americans from various locations in North America (table S2). Consistent with previous analyses (5,21–23), the program ADMIXTURE estimated that African Americans had 73% and 78% African ancestry in the northern and southern United States, respectively (fig. S18 and table S11). GLOBETROTTER partitioned their African an-cestry into different contributions: 13% from
Senegambia, 7% from the Windward Coast, 50% from the Bight of Benin, and up to 30% from western central Africa, mostly from Angola (Fig. 4 and table S11). The estimated contribu-tion of BSPs from western central Africa is con-sistent with historical records reporting that 23% of slaves transported to North America between 1619 and 1860 originated from this region (9). Furthermore, ADMIXTURE estimated that western RHG ancestry accounted for ~4.8% of the African ancestry of African Americans (Fig. 4 and fig. S19). Given that a direct RHG contribution to the slave trade is unlikely (table S12) (10), this result further supports that a large fraction of the genome of African Americans derives from wBSPs, who themselves have ~16% western RHG ancestry (Fig. 4). Our results indi-cate that the ultimate African origins of African Americans are more diverse than previously sug-gested (5,21,23).
Relaxed selective pressure at the malaria-associatedHBBandCD36genes has been sug-gested in African Americans, based on large allele frequency differences between African Americans and their assumed, unique African parental pop-ulation, the non-BSP Yoruba from western Africa (24). We replicated this result for CD36 when considering western Africans only (rs3211938; c2-testP = 2.7 × 10⁻¹⁰) (fig. S20A), but it was entirely lost when a more diverse, and realistic, set of African parental sources was used (c2-test
P= 0.42) (fig. S20B). Thus, theCD36signal (24) is due to the use of the Yoruba as the sole source of African ancestry in African Americans. Fur-thermore, our analyses did not detect any excess of African ancestry in African American genomes (25), using either set of parental populations (fig. S21) (10), collectively suggesting that no major changes in selective pressure have occurred in the history of African Americans.
Our study reconstructs the genetic history of Bantu-speaking farming communities, from their initial expansions within Africa to the most recent forced migrations of a subset of these populations to North America. Additional large-scale rese-quencing studies of geographically and linguis-tically diverse populations from Africa are needed to provide insight into the evolutionary forces acting on genome diversity at a fine geographic and temporal scale, ultimately facilitating the unbiased identification of variants contributing to diseases in the Southern Hemisphere.
R E F E R E N C E S A N D NOTE S
1. D. W. Phillipson,African Archaeology(Cambridge Univ. Press, ed. 2, 1993).
2. G. B. Busbyet al.,eLife5, e15266 (2016).
3. C. de Filippo, K. Bostoen, M. Stoneking, B. Pakendorf,Proc. Biol. Sci.279, 3256–3263 (2012).
4. S. Li, C. Schlebusch, M. Jakobsson,Proc. Biol. Sci.281, 20141448 (2014).
5. S. A. Tishkoffet al.,Science324, 1035–1044 (2009). 6. J. K. Pickrellet al.,Nat. Commun.3, 1143 (2012). 7. C. M. Schlebuschet al.,Science338, 374–379 (2012). 8. C. Jeonget al.,Nat. Commun.5, 3281 (2014).
9. D. Eltis, D. Richardson,Atlas of the Transatlantic Slave Trade (Yale Univ. Press, 2010).
10. See the supplementary materials.
11. D. H. Alexander, J. Novembre, K. Lange,Genome Res.19, 1655–1664 (2009).
12. D. Gurdasaniet al.,Nature517, 327–332 (2015). 13. D. J. Lawson, G. Hellenthal, S. Myers, D. Falush,PLOS Genet.8,
e1002453 (2012).
14. G. Hellenthalet al.,Science343, 747–751 (2014). 15. R. Grollemundet al.,Proc. Natl. Acad. Sci. U.S.A.112,
13296–13301 (2015).
16. K. Bostoenet al.,Curr. Anthropol.56, 354–384 (2015). 17. P. R. Lohet al.,Genetics193, 1233–1254 (2013). 18. D. P. Kwiatkowski,Am. J. Hum. Genet.77, 171–192 (2005). 19. M. Deschampset al.,Am. J. Hum. Genet.98, 5–21 (2016). 20. S. A. Tishkoffet al.,Nat. Genet.39, 31–40 (2007). 21. K. Brycet al.,Proc. Natl. Acad. Sci. U.S.A.107, 786–791 (2010). 22. K. Bryc, E. Y. Durand, J. M. Macpherson, D. Reich,
J. L. Mountain,Am. J. Hum. Genet.96, 37–53 (2015). 23. F. Montinaroet al.,Nat. Commun.6, 6596 (2015). 24. W. Jinet al.,Genome Res.22, 519–527 (2012). 25. G. Bhatiaet al.,Am. J. Hum. Genet.95, 437–444 (2014).
AC K NOW L E D GM E NTS
We thank all participants who donated samples and participated in this study. We thank C. Schlebusch and G. Hellenthal for helpful discussions. We thank E. Soumonni, a historian whose advice guided the recruitment of Beninese individuals, and J.-P. Chippaux (CERPAGE, Cotonou, Benin) for his help with local authorities. We thank the African Variation Genome Project, the Data Access Committee Chair for the National Human Genome Research Institute (particularly V. Ota Wang), the Electronic Medical Records and Genomics (eMERGE)Genome-Wide AssociationStudy, the Multiethnic Cohort Study, the Gene, Environment Association Studies consortium (GENEVA), and the Health Aging and Body Composition (Health ABC) Study for kindly providing access to their data. Detailed acknowledgments can be found elsewhere (10). This work was funded by the Institut Pasteur, the Centre National de la Recherche Scientifique (CNRS), Agence Nationale de la Recherche (ANR) grant AGRHUM (ANR-14-CE02-0003-01), and the“Histoire du Génome des Populations Humaines Gabonaises”project (Institut Pasteur/Republic of Gabon). The newly generated SNP genotype data have been deposited in the European Genome-Phenome Archive under accession code EGAS00001002078.
SUPPLEMENTARY MATERIALS
www.sciencemag.org/content/356/6337/543/suppl/DC1 Materials and Methods
Figs. S1 to S22 Tables S1 to S12 References (26–54)
12 October 2016; accepted 11 April 2017 10.1126/science.aal1988
Patinet al.,Science356, 543–546 (2017) 5 May 2017 4 of 4
Fig. 4. Dissecting the African origins of African Americans. Estimated genetic contribution, indicated by blue circles, of diverse African populations to African Americans of North America (table S11). African populations were chosen to represent the historical ports from which slaves were embarked during the transatlantic slave trade (9). Green bars indicate the western RHG ancestry of African populations and of the African genome of African Americans (fig. S19).
R ES E A RC H | R E P O R T