.
Genetic diversity of populations of the dioecious
Myrsine coriacea
(Primulaceae) in the Atlantic Forest
Roberta Pena da Paschoa
1, Jheniffer Abeldt Christ
1, Cecília Silva Valente
1, Marcia Flores da Silva
Ferreira
1, Fábio Demolinari de Miranda
1, Mário Luís Garbin
2and Tatiana Tavares Carrijo
1*
Received: October 10, 2017 Accepted: February 19, 2018
ABSTRACT
Although a species’ sexual system may influence the genetic diversity of its populations in their natural environment, there have been few such studies involving indigenous species of the Atlantic Forest. Here we study Myrsine coriacea,
a dioecious tree widely used in reforestation programs despite a lack of information about its natural interpopulation genetic variation. To address this knowledge gap, intra- and interpopulation genetic diversity were measured for male and female individuals of ten natural populations using ISSR markers. Greater intrapopulation genetic diversity indicated interpopulation gene flow, regardless of isolation and distance between populations. Multivariate analyses detected significant differences in genetic diversity between populations, but not between males and females, which indicates that genetic diversity did not differ between the two sex morphs. Distance between populations was unrelated to genetic diversity. Myrsine coriacea has not experienced a loss of genetic variability despite the characteristic segregated spatial distribution of its populations. These results suggest that obligatory cross-pollination and dispersal by birds may be important mechanisms for the maintenance of genetic diversity in natural populations of M. coriacea.
Keywords: capororoca, conservation, ISSR, Myrsinaceae, Rapanea
Introduction
A species’ sexual system is one of the most relevant biological traits driving genetic variation in populations of plants. Dioecious or self-incompatible species generally exhibit higher intrapopulation genetic diversity than self-compatible hermaphroditic species (Charlesworth & Charlesworth 1978; Thomson & Barrett 1981). On the one hand, this can be advantageous considering that high genetic variation allows relatively rapid responses to environmental change, facilitating survival under disturbance regimes (Davies et al. 2016). On the other hand, dioecious or self-incompatible species that are sparsely distributed
may be more prone to local extinction than hermaphroditic species, because one of the sexes may be favored, resulting in a skewed sex ratio (Bawa 2004). Considering that most tropical tree species are self-incompatible or dioecious (Bawa 1974; Bawa & Opler 1975), information on the patterns of genetic diversity in these organisms is fundamental for the establishment of better conservation strategies. Despite several studies that have focused on understanding aspects of genetic diversity in tree and dioecious angiosperm species in the tropics (e.g., Gauder & Cavalli-Molina 2000; Viegas
et al. 2011; Schroeder et al. 2014; Silva et al. 2014a; Arruda et al. 2015), the knowledge generated can still be considered insufficient considering the species richness of this region.
1 Programa de Pós-graduação em Genética e Melhoramento, Centro de Ciências Agrárias e Engenharias, Universidade Federal do Espírito Santo, 29500-000, Alegre, ES, Brazil
2 Laboratório de Ecologia Vegetal, Programa de Pós-Graduação em Ecologia de Ecossistemas, Universidade Vila Velha, 29102-770, Vila Velha, ES, Brazil
Genetic diversity corresponds to any measure that quantifies the magnitude of genetic variation within a population of a species (Hughes et al. 2008), and is an important measure of the ability of the population to adapt to environmental change (Reed & Frankham 2003). Given the current scenario of global climate change and modifications to natural ecosystems due to human activities, measuring the genetic diversity of populations is essential for providing information for conservation and management of natural resources, especially in biodiversity hotspots (Schierenbeck 2017). The development of more efficient and less costly molecular markers has made it possible to advance knowledge about the genetic diversity of natural plant populations in the Atlantic Forest (Buzatti et al. 2012; Silva et al. 2014b). However, information on population genetic diversity is still scarce in this highly species-rich biome.
Myrsine coriacea (Primulaceae) is a species of angiosperm characterized by dioecious trees or shrubs (Freitas & Kinoshita 2015) that occur in Central and South America (Tropicos 2017). In Brazil, the species occurs in the Cerrado and the Atlantic Forest biomes (BFG 2015). In the latter, the species can be found in almost all ecosystems, from restingas to high altitude campos (BFG 2015; Freitas & Kinoshita 2015). Individuals of M. coriacea frequently colonize disturbed (such as abandoned pastures) as well as undisturbed (rocky outcrops) open areas (Freitas & Carrijo 2008). Canopy shading by this species contributes to suppression of grasses, and thus facilitates the establishment of seedlings of other angiosperms (Silveira et al. 2013). The pollination mechanisms of this species have not yet been studied, but it is possible that pollination is carried out exclusively by wind, as has already been documented for other species of Myrsine (Otegui & Cocucci 1999; Albuquerque et al. 2013). Myrsine coriacea has a high capacity to produce fruits that are attractive to birds (Pascotto 2007; Jesus & Monteiro-Filho 2007), thus increasing the seed rain below its canopy (Begnini et al. 2013). These characteristics make
M. coriacea one of the most commonly used species in reforestation programs in Brazil (Durigan et al. 2011). The collection of seeds used for this purpose, however, has been performed without considering the genetic variability of natural populations.
Neutral molecular markers are fundamental tools for studying patterns of genetic dispersion (Gonçalves et al. 2014; Melo et al. 2015; Hoeltgebaum et al. 2015). Of all the advantages attributed to inter simple sequence repeats (ISSRs), their most outstanding characteristic is a high efficiency for the detection of polymorphisms among taxa or genotypes. Other advantages of ISSRs for population studies are related to the ability of these markers to detect polymorphisms when the DNA sequence of the studied organism is unknown (Kumar et al. 2006)and its low cost (Santana et al. 2011), which make them especially interesting for prospective studies of genetic diversity. These markers have been widely used in studies of genetic diversity with
a focus on natural populations (Ansari et al. 2012; Yin et al. 2014; Moraes et al. 2015; Noroozisharaf et al. 2015).
Here we measure both intrapopulation and interpopulation genetic diversity of male and female individuals of Myrsine coriacea in natural populations of the Atlantic Forest. Intrapopulation genetic diversity is expected to be higher than interpopulation genetic diversity, which is a common feature of cross-pollinated species (Loveless & Hamrick 1984). For this reason, low divergence between males and females is expected within each population, and among populations that are geographically closer to each other. Therefore, we measured or estimated: (1) magnitude and distribution of intrapopulation genetic diversity of males and females; (2) pairwise genetic dissimilarity among individuals within populations; (3) gene flow and degree of differentiation among populations; and (4) spatial structure of genetic diversity.
Materials and methods
Studied species and sampling procedures
Myrsine coriacea (Sw.) R. Br. Ex Roem. & Schult. has an arboreal or shrub habit, varying from 1.5-15 m in height, with characteristic candelabriform branches. Leaves vary in size, are alternate and without stipules, and usually possess lanceolate leaf blades. Flowers are pentamerous and develop as glomeriform inflorescences and ramifloras (Freitas & Carrijo 2008; Freitas et al. 2009). We sampled 249 individuals distributed among 10 natural populations. Each population is in a different municipality in the southern region of the state of Espírito Santo, southeastern Brazil (Fig. 1). We numbered the study populations from 1 to 10 (Tab. 1). Myrsine coriacea is a pioneer species and individuals form isolated populations with characteristic spatial aggregation. Each population included in this study was located within a single vegetation patch.
Field expeditions were carried out between August and December 2015, during the flowering period of the species so that female and male individuals could be distinguished by their flowers. The following criteria were adopted for collecting the material for molecular study: (1) only adults in the reproductive phase were included; and (2) only male and female individuals with similar heights and stem diameters were included. Leaf samples of each individual were collected in the field and packed in sealed paper together with silica gel. In the laboratory, the samples were stored for at least 24 hours in a freezer at -30 °C. After this period, the samples were lyophilized for 48h and stored in boxes with silica gel.
Molecular analysis
observe DNA integrity. After initial screening of 32 ISSR primers, seven were selected on the grounds of them having the largest number of polymorphic fragments and quality amplified bands (Tab. 2).
PCR for amplification of DNA fragments was performed in a total volume of 15 μL containing 1X PCR Master Mix (Thermo scientific), 0.3 μM primer, 1 U (unit) Taq DNA polymerase and 30 ng DNA. The reactions were carried out under the following conditions: 5 minutes of denaturation at 94 ºC, followed by 40 annealing cycles. The annealing cycles consisted of three stages: a) 1 minute at 94 ºC, b) 1 minute at 50 ºC and c) 1 minute at 72 ºC, with a final extension step of 2 minutes at 72 °C. The optimal number of markers (loci) needed to discriminate genotypes followed Kruskal (1964) and Silveira et al. (2003) considering the Jaccard index.
Data analysis
Monomorphic and polymorphic bands were coded as absence (0) and presence (1) of a marker. Polymorphic loci of the seven selected primers were used to generate an array of binary data. Genetic distance among individuals was estimated according to the Jaccard Index Arithmetic Complement (Sneath & Sokal 1973), using the software Genes (Cruz 2013). Considering that coincident bands can be expected in studies performed with individuals of the same species, the use of the Jaccard coefficient is recommended (Borém & Fritsche-Net 2014). Nei’s genetic diversity (H’), Shannon index (I), percentage of polymorphic loci (P) and coefficient of genetic divergence between populations (GST) were calculated using the program Popgene 3.2. Genetic divergence between populations was additionally estimated by an AMOVA with three hierarchical levels using the program Arlequin 3.1 (Excoffier & Lischer 2010).
The approach proposed in McDermott & McDonald (1993), which is based on the F-statistics theory proposed by Wright (1951), was used to obtain an indirect estimate of the gene flow among populations, calculated with the software Popgene 3.2. Population structure was evaluated by Markov Chain Monte Carlo (MCMC) simulations using the multilocus genotypes of individuals to detect probable genetic groups (K), assuming a mixed population model. The number of established populations (K), followed by independent runs for each value of K, was obtained with the program STRUCTURE 2.3.4 (Pritchard et al. 2000).
Multivariate analyses were used to compare male and female individuals between and within populations. Analysis of variance using permutation tests (PERMANOVA; Anderson 2001) was used to verify whether male and female
M. coriacea occupy different positions in multidimensional space for each locality (totaling 10 tests). For these tests, one factor (sex) and two levels (male or female) were used. A dissimilarity matrix was constructed for each population based on a matrix of individuals per band. The complement of the Jaccard coefficient was used as a measure of distance between individuals. Significance values were calculated
by permutation (999 iterations) with alpha = 0.05. A two-factor test was run for the entire dataset using sex (male and female) and locality (10 levels) as factors, as well as their interaction. We also tested whether the differences among STRUCTURE groups were related to differences in the location of the groups in multivariate space.
Differences among groups may be due not only to the location of the objects (in our case, individuals) in multivariate space, but also could be a consequence of a dispersal effect (Warton et al. 2012). A test for homogeneity
of the multivariate dispersion (PERMDISP; Anderson 2006) was used to identify whether differences were due to the dispersion of the objects around their centroids. Boxplots were constructed based on the distances of objects (individuals) relative to the centroids of male and female levels within each locality. This allowed us to visualize which group of individuals was more dispersed or variable.
Principal coordinate analysis (PCoA) was used as an ordination method to visualize the individual patterns of bands in two-dimensional space. This was done within each locality and for the entire dataset (all localities). Individual males and females were identified in plots by different letters. Finally, a Mantel test (Legendre & Legendre 2012) was used to evaluate the association between genetic differentiation (ΦST) between populations and the geographical distances between them. Multivariate analyses were performed in R (R Core Team 2015) using the package Vegan (Oksanen
et al. 2017).
Results
Primer selection
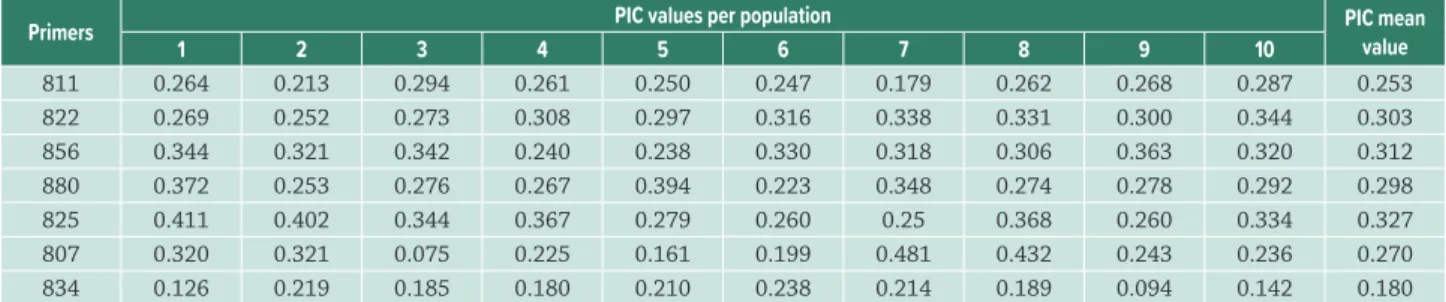
The seven selected primers produced 43 fragments, of which 93 % were polymorphic. The number of fragments obtained per primer varied from four to nine (average = 6.14 bands per primer) (Tab. 2). Markers 825 and 834 had the highest and the lowest polymorphic information content (PIC), respectively. The optimal number of markers amplified by the ISSR primers was estimated at 38, with a stress value less than 0.05 and a correlation of 0.947. The polymorphic information content (PIC) was quantified separately for each population (Tab. 3). The highest value was recorded for population 7 (PIC = 0.481) and the lowest for population 9 (PIC = 0.094).
Genetic diversity, gene flow and population structure
Table 1.Localities of the ten natural Myrsine coricea populations studied, the code used to identify each population, the geographical coordinates, and the elevation (minimum and maximum) of each locality.
Population Code Locality (Municipality) Latitude Longitude Elevation (m)
Min Max
1 Alegre 20°45’21”S 41°23’72”W 752 823
2 Mimoso do Sul 20°59’35”S 41°21’08”W 917 977
3 Castelo 20°30’59”S 41°05’03”W 1117 1158
4 Dores do Rio Preto (Macieira) 20°26’53”S 41°49’57”W 1774 1868
5 Domingos Martins 20°23’38”S 41°01’36”W 1270 1302
6 Iúna 20°22’ 59”S 41°31’23”W 1093 1109
7 Vargem Alta 20°37’ 33”S 41°07’37”W 863 872
8 Venda Nova 20º21’28”S 41º11’11”W 851 867
9 Muqui 20º53’40S 41º20’12”W 639 646
10 Dores do Rio Preto (Casa queimada) 20º27’27”S 41º48’38”W 2370 2532
Table 2.Seven ISSR primers selected for amplification of DNA fragments from the ten natural Myrsine coriacea populations studied. TBN - Total number of amplified bands (including all populations); PBP - percentage of polymorphic bands; MW - maximum and
minimum molecular weight of the fragments obtained; PIC - polymorphic information content (see Roldan-Ruiz et al. 2000) based
on 1Kb marker. * Values in parenthesis refer to monomorphic bands.
Primers Sequences (5’-3’) TBN PBP PM (max-min) PIC
807 AGA GAG AGA GAG AGA GT 4 100 % 750 - 300 0.317
811 GAG AGA GAG AGA GAG AC 5(1) 80 % 1000 - 350 0.282
822 TCT CTC TCT CTC TCT CA 5(1) 80 % 1000 - 400 0.322
825 AGA GAG AGA GAG A GA GYT 7 100 % 1500 - 350 0.384
834 AGA GAG AGA GAG AGA GYA 6(1) 83.33 % 750 – 200 0.192
856 ACA CAC ACA CAC ACA CYA 9 100 % 1400 - 400 0.340
880 GGA GAG GAG AGG AGA 7 100 % 900 - 300 0.324
Mean - 6.14 92 % 685.71 0.308
Table 3. List of primer used and their polymorphic information content (PIC) for each of the ten studied natural populations of
Myrsine coriacea. 1 – Alegre; 2 – Mimoso do Sul; 3 – Castelo; 4 – Dores do Rio Preto (Macieira); 5 – Domingos Martins; 6 – Iúna; 7 –
Vargem Alta; 8 – Venda Nova do Imigrante; 9 – Muqui; 10 – Dores do Rio Preto (Casa Queimada).
Primers PIC values per population PIC mean
value
1 2 3 4 5 6 7 8 9 10
811 0.264 0.213 0.294 0.261 0.250 0.247 0.179 0.262 0.268 0.287 0.253
822 0.269 0.252 0.273 0.308 0.297 0.316 0.338 0.331 0.300 0.344 0.303
856 0.344 0.321 0.342 0.240 0.238 0.330 0.318 0.306 0.363 0.320 0.312
880 0.372 0.253 0.276 0.267 0.394 0.223 0.348 0.274 0.278 0.292 0.298
825 0.411 0.402 0.344 0.367 0.279 0.260 0.25 0.368 0.260 0.334 0.327
807 0.320 0.321 0.075 0.225 0.161 0.199 0.481 0.432 0.243 0.236 0.270
834 0.126 0.219 0.185 0.180 0.210 0.238 0.214 0.189 0.094 0.142 0.180
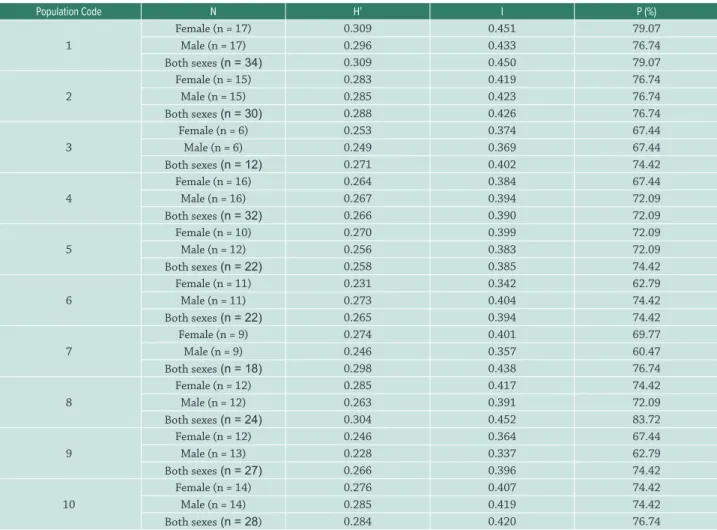
intrapopulation genetic diversity of females was recorded for population 6 (I=0.342; H’=0.231) and of males for population 9 (I=0.337; H’=0.228). The two indices revealed similar results, with only a few exceptions (populations 3, 7, 8, and 9) where diversity was higher when males and females were analyzed together.
When males and females were analyzed together, the percentage of polymorphism (Tab. 4) ranged from 72 % to 83 %. For the separate sexes, the percentage of polymorphism ranged from 60 % to 79 % (females) and from 60 % to 76 % (males). In general, the percentage of polymorphism was higher when analyzing males and females together, especially in populations 3, 7, 8 and 9. The overall genetic differentiation among populations (ΦST) was 0.121. The coefficient of genetic divergence among populations (GST) was 0.107, and thus very similar to the value of ΦST.
The AMOVA revealed that intrapopulation genetic diversity was higher (87 %) than interpopulation genetic diversity. Genetic differentiation among almost all localities was low (1.63 %). The genetic divergence among populations within groups was 10.45. The mean value of gene flow for all populations was 4.18. Pairwise comparisons of genetic differentiation (ΦST) ranged from 0.0051 to 0.1865 (Tab. S1 in supplementary material). The STRUCTURE analysis indicated moderate genetic differentiation (Fig. 2). The Mantel test revealed no correlation between genetic and geographic distances (r=0.06, p=0.181).
Multivariate comparisons
supplementary material). Considering the entire data set and the two factors (sex and locality), significant differences were detected among populations, but not between sexes, and there was no significant interaction between the two factors (PERMANOVA, Tab. 5). Data dispersion did not differ between sexes (Fig. S3 in supplementary material), in contrast to localities, for which differences in dispersion were significant (PERMDISP, Tab. 5). Differences among the groups detected by STRUCTURE were significant both for location and dispersion (Tab. 5). These results agree with the group structure generated by STRUCTURE. In general, male and female individuals did not form distinctive groups within each locality. The PCoA graph for the two groups defined by STRUCTURE separated populations 1 to 4 (group 1) from populations 6 to 10 (group 2) (Fig. 3).
Discussion
The results indicate high levels of polymorphism and genetic diversity in M. coriacea. The high intrapopulation
genetic diversity compared to the moderate interpopulation genetic differentiation indicates historical gene flow among populations, regardless of their distance or isolation. The two STRUCTURE groups do not represent contrasting geographic regions with respect to phytophysiognomic or environmental aspects (e.g., elevation, temperature). An analysis of genetic diversity separately for males and females also did not indicate genetic differences between sex morphs. These results suggest that genetic drift is not causing great differences between populations. This may be explained, at least in part, by high gene flow due to anemophily (wind pollination) as well as to ornithochory (bird-mediated dispersal) of seeds.
The proportion of polymorphic loci detected for populations of M. coriacea was similar to the values detected for Gaultheria fragrantissima (86 %), which is also a dioecious
shrub, usually found on forest edges (Apte et al. 2006). Interestingly, even herbaceous species of Primulaceae have a high proportion of polymorphic loci, ranging from 76 to 83 % in Androsace tapete (Geng et al. 2009), and from 58 to 64 % in Primula interjacens (Xue et al. 2004). Like M.
Table 4. Within-population genetic diversity in ten populations of Myrsine coriacea. N = number of individuals from each locality; H’ = Nei’s genetic diversity (Nei 1973); I = Shannon’s genetic diversity index (Lewontin 1972); P - percentage of polymorphism. 1 – Alegre; 2 – Mimoso do Sul; 3 – Castelo; 4 – Dores do Rio Preto (Macieira); 5 – Domingos Martins; 6 – Iúna; 7 – Vargem Alta; 8 – Venda Nova do Imigrante; 9 – Muqui; 10 – Dores do Rio Preto (Casa Queimada).
Population Code N H’ I P (%)
1
Female (n = 17) 0.309 0.451 79.07
Male (n = 17) 0.296 0.433 76.74
Both sexes (n = 34) 0.309 0.450 79.07
2
Female (n = 15) 0.283 0.419 76.74
Male (n = 15) 0.285 0.423 76.74
Both sexes (n = 30) 0.288 0.426 76.74
3
Female (n = 6) 0.253 0.374 67.44
Male (n = 6) 0.249 0.369 67.44
Both sexes (n = 12) 0.271 0.402 74.42
4
Female (n = 16) 0.264 0.384 67.44
Male (n = 16) 0.267 0.394 72.09
Both sexes (n = 32) 0.266 0.390 72.09
5
Female (n = 10) 0.270 0.399 72.09
Male (n = 12) 0.256 0.383 72.09
Both sexes (n = 22) 0.258 0.385 74.42
6
Female (n = 11) 0.231 0.342 62.79
Male (n = 11) 0.273 0.404 74.42
Both sexes (n = 22) 0.265 0.394 74.42
7
Female (n = 9) 0.274 0.401 69.77
Male (n = 9) 0.246 0.357 60.47
Both sexes (n = 18) 0.298 0.438 76.74
8
Female (n = 12) 0.285 0.417 74.42
Male (n = 12) 0.263 0.391 72.09
Both sexes (n = 24) 0.304 0.452 83.72
9
Female (n = 12) 0.246 0.364 67.44
Male (n = 13) 0.228 0.337 62.79
Both sexes (n = 27) 0.266 0.396 74.42
10
Female (n = 14) 0.276 0.407 74.42
Male (n = 14) 0.285 0.419 74.42
Table 5. Results of the multivariate tests for location (PERMANOVA) and dispersion (PERMDISP) for the entire dataset considering two factors (sex and locality) and the interaction between them. Between groups results refer to the two groups of populations identified by STRUCTURE. Significant values highlighted in bold (P <0.05).
Factors PERMANOVA PERMDISP
gl F R2 P gl F P
Sex 1 0.76 0.003 0.695 1 0.86 0.388
Locality 9 5.64 0.180 0.001 9 2.52 0.015
Sex: Locality 9 0.73 0.020 0.981 - -
-Between groups 1 17.67 0.070 0.001 1 6.59 0.009
Figure 2.Graphical representation of the Bayesian analysis STRUCTURE performed for 249 individuals from ten natural populations of Myrsine coriacea based on molecular data obtained from the amplification profiles of seven ISSR markers. The vertical lines delimit the localities. The value of K=2 shows two moderately structured populations: G1 (green): 1 to 4; G2 (red): 5 to 10. 1 - Alegre; 2 - Mimoso do Sul; 3 - Castelo; 4 - Dores do Rio Preto (Macieira); 5 - Domingos Martins; 6 - Iúna; 7 - Vargem Alta; 8 - Venda Nova do Imigrante; 9 – Muqui; 10 – Dores do Rio Preto (Casa Queimada).
coriacea, these species have a gregarious spatial distribution and are perennial with mandatory cross-pollination, but differ in habit and their continuous spatial distribution. The different proportions of polymorphic loci detected among the studied populations may be influenced by different patterns of spatial aggregation (distance among individuals) within each population. Population 4, which formed a small and distinct population with only small spatial distances between individuals was the least polymorphic. This population may have originated from a single dispersal event (founder effect), or from the same parent plants. In contrast, populations 1 and 8 were the most polymorphic.
The within-population genetic diversity of M. coriacea
(I=0.385 - 0.450 and H’=0.258 - 0.309) was high when compared to those reported for perennial species and obligate cross-pollinators of Primulaceae, such as Primula apennina (I=0.27 to 0.35 and H’=0.17 to 0.23; Crema et al. 2009) and Primula obconica (I=0.04 to 0.3 and H’=0.03 to 0.20; Nan et al. 2003). The mating system can affect these results. High intrapopulation genetic variation in M. coriacea is expected because dioecious species in natural environments tend to have high intrapopulation genetic diversity, and low genetic differentiation between populations, due to obligatory cross-pollination (Hamrick & Godt 1996). The existence of significant genetic variability is of fundamental importance not only for the conservation of the species, but also to guarantee vigor and resistance in progeny (Booy et al. 2000). This is an important aspect when selecting matrices for restoration purposes.
Multivariate and interpopulation diversity analyses indicated significant genetic divergence between populations. The moderate genetic differentiation among the ten studied populations indicated by the values of ɸST = 0.121 and GST = 0.107 (Hartl & Clark 2010), suggests the beginning of the process of differentiation between populations. High levels of genetic differentiation (Gst=0.676) were also reported for ten populations of the ericaceous species Chamaedaphne calyculata (Szczecińska et al. 2009). This perennial shrub
is patchily distributed (similar to M. coriacea), but has bisexual flowers and capsulate fruits with limited dispersal capacity compared with ornithochoric fruits. Wang et al. (2014) suggest a similar pattern for natural populations of Primula cicutariifolia, which have higher levels of genetic
differentiation (GST = 0.71), compared to the results reported here for M. coriacea. Primula cicutariifolia is a biannual herb with capsular fruits, whose seeds have limited capacity for wind dispersal compared with ornithochoric diaspores, such as those of Myrsine. Another important feature of
P. cicutariifolia is that its flowers are homostylic (anthers
and stigma are on the same level) and are self-compatible, allowing for self-fertilization. Its flowers are small, without nectar, embedded in the leaves and are poorly visited by insects, hindering cross-pollination. Consequently, gene flow between and within populations via pollen and seeds is limited.
were recorded for populations 1 and 2 (ɸST=0.005), which are 59 km each other (measured in a straight line). Although these contrasting values suggest a correlation between genetic and geographic distances in M. coriacea populations,
the Mantel test did not support such a relationship for the ten populations studied. The degree of genetic differentiation can provide an estimate of historical gene flow among populations. Efficient pollen and seed dispersal favors gene flow, increases genetic variation within populations and decreases divergence among them. Therefore, species whose pollinator agents and dispersers cause dispersal of pollen and seeds over long distances (such as wind or large animals) tend to exhibit higher intrapopulation genetic variability as well as greater gene flow between populations (Mori 2003). It is therefore reasonable to assume that possible pollination by wind and the mainly bird-dispersed seeds of
M. coriacea provide sufficient gene flow to counteract the effects of genetic drift.
The similar values for genetic diversity found between male and female individuals of M. coriacea may be the result
of a balanced sex ratio in the species. Organisms with sexual reproduction tend to have a 1:1 sex ratio (Fisher 1930), deviations from which decrease the demographic effective population size (Vencovsky et al. 2012). When genetic
diversity is high and the sex ratio of a species is 1:1, the effects of genetic drift are minimized and do not cause an imbalance of genetic diversity between sexual morphs. Thus, the balanced genetic diversity between sexual morphs may be contributing to the high overall genetic diversity of M. coriacea populations.
The obligatory cross-pollination and dispersl by birds may have an influence on the maintenance of genetic diversity in natural populations of this species. Geographic distance and genetic differentiation among populations were unrelated, probably due to gene flow facilitated by possible wind pollination and fruit dispersal by birds. Considering that genetic structure is an important prerequisite for the efficient management of plant species, our results suggest that the studied populations could be potential sources of seeds for reforestation projects.
Acknowledgements
Fundação de Amparo à Pesquisa do Espírito Santo - FAPES - and VALE (grant: 525/2016) for research project financial support; FAPES - by the scholarship granted to C.S. Valente and J.A. Christ; Coordenação de Aperfeiçoamento de Pessoal de Nível Superior - CAPES - by the scholarship granted to R.P. Paschoa; Conselho Nacional de Desenvolvimento Científico e Tecnológico - CNPq - by the grant to M.F. Ferreira (311950/2016-7) and T.T. Carrijo (05821/2016-4).
References
Albuquerque AAE, Lima HA, Gonçalves-Esteves V, Benevides CR, Rodarte ATA. 2013. Myrsine parvifolia (Primulaceae) in sandy coastal plains marginal to Atlantic rainforest: a case of pollination by wind or by both wind and insects? Brazilian Journal of Botany 36: 65-73. Anderson MJ. 2001. A new method for non-parametric multivariate
analysis of variance. Austral Ecology 26: 32-46.
Anderson MJ. 2006. Distance-based tests for homogeneity of multivariate dispersions. Biometrics 62: 245-253.
Ansari SA, Narayanan C, Wali SA, Kumar R, Shukla N, Kumar SR. 2012. ISSR markers for analysis of molecular diversity and genetic structure of Indian teak (Tectona grandis L.f.) populations. Annals of Forest Research 55: 11-23.
Apte GS, Bahulikar RA, Kulkarni RS, et al. 2006. Genetic diversity analysis in Gaultheria fragrantissima Wall. (Ericaceae) from the two biodiversity hotspots in India using ISSR markers. Current Science 91: 1634-1640. Arruda CCB, Silva MB, Sebbenn AM, Kanashiro M., Lemes MR, Gribel
R. 2015. Mating system and genetic diversity of progenies before and after logging: a case study of Bagassa guianensis (Moraceae), a low-density dioecious tree of the Amazonian forest. Tree Genetics & Genomes11: 3.
Bawa KS. 1974. Breeding systems of tree species of a lowland tropical community. Evolution 28: 85-92.
Bawa KS. 2004. Impacts of global changes on reproductive biology of trees in tropical dry forests. In: Frankie GW, Mata A, Vinson SB. (eds.) Biodiversity conservation in Costa Rica – Learning the lessons in a seasonal dry forest. Berkeley/ Los Angeles, University of California Press. p. 34-47.
Bawa KS, Opler PA. 1975. Dioecism in tropical forest trees. Evolution 29: 167-179.
Begnini RM, Silva FR, Castellani TT. 2013. Fenologia reprodutiva de
Syagrus romanzoffiana (Cham.) Glassman (Arecaceae) em Floresta Atlântica no sul do Brasil. Biotemas 4: 53-60.
BFG – Brazil Flora Group. 2015. Growing knowledge: an overview of seed plant diversity in Brazil. Rodriguésia 66: 1085-1113.
Booy G, Hendriks RJJ, Smulders MJM, Groenendael JM, Vosman B. 2000. Genetic diversity and the survival of populations. Plant Biology 2: 379-395.
Borém A, Fritsche-Neto R. 2014. Biotechnology and plant breeding: applications and approaches for developing improved cultivars. 1st. edn. London/ Waltham/ San Diego, Elsevier.
Buzatti RSO, Ribeiro RA, Lemos Filho JP, Lovato MB. 2012. Fine-scale spatial genetic structure of Dalbergia nigra (Fabaceae), a threatened and endemic tree of the Brazilian Atlantic Forest. Genetics and Molecular Biology 35: 838-846.
Charlesworth BE, Charlesworth D. 1978. A model for the evolution of dioecy and gynodioecy. The American Naturalist112: 975-997. Crema S, Cristofolini G, Rossi M, Rossi M, Conte L. 2009. High genetic
diversity detected in the endemic Primulaapennina Widmer (Primulaceae) using ISSR fingerprinting. Plant Systematic and Evolution 280: 29-36.
Cruz CD 2013. Genes - a software package for analysis in experimental statistics and quantitative genetics. Acta Scientiarum 35: 271-276.
Davies ID, Cary GJ, Landguth EL, Lindenmayer DB, Banks SC. 2016. Implications of recurrent disturbance for genetic diversity. Ecology and Evolution 6: 1181-1196.
Doyle JJ, Doyle JL. 1990. Isolation of plant DNA from fresh tissue. Focus 12: 13-15.
Durigan G, Melo ACG, Max JCM, Vilas-Boas OV, Contieri WA, Ramos VS. 2011. Manual para recuperação da vegetação de cerrado. São Paulo, Páginas & Letras Editora e Gráfica.
Excoffier L, Lischer H. 2010. Arlequin suite ver 3.5: a new series of programs to perform population genetics analyses under Linux and Windows. Molecular Ecology Resources 10: 564-567.
Fisher RA. 1930. The genetical theory of natural selection. London, Oxford University Press.
Freitas MF, Carrijo TT 2008. A família Myrsinaceae nos contrafortes do Maciço da Tijuca e contrafortes do Jardim Botânico do Rio de Janeiro, Brasil. Rodriguésia 59: 813-828.
Freitas MF, Carrijo TT, Leão LC 2009.Flora da Serra do Cipó: Myrsinaceae. Boletim de Botânica da Universidade de São Paulo 27: 259-267. Freitas MF, Kinoshita LS. 2015. Myrsine (Myrsinoideae-Primulaceae) no
sudeste e sul do Brasil. Rodriguésia 66: 167-189.
Gauder L, Cavalli-Molina S. 2000. Genetic variation in natural populations of mate (Ilex paraguariensis A. St.-Hil., Aquifoliaceae) using RAPD markers. Heredity 84: 647-656.
Geng YP, Tang SQ, Tashi T, et al. 2009. Fine- and landscape-scale spatial genetic structure of cushion rock jasmine, Androsace tapete
(Primulaceae), across southern Qinghai-Tibetan Plateau. Genetica 135: 419-427.
Gonçalves LO, Pinheiro JB, Zucchi MI, Silva-Mann R. 2014. Caracterização genética de mulungu (Erythrina velutina Willd.) em áreas de baixa ocorrência. Revista Ciência Agronômica 45: 290-298.
Hamrick JL, Godt MJ. 1996. Effects of life history traits on genetic diversity in plant species. Philosophical Transactions of the Royal Society B: Biological Sciences 351: 1291-1298.
Hartl DL, Clark AG. 2010. Princípios de Genética de Populações. 4th. edn. Porto Alegre, Editora Artmed.
Hoeltgebaum MP, Bernardi AP, Montagna T, Reis MS. 2015. Diversidade e estrutura genética de populações de Varronia curassavica Jacq. em restingas da Ilha de Santa Catarina. Revista Brasileira de Plantas Medicinais 17: 1083-1090.
Hughes AR, Inouye BD, Johnson MTJ, Underwood N, Vellend M. 2008. Ecological consequences of genetic diversity. Ecology Letters 11: 609-623.
Jesus S, Monteiro-Filho ELA. 2007. Frugivoria por aves em Schinus terebinthifolius (Anacardiaceae) e Myrsine coriacea (Myrsinaceae). Revista Brasileira de Ornitologia 15: 585-591.
Kruskal JB. 1964. Multidimensional scaling by optimizing goodness of fit to a nonmetric hypothesis. Psychometrika 29: 1-27.
Kumar A, Arya L, Kumar V, Sharma S. 2006. Inter simple sequence repeat (ISSR) analysis of cytoplasmic male sterile, male fertile lines and hybrids of pearl millet (Pennisetumglaucum (L.) R Br.). Indian Journal of Crop Science 1: 117-119.
Legendre P, Legendre L. 2012. Numerical ecology. 3rd. edn. Amsterdam, Elsevier.
Lewontin RC. 1972. The apportionment of human diversity. Evolutionary Biology 6: 381-398.
Loveless MD, Hamrick JL. 1984. Ecological determinants of genetic structure in plant populations. Annual Review of Ecology and Systematics 15: 65-95.
McDermott JME, McDonald BA. 1993. Gene flow in plant path systems. Annual Review Phytopathology 31: 353-373.
Melo ATO, Coelho ASG, Pereira MF, Blanco AJV, Franceschinelli EV. 2015. Genética da conservação de Cabralea canjerana (vell.) Mart. (Meliaceae) em fragmentos florestais de Mata Atlântica na APA Fernão Dias. Revista Árvore 39: 365-374.
Mori ES. 2003. Genética de populações arbóreas: orientações para seleção e marcação de matrizes. Instituto Florestal. Série Registros 25: 35-44. Nan P, Shi S, Chunjie T, Peng S, Tian C, Zhong Y. 2003. Genetic Diversity in Primula obconica (Primulaceae) from Central and South-west China as Revealed by ISSR Markers. Annals of Botany 91: 329-333. Noroozisharaf A, Hatamzadeha A, Lahijib HS, Bakhshi D. 2015. Genetic
diversity of endangered primrose (Primulaheterochroma Stapf.) accessions from Iran revealed by ISSR and IRAP markers. Scientia Horticulturae 190: 173-178.
Oksanen J, Blanchet FG, Kindt R, et al. 2017. vegan: Community Ecology Package. R package, version 2.2-1. https://cran.r-project.org/web/ packages/vegan/index.html. 1 Mar. 2017.
Otegui M, Cocucci A. 1999. Flower morphology and biology of Myrsine laetevirens, structural and evolutionary implications of anemophily in Myrsinaceae. Nordic Journal of Botany 19:71-85.
Pascotto MC. 2007. Rapanea ferruginea (Ruiz & Pav.) Mez (Myrsinaceae) como importante fonte alimentar para as aves em uma mata de galeria no interior do Estado de São Paulo. Revista Brasileira de Zoologia 24: 735-741.
Pritchard JK, Stephens ME, Donnelly P. 2000. Inference of population structure using multilocus genotype data. Genetics 155: 945-959. R Core Team. 2015. R: A language and environment for statistical
computing. Vienna, R Foundation for Statistical Computing. https:// www.R-project.org/. 1 Mar. 2017.
Reed DH, Frankham R. 2003. Correlation between fitness and genetic diversity. Conservation Biology 17: 230-237.
Roldan-Ruiz I, Dendauw J, Bockstaele E, Depicker A, Loose M. 2000. AFLP markers reveal high polymorphic rates in ryegrasses (Lolium
spp.). Molecular Breeding 6: 125-134.
Santana IBB, Oliveira EJ, Soares-Filho WS, et al. 2011. Variabilidade genética entre acessos de umbu-cajazeira mediante análise de marcadores ISSR. Revista Brasileira de Fruticultura 33: 868-876.
Schierenbeck KA. 2017. Population-level genetic variation and climate change in a biodiversity hotspot. Annals of Botany 119: 215-228. Schroeder JW, Hoa TT, Dicka CW. 2014. Fine scale spatial genetic
structure in Pouteria reticulata (Engl.) Eyma (Sapotaceae), a dioecious, vertebrate dispersed tropical rain forest tree species. Global Ecology and Conservation 1: 43-49.
Silva AVC, Freire KCS, Lédo AS, Rabbani ARC. 2014a. Diversity and genetic structure of jenipapo (Genipa americana L.) Brazilian accessions. Scientia Agricola 71: 387-393.
Silva CA, Vieira MF, Carvalho-Okano RM, Oliveira LO. 2014b. Reproductive success and genetic diversity of Psychotria hastisepala (Rubiaceae) in fragmented Atlantic Forest, Southeastearn Brazil.Revista de Biología Tropical 62: 309-319.
Silveira SB, Neves EJM, Capanezzi AA, Britez RM. 2013. Avaliação silvicultural de Rapanea ferruginea e Cithare myrianthum plantadas em pastagens abandonadas. Pesquisa Florestal Brasileira 33: 99-102.
Silveira SR, Ruas PM, Ruas CF. 2003. Assessment genetic variability within and among coffee progenies and cultivars using RAPD markers. Genetics and Molecular Biology 26: 329-336.
Sneath PHA, Sokal RR. 1973. Numerical taxonomy; the principles and practice of numerical classification. San Francisco, WH Freeman. Szczecińska M, Sawicki J, Wąsowicz K, Hołdyński C. 2009. Genetic variation
of the relict and endangered population of Chamaedaphne calyculata
(Ericaceae) in Poland. Dendrobiology 62: 23-33.
Thomson JDE, Barrett SCH. 1981. Selection for outcrossing, sexual selection and evolution of dioecy in plants.The American Naturalist 118: 443-449.
Tropicos 2017. Tropicos.org. St. Louis, Missouri Botanical Garden. http:// www.tropicos.org. 8 Feb. 2017.
Vencovsky R, Chaves LJ, Crossa J. 2012. Variance effective size for dioecious species. Crop Science 52: 79-90.
Viegas MP, Silva CLSP, Moreira JP et al. 2011. Diversidade genética e tamanho efetivo de duas populações de Myracrodruon urundeuva Fr. All., sob conservação ex situ. Revista Árvore 35: 769-779.
Wang DY, Chen YJ, Zhu HM, LV GS, Zang XP, Shao JW. 2014. Highly differentiated populations of the narrow endemic and endangered species Primula cicutriifolia in China revealed by ISSR and SSR. Biochemical Systematics and Ecology53: 59-68.
Warton DI, Wright ST, Wang Y. 2012. Distance-based multivariate analyses confound location and dispersion effects. Methods in Ecology and Evolution 3: 89-101.
Wright S. 1951. The genetical structure of populations. Annals of Eugenics 15: 323-354.
Xue DW, Ge XJ, Hao G, Zhang CQ. 2004. Genetic Diversity in a Rare Narrowly Endemic Primrose Species: Primula interjacens by ISSR Analysis. Acta Botanica Sinica 46: 1163-1169.