www.sciencemag.org/content/356/6337/543/suppl/DC1
Supplementary Materials for
Dispersals and genetic adaptation of Bantu-speaking populations in
Africa and North America
Etienne Patin,* Marie Lopez, Rebecca Grollemund, Paul Verdu, Christine Harmant,
Hélène Quach, Guillaume Laval, George H. Perry, Luis B. Barreiro, Alain Froment,
Evelyne Heyer, Achille Massougbodji, Cesar Fortes-Lima, Florence Migot-Nabias,
Gil Bellis, Jean-Michel Dugoujon, Joana B. Pereira, Verónica Fernandes,
Luisa Pereira, Lolke Van der Veen, Patrick Mouguiama-Daouda,
Carlos D. Bustamante, Jean-Marie Hombert, Lluís Quintana-Murci*
*Corresponding author. Email: epatin@pasteur.fr (E.P.); quintana@pasteur.fr (L.Q.-M.)Published 5 May 2017, Science356, 543 (2017) DOI: 10.1126/science.aal1988
This PDF file includes:
Materials and Methods Figs. S1 to S22
References
Other Supplementary Material for this manuscript includes the following:
(available at www.sciencemag.org/cgi/content/full/356/6337/543/DC1)
Materials and Methods
Population samples. A large-scale sampling campaign was conducted in Gabon in 2003, by linguists specializing in Bantu languages. Blood samples were collected from 19 well-characterized Bantu-speaking populations (BSPs) (26, 27). Additional samples were collected to complete population coverage in western central Africa and the ports historically involved in the transatlantic slave trade, in Cameroon, Gabon, Angola, Benin and Ivory Coast. The geographic location, linguistic affiliation, lifestyle and sample sizes of all populations are presented in table S1. Informed consent was obtained from all participants. This study was approved by the institutional review board of Institut Pasteur, France (2011-54/IRB/6).
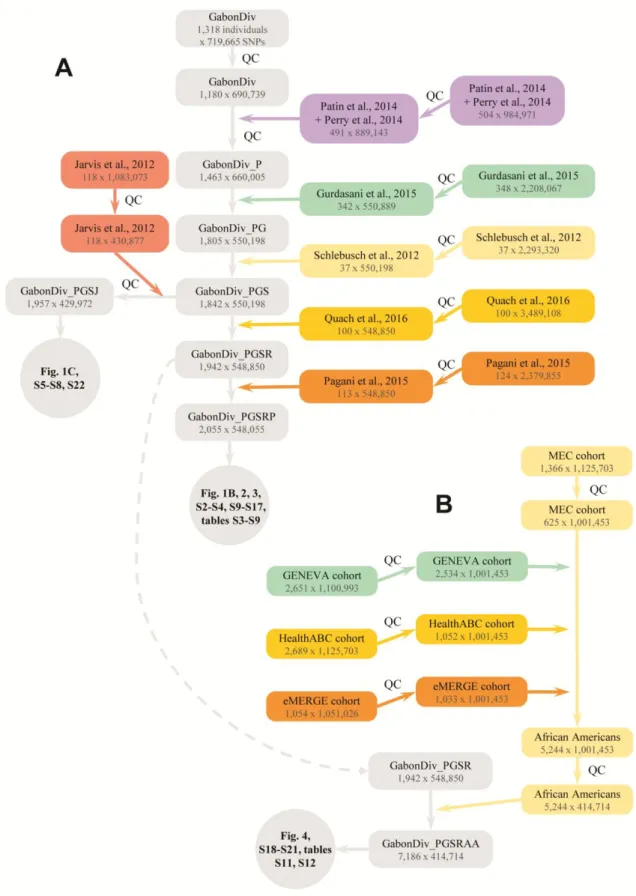
Genotyping and quality-controls. We genotyped 1,318 individuals from 35 populations with the Illumina HumanOmniExpress-12 array. Genotype clustering was performed with Genome Studio v.2011.1 (Illumina) with the manifest v.1.1 B. SNPs presenting low GenTrain scores (<0.35) were inspected and their genotype clusters were manually redefined, when applicable. Of the 719,665 SNPs genotyped, we excluded 1,204 unmapped SNPs, 16,092, 1,372 and 463 SNPs on the X chromosome, Y chromosome and pseudo-autosomal region, respectively, 2,122 C/G or A/T SNPs, 7,410 SNPs with call rate <95%, 2 SNPs with no matched position in dbSNP build 138, 3 duplicated SNPs, and 258 SNPs in Hardy-Weinberg disequilibrium (i.e., P-value below 10-5 in one population, or below 0.05 in half of the populations). These filters yielded a final set of 690,739 SNPs. The rate of genotype concordance between 18 duplicate samples was 99.9995%.
We excluded 13 individuals with a genotyping call rate <95%, 18 technical duplicates, and 28 individuals with a heterozygosity at least 3 standard deviations (SD) lower or higher than the mean for the population, suggestive of inbreeding or DNA contamination, respectively. We also excluded 79 individuals because of cryptic relatedness. We considered two individuals to be cryptically related if they presented a first-degree or second-first-degree relationship, as inferred by KING (28). Because rainforest hunter-gatherer (RHG) populations are small isolated communities, and RHG individuals are typically related to many other RHG individuals, we implemented a specific algorithm to remove cryptically related individuals and maximise sample size. A score was first estimated for each individual, which equals the mean kinship coefficient of the individual with all other individuals from the population, divided by its genotyping call rate. At each iteration, the algorithm removes the individual with the highest score, and updates the score of all the remaining individuals accordingly. The algorithm stops when there are no more pairs of related individuals. The newly generated dataset comprised data for a final number of 1,180 filtered individuals, with an average call rate of 99.56%. The detailed number of samples excluded per population is reported in table S1.
excluded SNPs with a discordant rate >5%. We also removed cryptically related individuals present in different datasets, using the algorithm described above. Such related individuals were observed between the RHG population samples collected here and those investigated in two previous studies(31, 32).
Two datasets were generated for subsequent analyses. The first dataset, GabonDiv_PGSRP, was used in most analyses (fig. S1), and comprised data for 2,055 individuals and 548,055 SNPs. It included datasets from five previous studies (7, 12, 30-32). The second dataset, GabonDiv_PGSJ, included an additional study of western central Africans (29), and was used in analyses focusing on the fine-scale genetic structure of western central Bantu-speaking populations (fig. S1). We did not use this latter dataset systematically, because 118,083 SNPs were lost when it was merged with GabonDiv_PGSRP.
We also merged our dataset with data from four cohorts of African American individuals (table S2). These cohorts were selected because genotype data was available from dbGAP for general medical research, and because they were genotyped with the Illumina 1M array, which includes a large number of SNPs common to our dataset. We removed individuals with a call rate <95% from each cohort, and those who did not declare themselves to be African Americans. We excluded cryptically related individuals in each cohort, or present in the GENEVA and CIDR Multiethnic cohorts, using the procedure described above. The final dataset, GabonDiv_PGSRAA, comprised data for 5,244 African Americans and 414,714 SNPs (fig. S1).
Linkage disequilibrium and runs of homozygosity. To provide clues on differences in effective population sizes between Bantu-speaking populations, we used linkage disequilibrium decay and runs of homozygosity. In each wBSP, the r² statistic was estimated between every possible pair of SNPs in a 1-Mb sliding window, using the Expectation-Maximization (EM) method implemented in Haploview (34). As r² estimates are sensitive to sample size, we randomly sampled 10 individuals from each population and repeated resampling and r² estimation ten times. We avoided bias due to SNP ascertainment by restricting this analysis to SNPs with a population frequency greater than 5% in every population subsample. The genetic distances between all possible pairs of SNPs were retrieved from the HapMap phase 2 interpolated genetic map (35). For each population, all pairwise r² values were averaged over replicates and bins of increasing genetic distance.
Runs of homozygosity (ROH) were detected with the sliding-window approach implemented in PLINK (33). We minimized the bias due to SNP ascertainment by including only SNPs with a minor allele frequency exceeding 5% in every population. The genome of each individual was explored by a sliding window of 20 consecutive SNPs. If more than 18 SNPs were homozygous in the individual considered, the window was considered to be homozygous. We allowed for five missing genotypes in each homozygous window. ROH regions were defined as regions of at least 500 kb in which all SNPs were included in at least one homozygous window. The number and cumulative length of ROH regions were then determined in each individual.
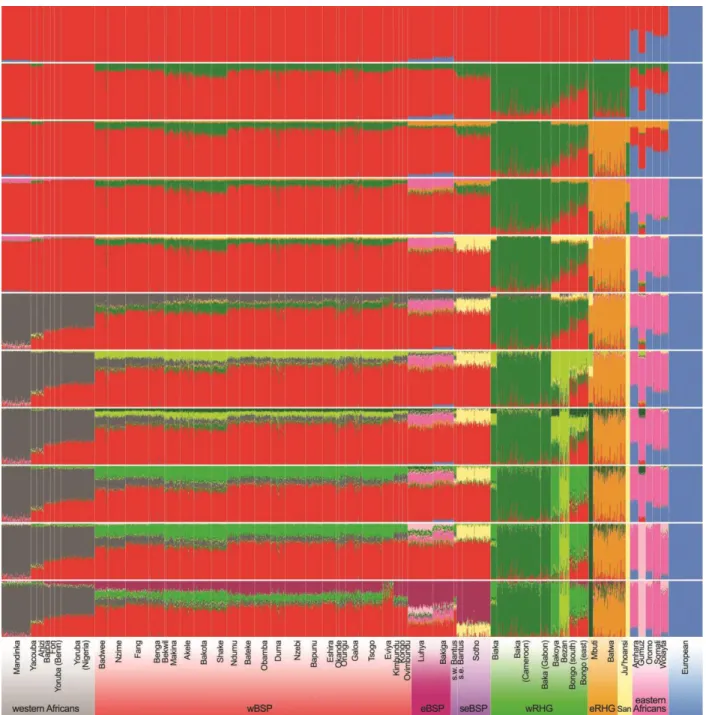
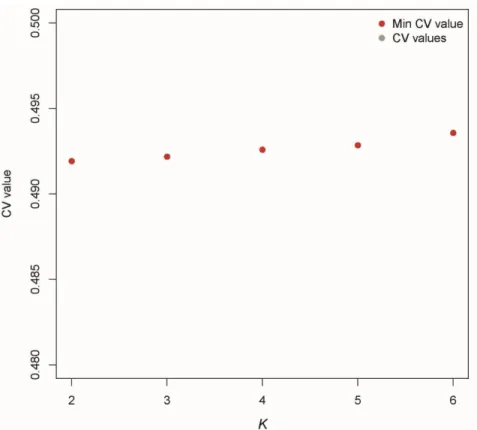
maximum support for the results and check their stability. We retained the results providing the lowest cross-validation (CV) error among iterations (fig. S3 and S6).
Phasing and fineSTRUCTURE analyses. Datasets were phased with SHAPEIT2 (36), using 500 states, 50 MCMC main steps, 10 burnin and 10 pruning steps. These parameters have been shown to minimize switch error rates (36). Recombination maps were interpolated from the HapMap phase 2 genetic map (35). Phased datasets were then analysed with ChromoPainter/fineSTRUCTURE. This approach models
LD with the Li & Stephens’s model (13). It “paints” phased chromosomes of a given recipient individual with the haplotypes of all other individuals in the dataset. The Ne and θ parameters were estimated by ChromoPainter with five EM steps. We performed PCA on the co-ancestry matrix obtained with fineSTRUCTURE, with the eigen R function.
Tests for admixture. We tested for the occurrence of admixture in the studied populations with two different methods. The first approach, 3-pop ALDER, tests if a population is admixed between two parental sources, and estimates the time since admixture and admixture proportions using admixture LD decay with distance (17). All possible triplets of populations in the data were tested. This method assumes a single pulse of admixture and linkage equilibrium between SNPs. The second method, GLOBETROTTER (14), is based on ChromoPainter haplotype “painting” results (see above). It estimates the probability, with distance, that two contiguous alleles on a phased chromosome are inherited from the same ancestral population, and fits one or two exponential curves on the data to identify the best-fit model of admixture (i.e., one-way single pulse, multiple-way single pulse, one-way two pulses, or multiple-way two pulses), and date the admixture event(s). GLOBETROTTER also estimates the respective contribution of donor populations to the genome of the tested recipient population with a linear mixed model (37). The Ne and θ parameters of recipient and donor populations were estimated by ChromoPainter with five EM steps. The populations chosen as recipients or donors are summarized in tables S4 and S11. Confidence intervals of admixture dates and of genetic contributions from donor populations were estimated by bootstrapping. Namely, for each bootstrap iteration, we generated n
“pseudo-individuals”, n being the sample size of the recipient population, by randomly sampling the 22
chromosomes of each “pseudo-individual” from independent recipient individuals. GLOBETROTTER
was then run on the new “chunklengths.out” files obtained for the bootstrapped recipient population and
original donor populations. We repeated this procedure 100 times and computed the 95% quantiles of the sampling distribution of estimated parameters, across the 100 bootstrap re-samples.
Identical-by-descent segment sharing. We used GERMLINE (38) to infer Identical-by-descent (IBD)
segments shared between all individuals of different BSPs. The “-w_extend -bits 80 -err_het 0 -err_hom 1 -min_m 3” arguments were used, and only IBD segments of length 3 cM or longer were considered. Because GERMLINE is prone to false positive IBD assignment, we filtered out genomic regions that showed a number of overlapping IBD segments exceeding 10% of all possible pairs of individuals analysed (i.e., 8865 pairs). We then counted the number of IBD segments shared between eBSPs (or seBSPs) and wBSPs from northern (Cameroon) or southern (Angola) western central Africa. Counts were then divided by the total number of possible pairs of individuals from the two compared populations.
Narrow-Bantu languages. We included 100 words from the basic vocabulary, corresponding to the following words in English: all, animal, arm, ashes, bark, bed, belly, big, bird, bite, blood, bone, breast (woman), burn, child, cloud, come, count, die, dog, drink, ear, eat, egg, elephant, eye, face, fall, fat, oil, feather, fingernail, fire, fire-wood, fish, five, fly, four, give, goat, ground, soil, hair (on head), head, hear, heart, horn, house, hunger, intestine, kill, knee, knife, know, leaf, leg, liver, louse, man, moon, mountain, hill, mouth, name, navel, neck, night, nose, one, person, rain, road/path, root (big), salt, sand, see, send, shame, sing, skin, sky, sleep, smoke, snake, spear, steal, stone, sun, tail, ten, three, tongue, tooth, tree, two, urine, village, vomit, walk, war, water, wind, woman. For each word, we looked for cognate sets (similar words with a similar meaning, suggesting potential relatedness between languages). Each cognate set was coded as a discrete binary character. In total, 10,716 cognate sets were identified.
Distances between languages were obtained by estimating a distance matrix between the 652 languages, based on the Hamming distance, which counts the number of differences between two sequences/characters. We used a neighbor-joining algorithm to construct a phylogenetic network based on the linguistic distance matrix, and sequential agglomeration: taxa were combined into progressively larger and larger overlapping clusters. With the SplitsTree program (39), we then selected the languages spoken by the 30 Niger-Congo-speaking populations included in this study, from the 652 languages, and extracted a new linguistic distance matrix based on the sub-network.
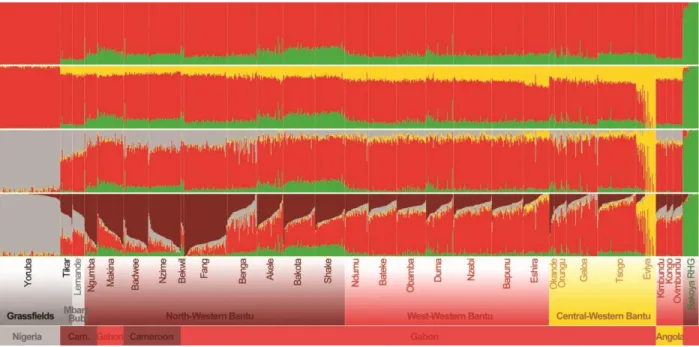
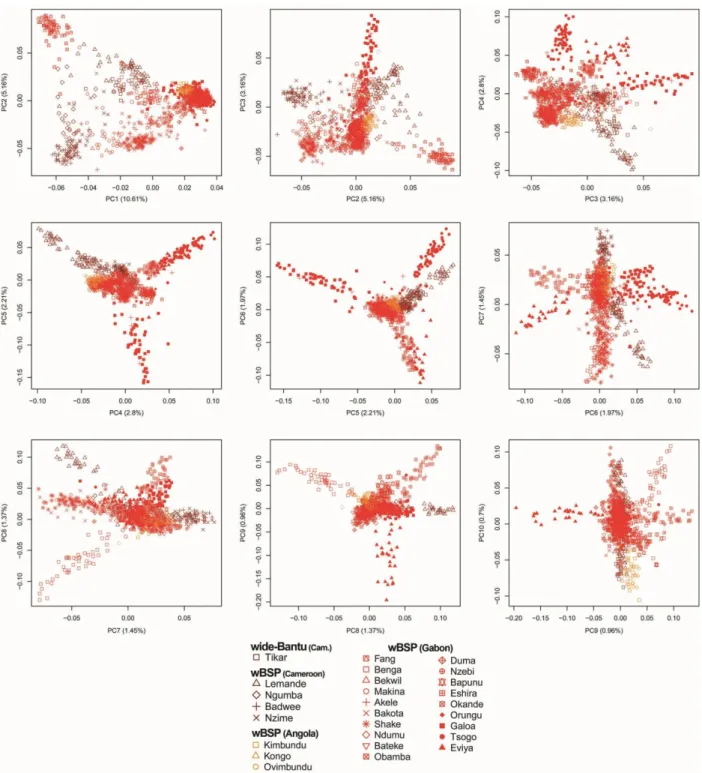
Impact of linguistic and geographic distances on the genetic differentiation of wBSPs. To test different hypotheses on the dispersal of BSPs across sub-Saharan Africa, we first evaluated if Non-Bantu, Wide-Bantu and Narrow-Bantu-speaking populations of western central Africa form a structured population, and whether this genetic structure results from geography or linguistic barriers. Haplotype-based PCA (i.e., eigendecomposition of the fineSTRUCTURE covariance matrix) separated on PC1 populations speaking Non-Bantu, Wide-Bantu, Bantu zone A from those speaking Bantu zone B and H (accounting for 10.61% of the variance; fig. S7). PC2 (5.16% of the variance) reflected genetic structure within Bantu zone A speakers, separating the Fang (A75) from the Ngumba, Nzime and Badwee (A81 and A84). PC3 (3.16% of the variance) separated wBSPs of Gabon and Angola into North Western B10-B30-B40 Bantu speakers (Galoa, Tsogo, Eviya ad Eshira) and West Western BSPs (i.e., B50-B70 and H Bantu speakers). The genetic distinctiveness of the Eviya accounted for only 0.96% of the total variance in the haplotype-based PCA (fig. S7), while it was highlighted at K=3 by ADMIXTURE (fig. S5). Increased genetic drift may explain these different results, as shown by the high levels of LD and the large cumulative length of ROH (fig. S22) observed in the Eviya, relative to all other wBSPs.
We estimated the contribution of linguistic and geographic distances to the genetic differentiation observed between Non-Bantu, Wide-Bantu and Narrow-Bantu-speaking populations of western central Africa. We computed the matrix of genetic distances between the 30 populations included in the GabonDiv_PGSJ dataset with AMOVA-based FST values, computed with a home-made perl script
Genome-wide scans for recent positive selection. Candidate genomic regions of recent positive selection in wBSPs, eBSPs and seBSPs were detected with an outlier approach that considers six
neutrality statistics: intrapopulation |ΔiHH| (41) and |iHS| (42), interpopulation PBS (43) scores with two different outgroups, and interpopulation |ΔiHHD| and XP-EHH (44). Interpopulation statistics require a reference population and PBS statistics an outgroup population. The reference population for scans of positive selection in wBSPs and in eBSPs/seBSPs were the Niger-Congo non-Bantu-speaking populations of western Africa and wBSPs, respectively. The outgroup populations for the two PBS statistics were Europeans and the Ju/’hoansi San for wBSPs and eBSPs, and Europeans and the western RHG Baka for
seBSPs (because seBSPs are admixed with the Ju/’hoansi San). For this analysis, wBSPs were
represented by all Narrow-Bantu-speaking populations of western central Africa; eBSPs by the Bakiga and the Luhya; seBSPs by the Sotho and the S.E. Bantus from HGDP; and swBSPs were not analysed because of their low sample size (n=8).
The derived allele of each SNP was defined based on the 6-EPO alignment in 98.5% of the cases. Statistics based on extended haplotype homozygosity were computed in 2-cM windows, with home-made scripts (available upon request). Only SNPs with a derived allele frequency (DAF) between 10% and 90% were analysed further. All statistics except PBS were normalized in 40 separate bins of derived allele frequency. We combined the genome-wide rank of the six statistics for each SNP with a Fisher score (19), equal to the sum, over the six statistics, of –log10(rank of the statistic/number of SNPs), referred to as FSC.
An outlier SNP was defined as a SNP with a FSC among the highest 1% of the genome. A putatively
selected genomic region was defined as a 100-SNP window presenting a proportion of outlier SNPs among the highest 0.5% of the genome. We combined the six statistics because it has been shown that combining different neutrality statistics into a single score increases the power to identify signals of recent positive selection (19, 41). The rationale behind this approach is that neutrality statistics are expected to be more correlated for positively-selected variants, relative to neutral variants (41). Consequently, candidate variants for positive selection should show outlier values for several statistics included in the combined score.
In wBSPs, eight genomic regions were considered to be putative targets of positive selection (Fig. 3A, fig. S11 and table S7). Genome-wide, the strongest proportion of selection signals was observed at the HLA locus, reaching 50.5% in the HLA-D gene region (Fig. 3, A and D). The best-candidate SNP at the locus was located in the HLA-DOA gene (rs3129302, FSC = 12.7, Pemp = 2.9x10⁻⁵) and displayed high
levels of extended haplotype homozygosity (XP-EHH=-5.30, iHS=-3.43; fig. S12 and table S7), relative to non-Bantu-speaking western African populations. The second strongest proportion encompassed the CD36 gene (27.7%), associated with Plasmodium falciparum malaria (18). The putatively selected variant was located in CD36, had a frequency of up to 25% in wBSPs, and presented both high levels of population differentiation and extended haplotype homozygosity (rs3211881; FSC=15.4, Pemp=5.8x10⁻⁶;
fig. S11E-F and S12).
In eBSPs, five genomic regions were considered to be putative targets of positive selection (Fig. 3B, fig. S13 and table S8). The genome-wide highest proportion of selection signals was again observed at the HLA locus, reaching 62.4% in the HLA-D gene region (Fig. 3, B and E, and fig. S13, A and B). The best candidate SNP at this locus was located close to HLA-DOA (rs6907291, FSC=11.4, Pemp=6.9x10⁻⁵) and had
This suggested that wBSPs and eBSPs have in common a recent positive selection event at HLA genes, which has left a relatively stronger selection signature in eBSPs than in wBSPs. The second strongest proportion was found close to the region regulating the LCT gene (28.7%; Fig. 3, B and E, and table S8). The best candidate variant at this locus had the genome-wide strongest individual SNP score in eBSPs (rs4954204; FSC=25.65; Pemp=5.7x10⁻⁶), owing to both strong genetic differentiation and high levels of
extended haplotype homozygosity, relative to wBSPs (figs. S13, C and D, S14, and table S8). This variant is in linkage disequilibrium (r²=0.69 in Kenyan Maasai) with the lactase persistence mutation C-14010, which appears to have originated in eastern Africa (20, 45).
In seBSPs, six genomic regions were considered to be putative targets of positive selection, although the proportions of selection signals were weaker than in wBSPs and eBSPs (Fig. 3C, fig. S15 and table S9). This possibly reflects the different demographic and adaptive history of seBSPs, limited sample size and population coverage, or genotyping issues identified in the study that generated the data (12). The genome-wide highest proportion of outlier SNPs was observed on chromosome 3, reaching 23.8% close to the GPR156 and FSTL1 genes (Fig. 3F). The best candidate SNP at this locus was located in GPR156 (rs979683, FSC=14.9, Pemp=2.3x10⁻⁵; fig. S15A), and presented a high degree of extended haplotype
homozygosity (XP-EHH=-2.69, iHS=-4.20), relative to wBSPs. The GPR156 gene encodes a protein of unknown function, and the FSTL1 protein has an important role in wound repair (46).
Evidence for adaptive introgression in Bantu-speaking populations. We used genome-wide scans for positive selection and deviations in local ancestry to identify candidate variants for adaptive introgression in BSPs. The genomes of BSPs were decomposed into segments of different ancestries with RFMix v.1.5.4 (47), including two EM steps. Local ancestry was excluded within the 2 Mb from the telomeres of each chromosome (25). We identified most likely introgressed alleles as those showing the genome-wide highest association, using the linear regression model implemented in PLINK, with the inferred local ancestry in genomic regions displaying deviations from the genome-wide average. Two loci, the HLA locus in wBSPs and the LCT region in eBSPs, displayed signals of both positive selection and increased local ancestry from western RHG and eastern Africans, respectively. At the HLA locus in wBSPs, a remarkable excess of ancestry from RHG was observed: 38% RHG ancestry, 6.74 standard deviations from the genome-wide average of 16% (Fig. 3A). This excess was confidently reproduced in a dataset obtained from a single genotyping platform, excluding a methodological bias due to the alignment of alleles from different SNP arrays (fig. S11A). As long-range LD can also confound scans for deviations in local ancestry (48), and because HLA haplotypic structure may be too complex to be correctly modelled by RFMix, we performed phasing and local ancestry inference on a restricted dataset in which the classical HLA region (i.e., all HLA genes) was excluded. Consistently, a strong excess of RHG ancestry was observed at the locus (fig. S11B), supporting the view that the signal is true and extends beyond the complex HLA locus. The variant most strongly associated with introgressed western RHG haplotypes was located near the HLA-DMB gene (rs149392, P=7.7x10-40); the rs149392 derived allele had a frequency of <5% in non-Bantu-speaking western Africans, 52% in the Bakoya western RHG, and 18% in wBSPs.
the Wright-Fisher model to simulate the fate of a neutral allele in an admixed population, under strong genetic drift and/or a model of continuous gene flow. Specifically, an admixed population, adm, was generated by an admixture event between two parental populations, pop1 and pop2, that occurred t generations in the past, t being the admixture time estimated by GLOBETROTTER. The initial admixture proportions from pop1 and pop2 were those estimated from GLOBETROTTER, except when continuous gene flow from pop1 to adm was simulated. In this case, we tuned initial admixture proportions so that the present-day admixture proportions in adm were equal to GLOBETROTTER estimates. The frequency of the simulated allele in the parental populations at time t was considered to be equal to that observed in present-day best-matching parental populations. We let vary two parameters in the model: the adm population size Nadm, and the migration rate madm from pop1 to adm, assumed to be unidirectional, continuous and constant from generation t to the present. The madm parameter was modeled as a proportion of adm individuals that migrated from pop1 at each generation. To test if genetic drift alone could explain our results, we simulated 50 different models where Nadm varied between 100 and 10,000. To test if continuous gene flow could explain our results, we simulated 50 different models where madm varied between 0.01% and 1%. Each model was replicated 10,000 times, and the 95% confidence interval of the current frequency of the neutral allele in adm was computed.
Simulations showed that the frequency of the HLA-DMB rs149392 introgressed allele was unexpectedly high in wBSPs (P<0.0001), except when we assumed an unrealistic scenario where the population size of wBSPs was 1,000 since admixture with RHGs (P>0.05; fig. S16 and table S10), far below recent estimations (31, 51, 52). However, despite its high allele frequency in wBSPs, the variant did not have a strong selection score (FSC=7.65), owing to its low iHS value (iHS=0.457). Furthermore, the variant for
which the evidence for positive selection at HLA was strongest in wBSPs did not segregate with the introgressed haplotypes (P=0.02). These results support the view that the strong signal of positive selection close to HLA-D genes observed in wBSPs does not result from introgression from western RHG populations. At the LCT region in eBSPs, the genetic variant most strongly associated with introgressed eastern African haplotypes was rs4954204 (P=9.3x10⁻²¹), which was also the variant with the highest selection score genome-wide (table S8). Its derived allele had a frequency of 30% in the eastern Bantu-speaking Bakiga of Uganda, yet it was virtually absent from wBSPs (fig. S13D). Simulations showed that the frequency of this introgressed allele was unexpectedly high in the Bakiga (P<0.0001), in all scenarios explored (fig. S17 and table S10). By contrast to what was found for HLA in wBSPs, these results demonstrate that eBSPs have acquired the lactase persistence allele C-14010 – which is in linkage disequilibrium with rs4954204 – via introgression from eastern African populations, with this variant subsequently subjected to positive selection in Bantu speakers.
ancestry observed in wBSPs, estimated that western RHGs did not directly contributed to the African genome of African Americans.
Genome-wide scans for natural selection in African Americans. To test for the occurrence of changes in selective pressure in AA genomes, we compared the minor allele frequency of each SNP in a parental population with its frequency in chromosomes inherited from this parental population in the admixed AA population of interest, identified on the basis of local ancestry. The genomes of admixed populations were decomposed into segments of different ancestries with RFMix v.1.5.4 (47), with no EM step, to reduce computation time. Local ancestry was excluded within the 2 Mb from the telomeres of each chromosome (25). We tested for significant differences in allele frequencies between a parental and an admixed population using the model-based method developed by Bhatia and colleagues (49). For analyses in which AAs were considered to derive from multiple African parental populations, we assumed that the allele frequency in the parental population was equal to its frequency in each parental source, weighted by the local ancestry proportion from each parental source in the admixed population.
Detailed acknowledgements
eMERGE Vanderbilt: Funding support for the Vanderbilt Genome-Electronic Records (VGER) project was provided through a cooperative agreement (U01HG004603) with the National Human Genome Research Institute (NHGRI) with additional funding from the National Institute of General Medical Sciences (NIGMS). The dataset and samples used for the VGER analyses were obtained from Vanderbilt University Medical Center's BioVU, which is supported by institutional funding and by the Vanderbilt CTSA grant UL1RR024975 from NCRR/NIH. Funding support for genotyping, which was performed at The Broad Institute, was provided by the NIH (U01HG004424). Assistance with phenotype harmonization and genotype data cleaning was provided by the eMERGE Administrative coordinating Center (U01HG004603) and the National Center for Biotechnology Information (NCBI). The datasets used for the analyses described in this manuscript were obtained from dbGaP at http://www.ncbi.nlm.nih.gov/gap through dbGaP accession number phs000188.v1.p1.
eMERGE Northwestern University: Samples and data used in this study were provided by the NUgene Project (www.nugene.org). Funding support for the NUgene Project was provided by the Northwestern
University’s Center for Genetic Medicine, Northwestern University, and Northwestern Memorial
Fig. S12. Relationships between the ranks of combined neutrality statistics in western central Bantu-speaking populations (wBSP). Recent and strong selective sweeps were detected with a Fisher score that combines six neutrality statistics, including two based on interpopulation differentiation (PBS1 and PBS2), interpopulation differences in haplotype homozygosity (XP-EHH and |iHHpop-iHHref|) and
intrapopulation differences in haplotype homozygosity between alleles (|iHS| and |iHHD-iHHA|). Small
gray and blue points indicate genome-wide SNPs and SNPs with the 1% lowest Fisher scores of the genome, respectively. No strong correlation was observed between the three categories of neutrality
Fig. S14. Relationships between the ranks of combined neutrality statistics in eastern Bantu-speaking populations (eBSP). Recent and strong selective sweeps were detected with a Fisher score that combines six neutrality statistics, including two based on interpopulation differentiation (PBS1 and PBS2), interpopulation differences in haplotype homozygosity (XP-EHH and |iHHpop-iHHref|) and intrapopulation
differences in haplotype homozygosity between alleles (|iHS| and |iHHD-iHHA|). Small gray and blue
points indicate genome-wide SNPs and SNPs with the 1% lowest Fisher scores of the genome, respectively. No strong correlation was observed between the three categories of neutrality statistics
Supplementary Tables
Table S1. Geographical location, language and lifestyle of the newly genotyped populations, as a separate
Excel file
Table S2. Additional included populations and cohorts from previously published datasets, as a separate
Excel file
Table S3. Genetic differentiation between sub-Saharan Africans, estimated by the average
AMOVA-based FST for 406,798 independent SNPs, as a separate Excel file
Table S4. Admixture events in African Bantu-speaking populations estimated by GLOBETROTTER, as
a separate Excel file
Table S5. Number of shared Identical-By-Descent (IBD) segments among Bantu speakers, as a separate
Excel file
Table S6. Admixture events in African hunter-gathering and Bantu-speaking farming populations
detected by 3-pop ALDER, as a separate Excel file
Table S7. Candidate genomic regions for recent positive selection in western central Bantu-speaking
populations, as a separate Excel file
Table S8. Candidate genomic regions for recent positive selection in eastern Bantu-speaking populations,
as a separate Excel file
Table S9. Candidate genomic regions for recent positive selection in southeastern Bantu-speaking
populations, as a separate Excel file
Table S10. Simulation-based evidence for adaptive introgression at the HLA locus in wBSPs and at the
LCT locus in eBSPs, as a separate Excel file
Table S11. Estimated parameters of admixture in African Americans, as a separate Excel file
Table S12. Tests for direct contribution of western African rainforest hunter-gatherers to African