M
ASTER OF
S
CIENCE
F
INANCE
(F
INANCIAL
I
NSTITUTIONS
)
M
ASTER
´
S
F
INAL
P
APER
MASTER THESIS
EVALUATING RISKS IN PUBLIC PRIVATE
PARTNERSHIPS: THE CASE OF THE
PORTUGUESE ROAD SECTOR
MÁRIO JORGE CORREIA FERNANDES
M
ASTER OF
S
CIENCE
F
INANCE
(F
INANCIAL
I
NSTITUTIONS
)
M
ASTER
´
S
F
INAL
P
APER
MASTER THESIS
EVALUATING RISKS IN PUBLIC PRIVATE
PARTNERSHIPS: THE CASE OF THE
PORTUGUESE ROAD SECTOR
MÁRIO JORGE CORREIA FERNANDES
S
UPERVISION:
Professor Mestre Joaquim José Miranda Sarmento
List of Acronyms
APV –Adjusted Present Value
EIB– European Investment Bank
IEP– Instituto de Estradas de Portugal (Portuguese Public Road Institute) WB– World Bank
DGTF –Direcção Geral de Tesouro e Finanças (task-force under the Ministry of
Finance)
DSCR– Debt Service Coverage Ratio
EBITDA– Earnings Before Interest, Taxes, Depreciation and Amortization IRR– Internal Rate of Return
NAO– National Audit Office NPV– Net Present Value
OECD–Organization for Economic Cooperation and Development
PFI– Private Finance Iniciative PPP– Public-Private Partnership PSC– Public Sector Comparator
SCUT–Estrada Sem Custos para o Utilizador (Without Costs to the User) SPV– Special Purpose Vehicle
VfM – Value for Money
Abstract
Throughout the last few decades, it has been verified a significant raise in the use of
Public-Private Partnerships, by part of the world’s economic governments as an alternative in the management and financing of infrastructural investments to joust the
problematic of the infrastructure gap. From the projects sponsors point of view, the
capital investment's strategic decisions are fundamental, so that the feasibility studies of
partnerships are a critical factor for operational success and their management.
However, for these agents, the risk-return question is preponderant, due to the soaring
of financial, political and market risks, which will organize the imperative of application
of new evaluation methods, as the case of the IRR-at-Risk, Cash Flow-at-Risk and the
NPV-at-Risk, where the latter combines the dual issue of risk-return and the average
weighted cost of capital. Therefore, this investigation aims to proceed to the application
of the listed methods for the Public-Private road institutions in Portugal. Based in a
sample from the 7 SCUT and 7 new concessions (highways), we will seek to apply the
decision methods of risk-return in order to prove that these can provide better decisions
in matters of risk and investments analysis compared to the methods of traditional
financial evaluation. The results show that, for the sponsors, the methods of risk-return
provides better decisions if include the element of risk in projects.
KEY WORDS: Public-Private Partnerships; CF-at-Risk; Current methods of financial
valuation; Financial modeling; IRR-at-Risk, NPV-at-Risk; Project Finance; Risk and
management analysis.
JEL Classification System: G38 - Government Policy and Regulation; H54 -
Resumo
Ao longo das últimas décadas tem se verificado um aumento significativo, por
uma parte da governação económica mundial, ao recurso de PPP, como alternativa em
matéria de gestão e de financiamento de investimentos infra-estrtuturais, de modo a
combater a problemática do the infrastructure gap. Do ponto de vista dos sponsors
(patrocinadores) dos projectos, as decisões estratégicas de investimento de capital são
fundamentais, pelo que os estudos de viabilidade das parcerias são um dos factores
críticos para o sucesso operacional e de gestão dos mesmos. Porém, para estes agentes,
a questão de retorno-risco é preponderante, dados os elevados riscos financeiros,
políticos e de mercado, o que irá originar o imperativo de aplicação de novos métodos
de avaliação, como o caso do IRR-at-Risk, Cash Flow-at-Risk e do NPV-at-Risk, sendo
que este último combina a questão dupla de retorno-risco e o custo médio ponderado do
capital. Assim, esta investigação tem como objectivo proceder à aplicação dos métodos
indicados às PPP rodoviárias em Portugal. Com base numa amostra de 7 SCUT e 7
Auto-Estradas, procurar-se-á aplicar os métodos de decisão de retorno-risco, de modo a
comprovar que o estes poderão fornecer melhores decisões em matéria de análise de
risco e de investimentos, comparativamente aos métodos de avaliação financeira
tradicionais. Os resultados denotam que os métodos de retorno-risco, para os sponsors,
fornecem melhores decisões ao incluirem a component de risco nos projectos.
PALAVRAS-CHAVE: Parcerias Público-Privadas; Análise e gestão de risco;
CF-at-Risk; IRR-at-CF-at-Risk; Modelação financeira; Métodos de avaliação financeira corrente;
NPV-at-Risk; Project Finance.
ACKONWLEDEGEMENTS
In this special point of my academic and personal life, I would like to take this section
to give thanks to all those who, in some way, contributed for this project by giving me
support throughout the time I needed to complete my Master’s thesis.
I couldn't mention a better person first than the Master Teacher Joaquim Miranda
Sarmento, thank you for the guidance and permanent availability to help me during the
process of preparing this dissertation.
For the help and personal reference in the field of quantitative methods, I would like to
thank to Doctor Professor Ana Amaro.
To my mother for the reference model of honesty and integrity that she is to me and to
my father who always encouraged me to go further.
To my grandfather, José Manuel Chandlier Correia for being such a big reference to me.
To my Master: Professor José Paulo Oliveira, for the opportunity of our friendship.
Who also is my main reference in the field of macroeconomics and international
monetary economics, being the reason why I developed a taste for these areas of the
economy. I would also like to thank for the unconditional support, as well as the
motivation that enabled me to achieve the academic, professional and human
excellence.
To all those who I didn’t had the opportunity to mention as I should, but never
forgotten.
To God, by his very existence!
Table of Contents
I. Introduction ... 1
II. A brief survey of literature ... 4
2.1. Public Private Partnerships and Project Finance ... 4
2.2. The risk factor in the hiring of Public-Private Partnerships ... 6
2.3. Financial modelling and current methods of financial evaluation ... 8
III. The Experience of Public-Private Road Partnerships in the Portuguese Economy ... 14
IV. Method and Data ... 16
4.1. Methods of risk-return decision for the sponsors of Public-Private Partnerships ... 16
4.1.1. Value-at-Risk ... 16
4.1.2. Cash flow-at-Risk ... 17
4.1.3. Net Present Value-at-Risk ... 18
4.1.4. Internal Rate Return-at-Risk ... 21
4.2. Application of the current methods of evaluation of the Public-Private Partnerships ... 21
V. Analysis and discussion of results ... 24
5.1. Traditional methods ... 24
5.2. Risk-Return methods ... 26
5.3. Risk Exposition ... 28
VI. Conclusions, main limitations and suggestions for future research ... 31
6.1. Conclusions ... 31
6.2. Main limitations ... 32
6.3. Suggestions for future research ... 33
VII. References... 34
Index of Figures
Exhibit I: Methods and decision rules for capital investment decisions…………...….11 Exhibit II:Framework of the methods…….……..………...12 Exhibit III: Cumulative inflows and outflows from concessionaire´s equity and loan
from lenders.……….………..…….18
Exhibit IV: Calculation of NPV-at-Risk and confidence level based on simulation
generated distribution.. ………..……….………20
Exhibit V: Scatter graph of VaR adjusted to the present value of public
payments………..28
Exhibit VI: Histogram of hipothetical changes and losses in a PPP project
Index of Tables
Table I:Main assumptions assumed for the cash-flows model ………..……22
Table II: Main informations about the SCUT concessions and the equity and financial structure ……….………..……...23
Table III: Main informations about the new highways concessions and the equity and financial structure.……….………..…23
Table IV: Results of tradicional methods applied to SCUT……….…...…...25
Table V:Results of tradicional methods applied to new highways ………...25
Table VI: Results of risk-return methods applied to SCUT …………...………...27
Table VII: Results of tradicional methods applied to new highway………...…27
Table IX: Results of VaR in new highways projects………..30
Index of Appendices
Appendix I: Relationship between public and private sectors in PPP projects.……….42
Appendix II:Advantages and disadvantages of project finance………......42
Appendix III: Public Sector Comparative, Value for Moneyand PPP……….43
Appendix IV: Allocation of risks and Optimal risk transferable………...43
Appendix V: Stages of analysis and evaluation of risks in PPP.………...44
Appendix VI: Trade-off between return-risk and risk management in PPP projects.…44 Appendix VII: Trade-off between return and risk of financial instruments ……….…45
Appendix VIII: Increase of funding by lenders in PPP projects………….…….…..…45
Appendix IX: Unitary payments, project revenues andPPP/PFI financial model…….46
Appendix X: Participations in the portuguese highways, by Shareholders.…………...46
Appendix XI: Participations in the SCUT projects, by Shareholders…………..…..…47
Appendix XII: Risk management and Monte Carlo simulation ………….…………..47
Appendix XIII: Calculation of NPV-at-Risk and confidence level based on cumulative distribution function……….………...48
Appendix XIV: Calculation of NPV-at-Risk and confidence level based on probability distribution function ……….…..48
Appendix XVI: Evolution of cash-flows in new highways ………..50
Appendix XVII: Cumulative density functions of SCUT projects ..……….…51
Appendix XVIII: Cumulative density functions of SCUT projects based in Monte Carlo simulation ……….……52 Appendix XIX: Cumulative density functions of new highways ………..……...53
Appendix XX: Cumulative density functions of new highways based in Monte Carlo simulation………54
Appendix XXI: Histogram of hipothetical changes in SCUT projects ……..……...…55
Appendix XXII: Histogram of hipothetical changes in new highway…………...……56
Index of Equations
Equation I: Determination of VaR…….………17Equation II: Determination of NPV-at-Risk……...……….………..……19
Equation III: Determination of NPV……….………20
Equation IV: Determination initial profits of the concessionaire…..………20
I. Introduction
In a detailed analysis of the last decades, it can be noticed that the Governments
of various develop (or in development) world economies have witnessed a problem
concerning the need for the creation of infrastructures or their renewal. It results in
negative impacts not only on economic growth, but also in terms of job creation and
significant improvements in the welfare of economic agents. In this context, emerged
the concept of Public-Private Partnerships (PPP) and it should be noted that these are
closely associated to the existence of a limited public resources. The problematic of the
infrastructure gap, and therefore their own partnerships, gains special relevance at a
time like the present, where public resources of the most important European and world
economies are heavily conditioned by the constraints on fiscal policy and combating
the high public indebtedness.
As a very broad universe of various definitions for PPP, it is possible to appeal
to the definition given by the Organisation for Economic Co-operation and
Development (OECD, 2008) which understands the partnerships as: “an agreement between a public entity and one or more private partners (which may include the
operators and financiers), in which the private sector ensures the provision of a service
or building an infrastructure in order to achieve the proposed objectives by the public
sector, while giving ensuring a return on capital invested by private sector, which can
only be achieved if the risk allocated to the private sector is optimized”. This point takes on special emphasis on a scenario in which, usually, the states can obtain a lower cost of
financing than the private agents, so the difference in financing costs should be
overcome by greater efficiency in managing the risks associated with PPP.
Thus, the central question of this research opportunity lies in a more detailed
analysis to the imperative to make the use and application of new methods of financial
evaluation and risk of PPP for all stakeholders (governments, financial institutions and
sponsors), but mainly for the partnership’s sponsors. Starting from the question of allocation of risk in these projects between public and private sector, and considering
that the primary objective of the private sector involves the maximization of enterprise
value, focus on matter that traditional valuation methods do not recognize the financial,
political or market risks. Thus, emerge the method of NPV-at-Risk, as alternative
decisions of capital investment. In this context, there are also the methods of the
IRR-at-Risk and the CF-at-IRR-at-Risk, both also determined with the aid of Monte Carlo simulations.
To this end, it will proceed to the use of cumulative probability density functions of the
cash flows, of each project, for a given level of significance. Therefore, in the second
chapter, we will conduct a review of the literature on major issues of PPP and decisions
methods of risk-return projects. So, the fundamental concepts around PPP and the
Project Finance will be reviewed and will also focus on a review of the risk factor in
hiring of PPP. On the other hand, also important, the analysis of the major literature in
relation to the main current methods of financial evaluation on these projects from the
perspective of each of the agents involved. In the third chapter, to conclude the literature
review, we will proceed to the analysis of the experience of partnerships in the
Portuguese economy, more specifically in the road transport sector. Following the
literature review and the portuguese experience in PPP, in the fourth chapter, it will be
briefly introduced the main methods to be applied as the case of VaR, IRR-at-Risk,
CF-at-Risk and NPV-CF-at-Risk and the process of Monte Carlo simulation for determining
them. Based on a sample of 7 SCUT and 7 Highways, it will be applied the decision
methods of risk-return and, parallel to this, these will be compared with the VaR of each
respective project. The innovation in this opportunity of research relates to the
combination of the results achieved with the current methods of financial evaluation
(and their cumulative probability density functions) with the traditional evaluation
methods to a whole unexplored sector grouping all metrics “at-Risk” available for evaluation of such projects.
Finally, it will be found in the last chapter the main conclusions drawn based on
a study on the application of methods of return-risk decision of the PPP in the field of
SCUT and new Highways (new sub-concessions) in Portugal. The research results seem
to reflect that the methods provide better risk-return relationship between the return of
the PPP and the inherent risk of the projects. The methods developed and applied to the
national road sector attempt to demonstrate that they can overcome the difficulties in
measuring and quantifying the exposure of the various risks that the PPP face.
Using statistical tools, the return-risk methods allowed us to determine minimum values
for the financial metrics, with a confidence level of 90% and 95%. Only one project
denotes possibility of financial infeasibility, to the significance level of 5%. It was also
payments to concessionaires. In regard to this matter, there was a great uniformity in the
results obtained.
Thereby, these contribute to better strategic decisions for capital investment
given the possibility of interaction between the components of returns achieved and
assumed risks. It will be also presented the main limitations underlying to the present
opportunity of research and, secondly, it will be introduced a set of suggestions for
futures researches associated to the subject of new decision methods of risk-return of
II. A brief survey of literature
2.1. Public Private Partnerships and Project Finance
At present, with a large number of agencies and institutions using the concept of
PPPs arise, therefore, several possible definitions for this type of project. The European
Commission defines PPP as the “transfer of investment projects to the private sector, traditionally executed and financed by the public sector" (European Commission,
2004). Underlying this definition, beyond the fact that the implementation and funding
responsibilities belong to the private the question of occurring the provision of a service
and, secondly, the allocation of risks between the State and private agents (International
Monetary Fund, 2004). Thus PPPs involve several participants in order to obtain a
stable relationship between the public and private entity (Akintoye, Beck and
Hardcastle, 2003 and Ke, Liu and Wang, 2008).
A form of financing, such as the Project Finance, appears to be one of the
possibilities to circumvent the problem of the infrastructure gap (Deloitte, 2007).
Understands the Project Finance as the alternative that aims to mitigate the risk of
financing and still sharing their optimization by adjusting the debt characteristics to the
types of cash flows of the project (Kleimeier and Megginson, 2000 and Kleimeier and
Hainz, 2006). From the relationship between PPP and Project Finance arises the fact
that the projects are financed by a company newly created for the sole purpose of
developing the activity of the partnership in question (Special Purpose Vehicle) with a
high debt-to-equity ratio, accompanied by more private companies (see appendix I),
whose objective is the generation of cash flows for the project and to the shareholders of
the same (Grimsey and Lewis, 2000 and Ye, 2009). These future cash flows are the only
possible guarantee of funding allocated to lender agents, justifying the concept of non
recourse debt financing (Comer, 1996, World Bank, 2000; Grimsey and Lewis, 2000
and Blanc-Brude and Strange, 2007). The Project Finance also presents several
advantages (see appendix II), such as tax benefits, the high indebtedness of the Special
Purpose Vehicle division and the accounts of the various companies that are
shareholders (Yescombe, 2002). Esty (2003) points out that the debt will not be reported
on the balance of the shareholders as an important motivation of Project Finance.
However, in most cases, the private sector presents a equity and financing cost higher
procurement, it will have to present efficiency gains which allow the creation of the
Value for Money (Grimsey and Lewis, 2007). Associated to the VfM it is the idea that
private agents can have more efficiently than the public sector, leading to add value to
the project (Grimsey and Lewis, 2000; Grimsey and Lewis, 2005 and Shaoul, 2005).
Thereby, VfM will be always generated when the cost associated to the Public Sector
Comparator (PSC), executed and financed by the Public Sector exceeds the partnership.
The PSC it’s understood as the present net value of an analysed project from the
standpoint of the traditional procurement regime, to face a service level, previously
determined and that such analysis takes into account the extension of the life cycle of
the project, as the underlying risks (Frastrich and Grimscheid, 2007 and Girmscheid,
2006). This justifies the fact that several authors are supporters of the idea that the PPP
should not proceed without the confrontation between VfM and PSC resulting in a
surplus value compared to traditional procurement, as it shows in appendix III
(Grimsey, 2004; Sousa, 2008; Moralos and Amekudzi, 2008 and Sarmento, 2010).
Given the complexity, scale and long period of concession, the PPP include risks
difficult to analyse and control, so that each risk will be allocated to the part best able to
manage it (Wang, Tiong, Ting e Ashley, 2000; Akintoye, Beck e Hardcastle, 2003;
Efficiency Unit, 2003 e Ke, Liu e Wang, 2008). Note that the public sector has the
responsibility to review the analysis of project conception, its contractual framework
and often also the payment of cash flows to the private entity (depending on the
continuity of the periodic payments quality of service performed). This will minimize
the consequences of hypothetical risks of demand, which could affect the quality of
service provided by the infrastructure. The private sector, in its turn, depending on the
contractual mould of each established PPP, lies with multiple responsibilities, such as
the process of obtaining financing, construction and management of infrastructures or
its maintenance/renewal. Hereupon, the PPP seek to maximize the capabilities of
private, because evidence suggests that the private agents can cope with the budgetary
limitations set and, still, accomplish the schedule agreed with the public sector, in
addition of also be responsible for the maintenance of the infrastructure created by
them, so that these efficiency patterns are always available for the users (pwc, 2005). In
the UK, the report of the National Audit Office (NAO) concluded that, to date, only
22% of partnerships had extra costs and 24% of them needed additional time to be
and 70%, respectively (NAO, 2003). Therefore, to obtain efficiency gains to justify the
differences in financing costs and margins to achieve positive financial results, the
private sector should be more efficient throughout the various phases of the project, as
in the phase of investment, planning, infrastructure management, maintenance or
renewal and also in risks management (Spackman, 2002 and United States Department
of Transportation, 2008).
2.2. The risk factor in the hiring of Public-Private Partnerships
One of the basic characteristics of PPP relates to the transfer of responsibilities
between the involved parts in the partnership: the public and private sector. In case of
including the assumption of all risks being exogenous, then both parts would have the
same ability to manage this exogeneity. But this issue isn’t verified in whole, so it gains
special emphasis on analysing the trade-off between the allocated risk and existence of
an incentive system. Despite the generally negative connotation around the concept of
risk, there are an important difference between risk and uncertainty. Risk is randomness
with knowable probabilities and uncertainty is randomness with unknowable
probabilities (Knight, 1921). At the level of PPP, the risk is present through the
uncertainty around several variables, such as operating and maintenance costs,
additional investment, demand for infrastructure, among others, but may also provide
opportunities for staff involved in the project (Froud, 2003). The private sector benefits
of two important arguments, allowing higher efficiency compared to the public sector
and explaining some of the risks transferred to the private: economies of scale and
economies of knowledge. The economies of scale arise from the fact that the private
sector is witnessing a frankly higher production with the possibility of dilution of fixed
costs and resulting, ceteris paribus, in a more efficient production (Savas, 2000; Chong,
Huet, Saussier and Steiner, 2006 and Sousa, 2008). The economies of knowledge, in
their turn, are associated to the fact that the private sector benefits from the opportunity
to specialize in a particular area or sector of, through the concept of learning-by-doing
(Jin and Doloi, 2008). Despite the subjectivity of some topics in the allocation of risk, in
contrast to the importance of the issue to the success of partnerships (Domberger, 1998;
Klein, 1998 and Medda, 2004), the main and most cited criterion for the allocation of
lowest cost (Hood and Macgarvey, 2002; European Commission, 2003 and Grimsey
and Lewis, 2004). Thus, in the presence of the imperative of the private agent being
more efficient than the public sector, it's important to establish efficiency rule for the
allocation of risk. This, from the theoretical point of view, seems to be quite simple: the
public sector should not transfer all risks to which it is responsible, or take risks beyond
their control (Akintoye, Beck and Hardcastle, 2003). It should therefore optimize the
transfer of risk, to the detriment of the possibility of maximizing the risks being
transferred, as denoted in appendix IV. This scenario would report to an increase of
marginal costs for the public sector, so it is essential to ensure that the public benefit of
such transferred risks exceed such financial marginal costs (Quiggin, 2004). In a
hypothetical scenario of an inadequate transfer, in a case of excess of risk transferred to
the private sector, it can result in a decrease of the private agents’ number interested in
the partnership and, on the other hand, stimulate opportunism of the remaining
proponents (Zitron, 2006). Another study suggests that, based on the scenario given
above, the performance of the private agent will decline (Holmstrom and Milgrom,
1991).
An analysis of careful risk assessment should witness several steps as set out in
appendix V (Marques and Berger, 2010). Starting with the identification of the risks of
PPP, although there is no consensus view of the classification of these, several authors
point to a set of multiple risks possible to identify such as: (i) The technical risk on
changes in engineering and design standards; (ii) the construction risk associated to
buildings out of the established quality standards in the contract, differential additional
costs compared to the budget or delays in infrastructural building; (iii) operational risk
of the projects, many times justified by increases in costs of maintenance and operation;
(iv) the risk of revenue due to hypothetical traffic breaks (in the case of roads or rails
partnerships) or volatility in prices or demand for a good/service causing a shortfall of
revenues; (v) financial risks, from an inability of correct coverage of revenue flows and
financing costs; (vi) natural risks, through the possibility of calamities or natural
disasters that cause damage to infrastructure; (vii) political risks in which political
changes influence the regulatory policies of partners; (viii) hypothetical environmental
risks, depending on the project in question and; (ix) the risk of failure of the partnership,
given a combination of several risks. (Grimsey and Lewis, 2002; Farrel, 2003 and
Marques e Berg, 2010). While the stage of allocation risks is based on the division
quantification of risks will determine the level of occurrence and level of their result, so
that each part must develop strategies for minimizing expected impacts of hazards.
Authors like Asenova (2010) conclude, though, about the benefits of risk allocation in
contracts of PPP, especially by the evidence that this allocation has improved the
process of reducing costs. The author stresses that this provides incentives for good
practices in managing PPP and also through reducing the need for inclusion of a process
of renegotiation. Since the issue of risks allocation of a PPP is critical to determining
the risks retained and to be transferred and even to determine the viability of the
partnership, by studying the basis of certain evaluation methods, (Vega, 2011), longed
to some alternative methods of return-risk that relate the evaluation of that transfer to
the private (Wong, 2006), described in the following sub-chapter.
2.3. Financial modelling and current methods of financial evaluation
The process of financing a PPP involves four interdependent aspects, such as
present in appendix VI: (i) the capital structure; (ii) the organizational structure; (iii) the
architecture of the contract structured and (iv) enhancement of credit granted to the
project (Ye, 2009). Because there are multiple sources and forms of financing for each
component, it can be witnessed several financing structures for partnerships.
Throughout the evolution of the financial literature, there was a broad consensus on
three major categories of resources for financing of investment projects: (i) equity, (ii)
subordinated debt (mezzanine, high yield and PIK) and (iii) senior debt (Bolton and
Freixas, 2000). Given the equilibrium models of financial assets, such as the CAPM,
different sources of funding, based on different exposures, results in different returns
required by each lender (Sharpe, 1964; Lintner, 1965; Douglas, 1968; Black, 1972 and
Fama and French, 2004). Given the optimization of capital structure, it will be possible
to verify that the providers of equity, by assuming higher degrees of risk, require higher
returns. Contrary to this, will be the lenders, which had been added to the senior debt
that to levels of lower risk required a lower return as compared to equity providers. The
subordinated debt, in the exposure panorama to risk-return is between the equity and
senior debt. Note that, for lenders, the financing of equity comes from the sponsors of
Given the senior debt, this is usually from commercial banking syndication or
international agencies, such as the World Bank (WB) or the European Investment Bank
(EIB). Thus, the optimal structure of capital of a partnership should be aware of the
trade-off between risk and return in order to a better allocation of financial instruments
to be used. Since it’s unusual the total project financing, by the sponsors of the same, be performed by equity, as this business is not the core business of the shareholders, is also
verified that the partnership will difficultly be fully funded by senior debt, given the
nature of the non recourse of financing in PPP. So, there is always equity financing by
the sponsors of the partnership, even to denote a connection to the project and that
differential of the portion not funded by debt represents a cost that donors would not
have to bear, in case of failure of the project (appendix VII and VIII). It’s justified then a leverage ratio of the Special Purpose Vehicle in most cases exceeding 70% and in
some cases this value will be close to 100% (Ye 2009). In terms of financial modelling,
taking into consideration the time factor, it is noted that most partnerships are funded
through long-term debt and usually these projects use, at an early stage, syndicated
loans with higher earnings, because the refinancing, also in long term, will occur with
lower wages, resulting in a decrease in the cost of total capital.
Cartlidge (2006) highlights the high costs of bidding for PPP and Private
Finance Initiative (PFI) checked in the UK, fitting with the complexity of the financial
modelling of projects (see appendix IX), referring also to other variables such as
inflation, the legal aspects, tax changes and payment mechanisms. On the other hand,
will be the methods of financial appraisal of PPP and Private finance Initiative. The
most common methods to carry out a financial assessment of any proposed investment
are the average accounting return, payback, IRR and also the NPV (Damodaran, 1997;
Brealey and Myers, 2002). However, these methods are based on future cash flows,
using various assumptions. Based on key characteristics of PPP, these projects have
aspects that may turn the forecast of cash flows in a not so easy task, by the high capital
expenditure required, the long waiting times and periods of very long leases (Ye and
Tiong, 2000). On the basis of the requirement of current methods to this scenario, Ho
and Liu (2002) presented a model for evaluating real options. Equally important seems
to have been the contribution of Ranasinghe (1999), by presenting a model that would
allow governments to assess the possibility of private agents to participate in
infrastructural projects of public interest, based on risk and financial aspects of projects.
evaluation in PPP, the main contribution came from Ye and Tion (2000), by introducing
the concept of NPV-at-Risk, which is a method that in addiction to take into account the
weighted Average Cost of capital also considers the double issue of return and risk.
Systematically, the methods of evaluation of projects can be classified into a set of three
broad categories: (i) methods based on returns, (ii) methods based on risk and (iii)
methods based on returns and risk (Ye and Tiong, 2000). The main criticism of these
methods is that these returns do not take into account the value of money in time.
Although some methods use the value of money in time, by discounting cash flows,
these were estimated or anticipated which turns them in not pre-defined cash flows.
Note that this uncertainty leads to evaluation methods of projects based on risk. In a
capital investment, Biderman (2006) defines risk as the possibility of loss or gain of the
same due to the occurrence of certain unpredictable factors. Thus, this same uncertainty
will bring risk in assessment of capital investment decisions. In the case of rating
systems, the decision rule relates to the fact if the investment gets a classification of
investment grade. However, note that the rating systems are limited to the measurement
of credit risk (Stimpson, 1991) because they are related to the quality of investment and
not to the attractiveness of the same (Hennessy, 1986). Given the risk-return methods,
the most common are the adjusted risk methods, which witnesses a discount rate, as in
the case of the CAPM, APT and WACC, because both methods aim to determine the
discount rate in a scenario of uncertainty. Parallel to this, in an alternative way, will be
some methods of return-risk, by probabilistic approach and statistics such as the
coefficient of expected return or analysis of the cumulative distribution. NPV-at-Risk
appears as a method that synthesizes the weighted average cost of capital with NPV
expected to form a minimum value for this method of capital decision (Ye and Tiong,
Exhibit I: Methods and decision rules for capital investment decisions.
Source: Ye e Tiong, 2000.
Despite the contribution of the NPV-at-Risk, this method of strategic decision of
capital investment, of return-risk, only reflects an added value for the feasibility analysis
of the sponsors of the partnerships. Ke, Liu and Wang (2008) propose a table of
methods for evaluating projects according to the type of agent involved in the
partnership. Thus, the authors point out two main criteria/methods that each agent
involved should put additional emphasis and all of them were developed based on the
concept of NPV-at-Risk. Based on the perspective of governments were adopted the
criteria of VFM-at-Risk and the SLR-at-Risk. According to the UK experience in PPP,
these projects, in the public agent view are evaluated in the logic of added value for the
public sector. The European Commission also follows this criterion and it’s contained in the guidelines for successful PPP, launched by Brussels and Australia. Meanwhile, the
Taiwan government opts for the SLR criterion for evaluating such projects (THI
Ke Liu and Wang chose the criteria of DSCR-at-Risk and TIE-at-Risk. Note that these
institutions, by financing infrastructural projects such as PPP and Private Finance
Initiative, witness the non-recourse financing logic, so there is a big difference
compared to conventional debt. So for the lenders, it will have to proceed to an analysis
of indicators if an exact project can tackle the debt and deal with any contingencies.
Compared to the first criterion, the DSCR must indicate if the project generates cash
flows in order to the service of debt be fully covered, being usually greater than 1.05.
The TIE relates to another indicator capable of measuring the ability of the agent
borrower to cover interest on indebtedness, during the time that force the same debt.
Often, the funding institutions require a TIE not inferior than 2. To determine the same,
it will be taken into account the total EBITDA divided by interest on debt. (Yli-Olli and
Virtanen, 1989 and Mansal, 2009).
To the sponsors of the partnership, underline the concept of microeconomics that
points to the primary objective of private agents: the maximization of profits (Romer,
1990; Frank, 1994; Matsumura, 1998 and Epple and Romano, 1998). So, to determine
the same maximizing results it will have to be taken into account the economic viability
of the partnerships. Since there is a close proximity between the assessment of projects
that are not PPP and these, the major difference is the fact that the period of cash flows
forecast is the concession period of the partnership and the fact that in the results of the
utility are included the payments made by the public entity. This way, it will be pointed
the criteria of NPV-at-Risk and the IRR-at-Risk (Ke, Liu and Wang, 2008).
Exhibit II: Framework of the methods.
Some authors focus that the origin of VaR systems are associated with market
risks (Dowd, 1998), not detrimental, but yet the extension of logic to other risks, such as
cases of credit risk, liquidity or cash flows. These issues, especially after the
contribution generated by the investigation of Ye and Tiong, allow us to draw a logical
decision rule based on the fact that for the sponsors of partnerships, projects are
economically and financially acceptable if, for the level of a reliable-α, the NPV-at-Risk is grather than zero. Note the multitude of possible outcomes for the uncertainty (Ke,
Liu and Wang, 2008).
In terms of results after the application of current methods of financial
evaluation, Ye and Tion applied the concept of NPV-at-Risk in two infrastructural
projects, and for this, after determining the net cash-flow, proceeded to the use of Monte
Carlo simulation of 1000 iterations. This methodology allowed the authors to
graphically represent the value of the NPV of the projects according to their cumulative
probability. They concluded, therefore, that the NPV-at-Risk can change the decisions
of capital investment in PPP, since projects with NPV very considerable may cease to
be after the application of the method, so that, even a project showed an NPV-at-Risk
negative, while the other decreased significantly. In another study by Ke, Liu and Wang
(2008), the authors applied the standard methods for each agent involved in the
preparation of a PPP to build a bridge in Romania, whose lease has a term of 30 years.
After using Monte Carlo simulation, the results show that, after the application of the
current methods of evaluation, there was a slight increase of the values of the applied
methods. Moreover, it appears that as the reliability percentage increase the indicators
deteriorate, despite the chance of financial and economic infeasibility to one of the
parts. Therefore, it is justified by the fact that several authors conclude that based on
specific characteristics of the partnerships, these are subjected to more risk (compared
to other types of infrastructure projects) and because of that, the current evaluation
methods have gained special emphasis (Ye and Tiong, 2000 and Wong, 2006). The
extension of the NPV-at-Risk method to other stakeholders will allow a more equitable
evaluation of the partnerships in question so that the contract negotiations will be more
easily accomplished and that the desired Value for Money will be more easily verified
III. The Experience of Public-Private Road Partnerships in the
Portuguese Economy
Portugal witnessed the first PPP with the project of Vasco da Gama’ bridge in 1993 and, from that moment on, several new projects have emerged, mainly road
partnerships. The remaining partnerships, afters the first, represent roughly 10 billion
euros of private investment and 20 billion euros in state payments to the 30-year-term of
the partnerships (Sarmento, 2010). In terms of economic and financial studies, which
assess the feasibility of launching a PPP in the national territory, it is considered an
inflation rate of 2%, while the discount rate, based on historical experience of
industrialized economies, should be fixed in 4%. For the service actually provided in
road partnerships, as well as the remuneration of the private agent, exists a set of four
subdivisions possible to verify: (i) the traditional granting with real tolls, in which the
private agent has the possibility of charging tolls to the users, without place for
payments by the State to the private agent; (ii) the SCUT (motorways with no cost to
user), in which there is a concession without tolling the user, i.e., the private agent do
not charge tolls and receives, therefore, payments from the State due to existing traffic,
accompanied by bands of traffic and where prices are previously agreed between them,
(iii) the lease with tolling the ex-SCUT user, which may be characterized by the fact
that the private agent charges the tolls but delivers them to the Roads of Portugal and
then receive two payments: a payment of availability (justified by the very existence of
infrastructure, with the scenario of possible deductions to those payments due to
temporary outages, as the cases of accidents of maintenance works) and a payment for
the service of collection of tolls to ex-SCUT (divided for purposes of financial reward
for investment in billing gateways and to pay operating costs and maintenance) and (iv)
sub concessions and Túnel do Marão, characterized by the fact that there is room for
two types of payment: a payment due to the existence/availability of the track and
another payment associated with the traffic, called payment of service (DGTF, 2011).
By the end of 2011, were recorded 64 PPP in operation, were 13 of these partnerships
were road. Still under construction, were approximately nine concessions and in any
new contest. Given the process of launching the tender for the partnership and the
Financial Close (signing of contract) this is quite long. This same slowness of the
process is associated to several factors, such as the number of verified proposals or the
Sousa (2008) concluded that the average timeframe between the launch of the
competition for the partnership and the Financial Close was 808 days. Since the sample
of the research has presented contests between 1997 and 2008, the author concluded that
the gap between the launch of the competition between the partnership and the Financial
Close has been declining. For example, while the granting of the Central Coast highway
(A17) presented a lengthy of 1926 days (after its launch in 1999), the granting of West
Coast (with competition started in March 2008) had a length of 339 days until the
signing of the concession contract. Another important issue to review concerns to
shareholders of the utilities and roads and yet their market share. By the end of 2008,
Mota-Engil, Engineering and Construction, SA held a market share of significantly
11.61% relating to 328 kilometres in highway concessions, by their position in the
consortia. In second place in the share market was Brisa,SA with a market share of
around 9.09% compared to 257 kilometres at dealerships concessionaires, such as could
IV. Method and Data
4.1. Methods of risk-return decision for the sponsors of Public-Private
Partnerships
Since strategic decisions for capital investment are crucial to the success of the
concessionaires of PPP, the sponsors tend to evaluate their projects based on operating
and financial cash flows (Ke, Liu and Wang, 2008). Given the problems already
mentioned, the need arose from the application of methods of risk-return for the
assessment of PPP. So, it will be applied the Value-at-Risk, Cash flow-at-Risk,
NPV-at-Risk and IRR-at-NPV-at-Risk. For these methods is necessary to resort to the methodology of
Monte Carlo simulations. This method belongs to the class of the algorithms with the
objective to carry out the repetition of the random sample in question and to compute
the recorded results. Objectively, the method will seek to replace a physical or
mathematician process by a probabilistic process. Random or pseudo-randomly
sampling generated computationally will ensure the treatment of deterministic
questions. (Fishman, 1995 and Du and Li, 2008) Thus, among the key stages required
by the methodology should be included (i) the definition of variables to consider, (ii) the
probability distributions of our random variables and also (iii) their cumulative
probability functions of the variables in focus.
4.1.1. Value-at-Risk
The first metric to be described is the Value-at-Risk, aiming to quantify and
assess the exposure of a company, investment or project risk and uncertainty (Sharpe,
1970, Marshall and Siegel, 1996 and Linsmeier and Pearson, 2000). Formally, the
Value-at-Risk attempts to quantify the worst expected loss over a certain time frame, in
normal market conditions and to a certain level of confidence. We can also define this
metric as represented by the quartile of the projected distribution of profit and loss, to
the horizon under consideration (JP Morgan and Reuters, 1996). Take c as the
confidence level predetermined, so that the Value-at-Risk will correspond to the lower
tail of the distribution, 1-c (Jorion, 2000). Thus, this metric can assign to a certain level
of confidence that will not lose more than a certain level of project, in an amount, for an
the knowledge of the function of conditional probability based on the statistical
definition of the metric itself, given by:
Equation I: Expression of VaR
Where is the cumulative density function of revenues, probability
density function of P, c the confidence level and finally ∆P(N) = ∆Pt(N) the relative
change occurred in the value of the project, over the time frame concerned, N. It should
be stressed that ∆Pt(N) = P(t + N) – Pt.P(t + N) will represent the natural logarithm of the project over time, t + N and Pt the natural logarithm of the moment t. Thus, the
method of Monte Carlo simulations will proceed to use the observed changes in their
market facts of the last “n” periods under review and therefore will generate “N”
simulations for the value of a portfolio or project at a future date, given by t + N.
However, there is still a need for specification of the stochastic process and the
parameter that will ensure a better analysis of the dynamics of risk and uncertainty.
Finally, the price of assets (the road infrastructure in the case of PPP in analysis) at time
t + N, from the simulated factors, will give rise to the Value-at-Risk of partnerships.
4.1.2. Cash flow-at-Risk
Despite the close methodological proximity between the Value-at-Risk and Cash
Flow-at-Risk, in fact there is a substantial difference between them. Under the PPP, it is
noted that the metric of the Value-at-Risk aims the calculation of change in value, in
amount, while the cash flows consummate the effectiveness of the partnership in
question. Thus, the metric of cash flow-at-Risk, can be understood as well as a
methodology of Monte Carlo simulation with a winder horizon, catching up with the
evolution of the cash flows of the project. This method also based on statistical
methodology, also reflects the evolution of various other determinants that affect costs,
revenues and infrastructure of concessionaires and therefore the actual cash flows
generated over time (Youngen, Guth, and Tennican Usher, 2001). On the other hand, it
may avail itself of the cumulative distribution function of the cash flows of the projects
infrastructure and capital inflows on the capital and debt financing, depending on the
capital structure adopted by each highway concessionaire, as denoted on figure 3.
Exhibit III: Cumulative inflows and outflows from concessionaire´s equity and loan from lenders.
Source: authors.
This way, there is a possibility of obtaining an approach to quantify the
differential deviation between the cash flow actually recorded and cash flow planned
and budgeted, caused by factors affecting the project risks, based on a certain level of
trust and for a defined time horizon. However, for the correct application of the method,
it is necessary to ensure a probability distribution for expected future cash flows of the
project.
4.1.3. Net Present Value-at-Risk
From the various possible settings to find to describe the risk concept, it may
assist itself of the risk while this is the half-variance of all the consequences (although
only be taken by the risk of undesirable effects), which, together with the criterion of
NPV, will result in a method of decision of risk-return. This way, the draft must be
feasible if the differential between the average value of the NPV and the standard
confidence for the rule of investment decision. This culminates in NPVα imperative for
a given level of significance, to be greater than zero, instead of the previous condition.
Accordingly, the new metric can be understood as the value in which α% of the possible
NPV are inferior and in which 1- α% are superior (Ye and Tiong, 2000). A sensitive question concerns with the use of appropriated discount rate despite the traditional
models of the CAPM and APT. Note that in both cases it would involve the
determination of the betas of projects of the PPP, not so easy compared to a financial
asset. Contrary to some metrics of financial evaluation, such as the CAPM and the APT,
the WACC method is a metric that takes into account the different costs of capital,
weighted by their respective weight. Note, however, that the costs of funding sources
are precisely the expectable returns by investors and the PPP, having these, the specific
characteristic of a reduced proportion of capital comparatively to the financial debt.
Thus, the rate of return on capital will be given by the rate of return required by the
sponsors of PPP, while the return of the financial debt may be regarded as the average
interest rate of market to financial projects. Despite this, the WACC can not adequately
represent the risk premium required, although it often takes place as being an
approximation. However, this does not represent that the WACC can be validly used to
deal with the issue of risk or uncertainty.
Taking the probability density function of the returns of the project (see
appendix XIII), f(NPV), the NPV-at-Risk is given by the integration between -∞ and
NPVα,equalling the actual α, in it is turn, the level of trust for NPV null is given by the integral between -∞ and 0 (appendix XIV). Since the NPVs are normally distributed statistically, the NPV-at-Risk may be determined as mentioned above, such that:
Equation II: Expression of NPV-at-Risk
(α) . σ
where Z(α) represents the number of units of standard deviation associated with the
predetermined confidence level, α. Moreover, taking F(NPV) as the cumulative distribution function, it will be able to proceed feature analysis of that distribution for
percentiles for determining the metric NPV-at-Risk for a given level. As well as the
confidence level associated with a null NPV (figure 4). In the case of the distribution of
alternative to generate these distributions. The distribution function may be aided by the
empirical distribution function. Fn(NPV) = (#NPVi ≤ NPV)/n, where #NPVi represents the multiple results of simulations (Ye and Tiong, 2000). This should lead to the
determination of the percentile Fn-1(α) which will culminate in NPVα.Thus, within the Monte Carlo method, the NPV of net revenues generated by operation of the
concessionaire in a given period T0=t, is still given by:
Equation III: Determination of NPV
Equation IV: Determinação das Receitas iniciais da concessionária
where NCFi represents the net cash flows, Ii0 the revenues from baseline to the current
moment, Ci0 the operating and maintenance costs until the moment, r the discount rate
in force, Qi0 the demand infrastructure and Pi0 the price associated with the use of the
road concession this year.
Exhibit IV: Calculation of NPV-at-Risk and confidence level based on simulation generated distribution.
Source: authors.
Since this metric is obtained this way, it will be possible to verify a scenario of
estimation error, from some causes, such as (i) a cash flow model not adjusted to reality,
Kolmogorov-Smirnov test, for example, may be a solution to validate the reliability of
the distribution and the NPV-at-Risk. This test will seek to compare the distances
between the empirical distribution function and theoretical distribution function in
question, which constitute the null hypothesis, based on the following statistic test:
Equation V: Test statistic of Kolmogorov-Smirnov
( ) ( )
sup F x F0 x
Dn x n
where F(x) and F0(x) represent the empirical and theoretical functions, respectively and
Dn the discordance between the two functions. Alternatively, the confidence bands can
be determined by dαn = dα/√n, depending on the level of significance and the sample size (Lilliefors, 1967 and Justel, Peña and Zamar, 1997).
4.1.4. Internal Rate Return-at-Risk
The internal rate of return is, also, another of the methods used to evaluate
strategic decisions of capital investment. Thus, this metric is based on a discount rate
that will ensure a net present null value. In PPP, given the need for more efficient
management by the private agents, the uncertainty is present in several stages of the
partnership, since the building up process until the costs related to maintenance and
operational infrastructure, passing through the revenue collection from road traffic. As
in the metrics earlier discussed, the concept of risk and uncertainty in various stages of
the PPP it will be present by the introduction of a significance level in the statistical
approach and in the distribution of cash flows associated with each road infrastructure,
which will culminate in the determination of the IRR-at-Risk with a certain degree of
confidence.
4.2. Application of the current methods of evaluation of the
Public-Private Partnerships
The current methods of financial evaluation, of risk-return for the sponsors of
the PPP, will be applied to the reality of the Portuguese economy, specifically the road
Value-at-Risk and IRR-at-Value-at-Risk will, consequently, have a set of fourteen road projects, being
seven of these related to SUCTand the remaining seven of “new subconcessions” or
“new highways”.
In total, we have an investment in national road infrastructure of 930 and 1.806
kilometres of SCUT concessions and Highways, respectively. In terms of capital
expenditure, these road projects represent significantly, 6.359 ME (46% of which
related to SCUT and 54% to Highway), whose concession period is, in the case of
SCUT, thirty and forty years in the case of Highways. The research methodology will
be based in developing present and future mappings of cash flows of the partnerships, to
be possible to quantify the free cash flow of projects and thus determine the NPV of
these. Subsequent to this mapping of cash flows, it will be applied the Monte Carlo
method to simulate 1000 iterations, so that it’s possible to plot the cumulative density
functions of the projects examined. To construct the map of cash flows of the project
necessary to determine the return-risk metric to be applied, will be used some
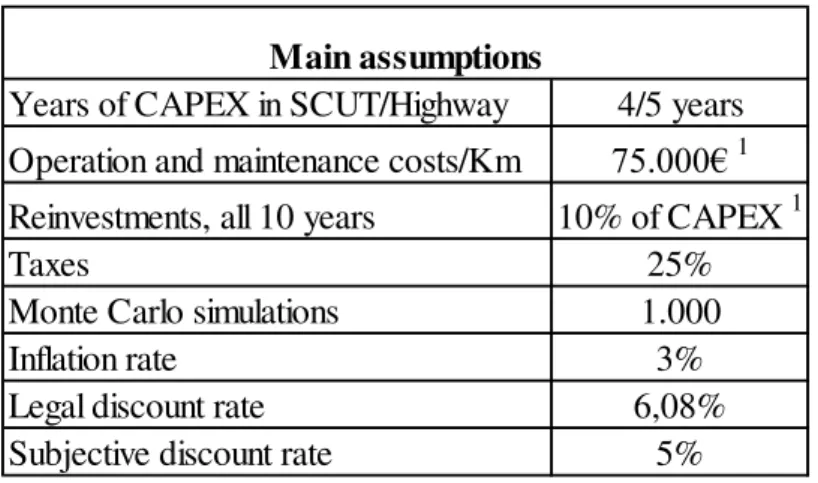
assumptions indicated below in Table 1.
Table I: Main assumptions assumed for the cash-flows models.
The NPV of each PPP will be determined based on the WACC to update the
cash flows of the projects. It will be also determined the NPV based on the legal
discount rate and on the subjective rate. In appendixes XV and XVI it is also possible so
see graphical representations of the mapping of cash flows, where it is possible to
observe the dynamics associated with the evolution of such flows with the evolution of Years of CAPEX in SCUT/Highway 4/5 years
Operation and maintenance costs/Km 75.000€ 1 Reinvestments, all 10 years 10% of CAPEX 1
Taxes 25%
Monte Carlo simulations 1.000
Inflation rate 3%
Legal discount rate 6,08%
Subjective discount rate 5%
Main assumptions
1
years of grant projects. The data relative to public sector payments to concessionaires
are available from the reports of the Audit Court of Portugal while the capital
expenditure report for the data of the Portuguese Public Road Institute (IEP) and by its
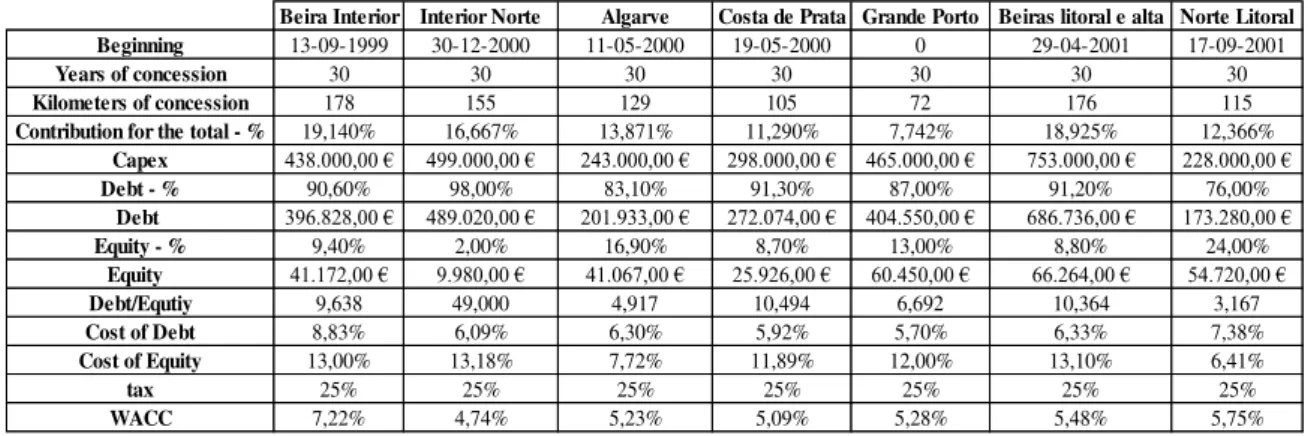
licensees. In tables II and III are available the main financial information for each
SCUT concession and highway.
Table II: Main informations about the SCUT concessions and the equity and financial structure (values in euros).
Source: Portuguese Public Road Institute(IEP).
Table III: Main informations about the new highways concessions and the equity and financial structure (values in euros).
Source: Portuguese Public Road Institute(IEP).
Beira Interior Interior Norte Algarve Costa de Prata Grande Porto Beiras litoral e alta Norte Litoral
Beginning 13-09-1999 30-12-2000 11-05-2000 19-05-2000 0 29-04-2001 17-09-2001
Years of concession 30 30 30 30 30 30 30
Kilometers of concession 178 155 129 105 72 176 115
Contribution for the total - % 19,140% 16,667% 13,871% 11,290% 7,742% 18,925% 12,366% Capex 438.000,00 € 499.000,00 € 243.000,00 € 298.000,00 € 465.000,00 € 753.000,00 € 228.000,00 €
Debt - % 90,60% 98,00% 83,10% 91,30% 87,00% 91,20% 76,00%
Debt 396.828,00 € 489.020,00 € 201.933,00 € 272.074,00 € 404.550,00 € 686.736,00 € 173.280,00 €
Equity - % 9,40% 2,00% 16,90% 8,70% 13,00% 8,80% 24,00%
Equity 41.172,00 € 9.980,00 € 41.067,00 € 25.926,00 € 60.450,00 € 66.264,00 € 54.720,00 €
Debt/Equtiy 9,638 49,000 4,917 10,494 6,692 10,364 3,167
Cost of Debt 8,83% 6,09% 6,30% 5,92% 5,70% 6,33% 7,38%
Cost of Equity 13,00% 13,18% 7,72% 11,89% 12,00% 13,10% 6,41%
tax 25% 25% 25% 25% 25% 25% 25%
WACC 7,22% 4,74% 5,23% 5,09% 5,28% 5,48% 5,75%
Pinhal Interior AE transmontanas Douro Interior Baixo Alentejo Baixo Tejo Litoral Oeste Algarve Litoral
Beginning 2007 2008 2008 2009 2009 2009 2009
Years of concession 40 40 40 40 40 40 40
Kilometers of concession 567 186 250 344 77 109 273
Contribution for the total - % 30,882% 10,131% 13,617% 18,736% 4,194% 5,937% 14,869% Capex 958.000,00 € 542.000,00 € 649.000,00 € 390.000,00 € 276.000,00 € 452.000,00 € 168.000,00 €
Debt - % 85,00% 80,00% 81,00% 73,00% 86,00% 85,00% 61,00%
Debt 814.300,00 € 433.600,00 € 525.690,00 € 284.700,00 € 237.360,00 € 384.200,00 € 102.480,00 €
Equity - % 15,00% 20,00% 19,00% 27,00% 14,00% 15,00% 39,00%
Equity 143.700,00 € 108.400,00 € 123.310,00 € 105.300,00 € 38.640,00 € 67.800,00 € 65.520,00 €
Debt/Equtiy 5,667 4,000 4,263 2,704 6,143 5,667 1,564
Cost of Debt 6,30% 5,60% 6,30% 5,80% 5,80% 6,50% 7,20%
Cost of Equity 10% 10% 10% 10% 10% 10% 10%
tax 25% 25% 25% 25% 25% 25% 25%
V. Analysis and discussion of results
5.1. Traditional methods
After the sampling delimitation and methodological, as well as the
characterization and presentation of the capital structure of each road partnership, it will
be analysed and discussed the results obtained after the application of the current
methods above. Note that this analysis due to the methodology of risk-return, when
compared against the traditional methods of financial evaluation, will not have a nature
of decision and of preference or choice of projects, but an interpretation and analysis of
metrics applied.
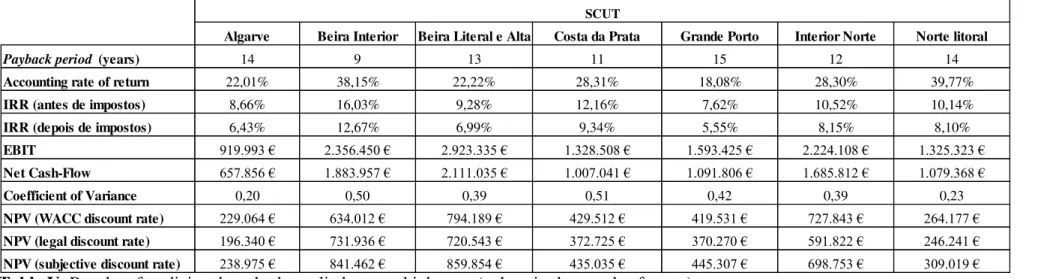
Although this metric does not allow the distinction between preference between
projects, the payback period in the case of SCUT, indicates that the payback is between
nine and fifteen years. In the case of IRR and Accounting Rate Return (ARR), these do
not allow distinguishing between the preferable SCUT. However, both rates are higher
than the discount rates used (legal, subjective and by the WACC). For purposes of the
NPV, we proceeded to update the cash flows based on various discount rates. In all
SCUT it is verified that PPP are investible, since the respective NPV values are greater
than zero. In the case of the coefficient of variance, it is important to note that this
metric was used in preference to others (such as the method of mean-variance), because
this power to judge the preference for projects. However, this method is also insufficient
for decision effects. It is understood, therefore, the ability to make decisions as a
possibility of analysis of the trade-off between return and risk.
For the case of new “sub concessions”, financial analysis with traditional metrics seems to indicate the same conclusions. All seem to reflect the financial viability of
projects. The imperative of recovery periods on investment (payback) higher is justified
by the fact that the new Highways report to time horizons of, roughly, 40 years.
Compared to SCUT, there is the existence of several projects in which the net
cash-flows are negatives although the present net values also be positive, and so, investible.
In a hypothetical scenario of NPV lower than zero, it may justify a change in
management practices of the concessionaire or in a limit scenario, a renegotiation of