Carlos Pestana Barros & Nicolas Peypoch
A Comparative Analysis of Productivity Change in Italian and Portuguese Airports
WP 006/2007/DE _________________________________________________________
Tanya Araújo and Francisco Louçã
The Dynamics of Speculative Markets: The Case of
Portugal’s PSI20
WP 34/2008/DE/UECE _________________________________________________________
Department of Economics
W
ORKINGP
APERSISSN Nº0874-4548
School of Economics and Management
The Dynamics of Speculative
Markets: The Case of Portugal’s
PSI20
Tanya Ara´
ujo
∗and Francisco Lou¸c˜a
ISEG (School of Economics and Management)
Technical University of Lisbon (TULisbon)
Rua do Quelhas, 6 1200-781 Lisboa Portugal
Research Unit on Complexity in Economics (UECE)
†June 14, 2008
1
Introduction
This paper develops and applies a stochastic geometry approach designed to describe the dynamics of the object emerging from the collective behavior of a complex system. In the current case, the market is analyzed according to the evolution of the population of 19 stocks of the PSI20 index for the period from October 2006 to April 2008.
For this purpose, we apply a methodology previously developed in other work ([1], [2]), in order to compare the dynamics and namely the changes in the evolution of the Portuguese financial market, as described by the index representing its most important firms. In the second section, we briefly recapitulate the methods and previous results, whereas in the third section the method is applied to the PSI20 data and the results are compared to our previous conclusions as obtained from the US market.
∗Corresponding author: tanya@iseg.utl.pt
We define a metric and use a properly defined distance, computed from the correlation coefficients between daily returns of the stocks. We proceed to the identification of the geometric object formed by the set of distances among such firms. The results prove that the resulting ellipsoid is a cloud of points, which is uniformly distributed along its first leading directions, when-ever business-as-usual predominates, but that it is suffers swhen-evere distortions along several dimensions whenever a crisis occurs. The geometric properties of the dynamics of this market can be measured and guide an empirically oriented interpretation of its evolution ([1], [2]).
The approach we suggest allows for:
1. the identification of the minimum number of relevant dimensions de-scribing the evolution of the market;
2. the identification of the dimensions along which the distortion occurs and
3. the measurement of the effect of that distortion
2
The stochastic geometry approach
Unless the proportion of systematic information present in correlations be-tween stocks in a complex system is relatively small, the corresponding man-ifold is a not a low-dimensional entity and therefore its understanding is virtually unreachable. But the evidence of alternate states of apparent ran-domness and the emergence of structured collective dynamics suggests it may correspond to a low-dimensional object. The rationale for this intuition is as follows: considering the existence of competition among multiple agencies, firms, information and strategies, the response by the agents to the multiple signals can create an object comparable to that obtained from random pro-cesses, which is a powerful analogy for such markets except when collective behavior emerges and dominates its dynamics. If this is the case, the relevant point is to capture this evolution and we are reduced to an embedding ques-tion, the definition of the smallest manifold that contains the set of points describing the market. In that case, its dynamics can be observed as its form is shaped by the occurrence of bubbles and crises.
2.1
The metric and the definition of a distance
From the set of returns of the stocks and their historical data of returns over the time interval, and using an appropriate metric ([3],[4]), we compute the matrix of distances between the stocks. Considering the returns for each stock,
r(k) = log(pt(k))−log(pt−1(k)) (1)
a normalized vector
−→ρ(k) = −→r(k)−h−→r(k)i q
n(hr2(k)i−hr(k)i2) (2)
is defined, where n is the number of components (number of time labels) in the vector −→ρ. With this vector the distance between the stocks k and l is defined by the Euclidian distance of the normalized vectors.
dij = p
2 (1−Cij) = k−→ρ(k)− −→ρ(l)k (3)
as proposed in [3] and [4], withCij being the correlation coefficient of the returns r(i),r(j).
2.2
Identification of the relevant directions and the
in-dex
S
As the distance is properly defined, it is possible to obtain, from the matrix of distances, the coordinates for the stocks in a Euclidean space of dimension smaller than N. Then the standard analysis of reduction of the coordinates is applied to the center of mass and the eigenvectors of the inertial tensor are computed.
The same technique is applied to surrogate data, namely to data obtained by independent time permutation for each stock and these eigenvalues are compared with those obtained in from the data, in order to identify the directions for which the eigenvalues are significantly different.
sorted eigenvalues is characteristic of random cases and is also experimentally observed when the market space is built from historical data corresponding to a period of business as usual.
The procedure is straightforward. After the distances (dij) are calculated for the set of N stocks, they are embedded in RD, where D < n, with coor-dinates −→x(k). The center of mass −→R is computed and coordinates reduced to the center of mass.
− →
R = Σ−k→x(k)
k (4)
−
→y(k) = −→x(k)−−→R (5)
and the inertial tensor
Tij = Σk−→yi(k)−→yj(k) (6)
is diagonalized to obtain the set of normalized eigenvectors{λi,−→e i}. The eigenvectors −→ei define the characteristic directions of the set of stocks. The characteristic directions correspond to the eigenvalues (λi) that are clearly different from those obtained from surrogate data. They define a reduced subspace of dimension f, which carries the systematic information related to the market correlation structure. In order to improve the decision criterion on how many eigenvalues are clearly different from those obtained from surrogate data, a normalized difference τ is computed:
τ(i) =λ(i) + 1−λ′(i) (7)
and the number of significantly different eigenvalues is given by the high-est value of i to which (τ(i)−τ(i−1))>3(τ(i+ 1)−τ(i)).
It was empirically found that markets of different sizes, ranging from 70 to 424 stocks, across different time windows (from one year to 35 years) and also from different market indexes1 have only six effective dimensions ([5],
[1], [2]).
This corresponds to the identification of empirically constructed variables that drive the market and, in this framework, the number of surviving eigen-values is the effective characteristic dimension of this economic space. Taking the eigenvalues of order smaller or equal than the number of characteristic
dimensions, the difference between eigenvalues from data and those obtained from surrogate data are computed. The normalized sum of those differences is the index S, which measures the evolution of the distortion effect in the shape of the market space.
St= Σ6i=1
λt(i)−λ′t(i)
λ′t(i) = Σ6i=1
λt(i)
λ′t(i) −1 (8)
where λt(1), λt(2), ..., λt(6) are the six largest eigenvalues of the market space and λ′
t(1), λ′t(2), ..., λ′t(6) are the largest six eigenvalues obtained from surrogate data. In computingS, at a given timet, bothλtandλ′tare obtained over the same time window and for the same set of stocks.
3
The dynamics of the Portuguese financial
market
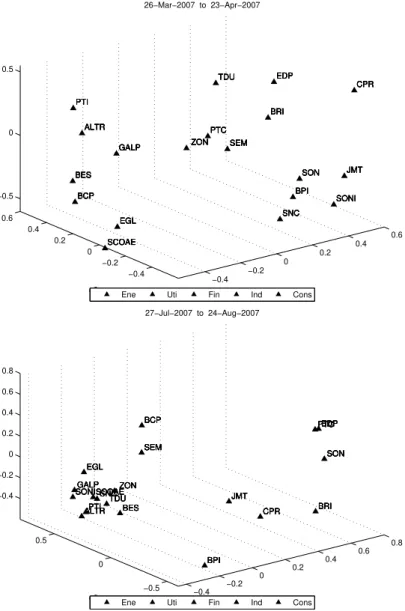
This method is applied to the data describing the daily evolution of the PSI20, the index representing the major players in the Portuguese stock market. In Figure 1, we show the object describing the evolution of the market as replicated in the three dominant directions, as obtained follow-ing the method indicated in the last section, and the object of a period of business-as-usual is compared to another formed in a period of crash. The differences are imposing, since in the latter type of situation the clustering of firms (colored accordingly to the sector they belong) and the deformation of the market space are obvious.
The changing patterns for this period are notorious. In Figure 1, we show the object describing the evolution of the market as replicated in the three dominant directions, as obtained following the method indicated in the last section, and the object of a period of business-as-usual is compared to another formed in a period of crash. The differences are imposing, since in the latter type of situation the clustering of firms (colored accordingly to the sector they belong) and the deformation of the market space are obvious.
The object has a characteristic dimension, which allows for a description projecting its typical shape and the identification of the patterns of its evolu-tion. The index S is useful for this identification of shapes and patterns and the results of its computation for the whole period are indicated in Figure 2, in which the impacts of the shock waves of crashes are evident. Looking for relevant distortions in the shape of the market space the subprime crises (August 2007 to the Winter 2008) attain the highest values of S. These crashes can be classified according to a seismography measuring their impact and characteristics, as we previously proposed ([2]).
The index provides information on the evolution of the object describ-ing the dynamics of the markets. It indicates the moments of perturbations, proving that the dynamics is driven both by shocks and by structural change. This is graphically evident in Figure 2 and is confirmed by the rigorous mea-surement of the distortion of the shape of the object describing the market. In Figure 2, the seismography of crashes is depicted, registering those crashes attaining S > 5.
4
Conclusion
References
[1] Ara´ujo T., Lou¸c˜a, F. (2007), The Geometry of Crashes - A Measure of the Dynamics of Stock Market Crises, Quantitative Finance, 7(1).
[2] Ara´ujo T., Lou¸c˜a, F. (2008), The Seismography of Crashes in Financial Markets, Physics Letters A, Vol. 372.
[3] Mantegna R.N. (1999), Hierarchical structure in financial markets, Eu-ropean Physics Journal B 11.
[4] Mantegna, R.N., Stanley, H.E. (2000), An Introduction to Econophysics: Correlations and Complexity in Finance, Cambridge, Cambridge Uni-versity Press.
−0.4 −0.2 0 0.2 0.4 0.6 −0.4 −0.2 0 0.2 0.4 0.6 −0.5 0 0.5 CPR CPR CPR CPR CPR JMT JMT JMT JMT JMT SONI SONI SONI SONI SONI SON SON SON SON SON BPI BPI BPI BPI BPI SNC SNC SNC SNC SNC EDP EDP EDP EDP EDP BRI BRI BRI BRI BRI SEM SEM SEM SEM SEM TDU TDU TDU TDU TDU PTC PTC PTC PTC PTC 26−Mar−2007 to 23−Apr−2007
ZON ZON ZON ZON ZON EGL EGL EGL EGL EGL GALP GALP GALP GALP GALP SCOAE SCOAE SCOAE SCOAE SCOAE e2 ALTR ALTR ALTR ALTR ALTR BCP BCP BCP BCP BCP PTI PTI PTI PTI PTI BES BES BES BES BES
Ene Uti Fin Ind Cons
−0.4 −0.2 0 0.2 0.4 0.6 0.8 −0.5 0 0.5 −0.4 −0.2 0 0.2 0.4 0.6 0.8 SON SON SON SON SON EDP EDP EDP EDP EDP BRI BRI BRI BRI BRI PTC PTC PTC PTC PTC e1 CPR CPR CPR CPR CPR JMT JMT JMT JMT JMT BPI BPI BPI BPI BPI 27−Jul−2007 to 24−Aug−2007
BCP BCP BCP BCP BCP SEM SEM SEM SEM SEM BES BES BES BES BES ZON ZON ZON ZON ZON TDU TDU TDU TDU TDU SNC SNC SNC SNC SNC e2 SCOAE SCOAE SCOAE SCOAE SCOAE PTI PTI PTI PTI PTI EGL EGL EGL EGL EGL ALTR ALTR ALTR ALTR ALTR GALP GALP GALP GALP GALP SONI SONI SONI SONI SONI
Ene Uti Fin Ind Cons
Nov06 Feb07 Jun07 Sep07 Dec07 Apr08 0
2 4 6 8 10 12 14
PSI20 19 stocks
S
2006 2007 2007 2007 2007 2008
0 0.5 1
S>5
Nov06 Feb07 Jun07 Sep07 Dec07 Apr08 0
2 4 6 8 10 12 14
S&P500 424 stocks
S
2006 2007 2007 2007 2007 2008
0 0.5 1
S>5