W
School of Economics and Management TECHNICAL UNIVERSITY OF US BON .STORE PATRONAGE: THE UTILITY OF A MULTI-METHOD,
MULTI-NOMIAL LOGISTIC REGRESSION MODEL FOR PREDICTING
STORE CHOICE
Luiz Moutinho
University of Glasgow - Department of Business and Management. [email protected]
Graeme D. Hutcheson
Abstract
University of Manchester. Management and Institutional Development Group. [email protected]
Factor, multinomial logistic regression and cluster analyses are used in combination to provide a predictive model of store patronage behaviour for consumers in Cardiff, Wales. A subset of variables and factors that are important for consumers when choosing a supermarket were used to provide a picture of each store's clientele. Multinomial logistic regression allowed an overall model of supermarket choice to be developed and also enabled comparisons to be made of individual supermarkets within the sample. A detailed picture of store patronage is presented along with predictions about store choice for a number of "consumer clusters". The results demonstrate the utility of the predictive multinomial models when used in conjunction with other analytical techniques and reinforces a number of studies that have investigated patronage behaviour.
INTRODUCTION
A number of recent research studies have analysed management cha-llenges in retailing (Dawson 2000), as well as the UK supermarket industry in terms of corporate, social and financial performance (Moore and Robson 2002).
PoRTUGUESE JoURNAL OF MANAGEMENT STUDIES, VOL. X/, N. 0 1, 2006
few years (Corporate Watch, 2002). The retail environment is changing rapidly and is characterised by increasing competition from both domestic and foreign companies and more demanding consumers who have greater expectations related to their consumption experiences (Sellers, 1990). Consequently, retailers today must differentiate themselves by meeting the need of their customers better than the competition. Given the size of the market and the competitive environment, it is not unexpected that there has been considerable interest in modelling consumer patronage behaviour.
Perhaps the most obvious factors in choosing a store is the quality and variety of goods on offer and their relative price. Although it would appear that cheaper prices should play an important role in attracting customers, it has become clear that price competition is not the sole answer to increasing market share. For example, almost half of the 1,000 shoppers surveyed by Strachan (1997) indicated that they did not visit the supermarket they believed offered the cheapest prices. In addition to this finding, Dickson and Sawyer (1990) found that purchasers spend only a short time making their selection and many do not check an item's price when they select it. As a result, over fifty percent could not correctly name the price of an item just placed in a trolley, and over half of shoppers purchasing a special offer product were unaware of their saving. A study by Hortman, McCurley, Allaway, Mason and Rasp (1990), into consumer choice also revealed the relative lack of importance of everyday low prices to consumers. Although quality of produce has been found to be of importance to consumers, it may not in fact exert much of an influence on patronage behaviour (Hutcheson and Moutinho, 1998). Given the uniformly high quality of produce offered by all of the retailers in this study, quality of produce did not reliably differentiate between stores (that is, consumers choose one store over another on the basis of information other than quality). Quality and price and the delivery of high service quality (Reichheld and Sasser, 1990) are not the only variables likely to have an impact on store patronage as there are a number of extrinsic product cues that may also influence store choice (see, for example, Dawar and Parker, 1996; Monroe and Chapman, 1987; Monroe and Krishnan, 1985; Moutinho and Hutcheson, 2000; Rao and Monroe, 1989; Teas and Agarwel, 2000). It is clear from the literature that consumers are taking account of more than just price and promotional offers when deciding where to shop.
PoRTUGUESE JOURNAL OF MANAGEMENT STUDIES, VOL. X/, N. 0 1, 2006
that 74.2% of consumers did their regular major grocery shop by car in 1998 (up from 73.7% in 1997). It is clear that the provision of car parking, adequate road access and facilities for cars will exert a powerful influence on consumer choice. How important car use, or indeed distance of the stores from consumers, is likely to be in the future is open to question, as there are growing numbers of supermarkets offering internet-based shopping and home delivery (for example, Asda, Sainsburys, Tesco and Iceland). If this trend continues, actual store placement may become less relevant as a factor related to store choice (see Balabanis and Vassileoiu, 1999; Berthon, Pitt and Watson, 1996; Rowley, 2000).
A typology of discount shoppers based on shopping motives, store attributes and outcomes has been developed by Jin and Kim (2003), whereas Kincade and Moye (2003) explored differences in store patronage and attitudes towc;~rds retail store environments which led them to devise shopping orientation segments.
Because of increasing time pressure, many consumers are becoming concerned about the efficiency of their shopping patterns as they put a premium on their time and view it as a scarce resource. Messinger and Narasimham (1997) looked in detail at consumers' economising on shopping time and found that one of the factors likely to have an important effect on store choice is the degree to which stores are convenient and allow consumers to save time shopping. One of the indicators of the importance of speed and convenience is the rise of one-stop shopping, which offers substantial time savings for the consumer. Messinger and Narasimham suggest that the greater prevalence of one-stop shopping has been the response to growing consumer demand for time-saving convenience. For grocery retailing, it has been argued that location and convenience are the determining factors for store choice (Magi and Julander 1996).
Consumer choice is not only related to store location and what they have to offer, but is also likely to be related to a number of consumer-specific factors such as social class, the type of family unit, age and lifestyle, the amount of goods purchased (Bell, Ho and Tang, 1998) and brand and store loyalty (Aaker, 1996; Fournier and Yao, 1997; Macintosh and Lockshin, 1997; Shocker, Srivastava and Ruekert, 1994). Research conducted by Dickson and Maclachlan (1990) was designed to see whether a conceptualisation of social distance (as measured by social class variables) between shoppers and stores would provide a basis for understanding store avoidance behaviour. Controlling for other functional aspects of store image such as price and personnel, the social distance measure was found to be influential in discriminating shopping groups, providing evidence that people tend to avoid stores that are perceived as being socially distant from themselves. In addition to social distance, a consumer's lifestyle and life-stage can exert an influence over store choice (Narayaman 1998). Clearly such consumer-specific factors need to be considered when supermarket preference is being modeled.
PoRTUGUESE JoURNAL OF MANAGEMENT STUDIES, VOL. X/, N. 0 1, 2006
The influence of usage situation and consumer shopping orientations have a degree of impact on the importance of the retail store environment (Moye and Kincade 2002). Rhee and Bell (2002) studied the inter-store mobility of supermarket shoppers, whereas Sirohi, Mclaughlin and Wittink developed a model of consumer perceptions and store loyalty intentions for a supermarket retailer. The influence of need for closure and perceived time pressure on search effort for price and context was also analysed by Vermeir and Van Kenhove (2004). Furthermore, Severin, Louviere and Finn (200) studied the stability of retail shopping choices over time and across countries.
Store environment can also significantly affect sales, product evaluations and satisfaction (Bitner 1990). In fact, it has been shown that attitudes towards the store environment are sometimes more important in determining store choice than are attitudes towards the merchandise. A customer's satisfaction and general mood may even significantly affect purchasing behaviour with satisfied customers spontaneously spending more on products (Spies, Hesse and Loesch, 1997). A key role that store environment plays is to provide informational cues to customers about merchandise and service quality (Gardner and Siomkos 1985; Zeithaml1988) which have been identified as critical components in the consumer's decision-making process (Dodds, Monroe and Grewal 1991; Kerin, Howard, and Jain 1992).
Customer satisfaction has been identified as being of importance, with much of the literature taking as given the notion that satisfaction is a proxy for store repatronising behaviour. The existence of possible causal links between perceived service quality and customer satisfaction, and which of the constructs has a direct impact on customer loyalty, has been debated in the literature (Anderson, Forwell and Lehman 1994; Cronin and Taylor 1992; 1994; Teas 1993; Parasuraman, Zeithaml and Berry, 1994; Rust and Zahorik, 1993; Simester, Hauser, Wernerfelt and Rust, 2000; Yi, 1990). As Cronin and Taylor ( 1992) argue, it seems reasonable that customer satisfaction is affected not only by the quality of what the customer receives, but also by price and convenience. While customer satisfaction may be of importance generally, it should be noted that costs of dissatisfaction could outweigh the benefits of satisfaction as exceeding customer expectations will merely retain current customers whilst dissatisfaction is likely to result in customers going elsewhere, at least in the short-term. This view is reinforced by Anderson and Sullivan (1993), who found that quality falling short of expectations has a greater effect on satisfaction (and therefore store patronage) than does quality that exceeds expectations (see also, Oliver, 1980; Churchill and Surprenant, 1982).
Clarke (2000) focused on the changing nature of retail competition and the way it affects local consumer choice in the UK grocery sector. This outlook integrated the economic aspects of competition with the changing corporate geographies of retailers. Links are made between vertical market power (i.e., relative to suppliers) and multiple retailers' ability to compete horizontally (relative to other retailers) in
PORTUGUESE JOURNAL OF MANAGEMENT STUDIES, VOL. X/, N. 0 1, 2006
a given trading locality. It is argued that this interaction has fundamentally altered the nature of competition and the increase in retail power that has resulted has started to redefine local consumer choice. Smaller retailers are disadvantaged by this shift because it has directly affected the store and product choices of consumer groups depending on their relative mobility.
Clearly, there are a number of variables that have been shown to affect supermarket choice and the research reviewed above provides an indication of at least some of the factors that may influence consumers. Although many of these factors can be expected to operate in all markets regardless of location, it is likely that the local environment and local conditions also exert an influence on consumer choice. Indeed, it may be the case that variables that are important generally, do not exert an influence at a local level for a particular location. A store's clientele may therefore be influenced by 'general' factors such as the store's image, perceived quality, atmosphere and value for money; beliefs generated in most part by national advertising, but will also be influenced by local factors such as the supermarket mix, saturation, geographical placement, age of store, local reputation, quality of road access and proximity to residential housing. Consumers' store choice will be based in part upon the national image of the stores and in part upon local factors. This project looks at the effect that a number of variables have on consumer choice in a specific location. It identifies those variables that may usefully be included in a general model of patronage behaviour and provides predictions based on a multi-method analysis of the relationship between store choice and a number of variables. A multi-method approach is employed to provide predictive models that can be used on the present data base, but more importantly, applied to other data collected from alternative locations (the analysis provides models that are locally-based). Firstly, factor analysis is used to identify the underlying structure of the data and provide indicators of relatively independent constructs that can be used in a regression analysis. A theoretically-based model-building approach is used to derive a model for store choice using a multinomial logistic regression. Predictions are then obtained for a number of selected supermarket comparisons using clusters of consumers defined from the data. It is important to model patronage at a local level as a particular store's customer base will be affected to a large degree by local factors; for example, store placement, the mix of stores available, the relative age of the stores and local customer loyalty. National data will conceal local differences and cannot provide the detailed information for modeling patronage at individual stores. It is also important to derive predictions about patronage from these local models using clusters derived from the local population as the client base is likely to be heavily dependent upon location.
PORTUGUESE JoURNAL OF MANAGEMENT STUDIES, VOL. X/, N. 0 1, 2006
Allenby and Leuk, (1994), Chib, Greenberg and Chen (1998), Koelemeijer and Oppewal (1999) and Murthi and Srinivasan (1998)). This paper extends the technique to provide predictions about individual stores based on naturally occurring clusters in the sample. The emphasis is therefore on the illustration of the effects shown to be important in the model.
METHOD
This project was undertaken in Cardiff, Wales, using a sample of consumers chosen to represent the most important geo-demographic clusters in the city. Households were selected on the basis of a k-systematic interval, depending on the type of dwelling in each location. 637 people were questioned using a "drop in" and "collect data at a later date" approach with a callback procedure applied when respondents were not at home. The fieldwork was carried out by a selected group of trained professional interviewers. By way of encouraging participation and thanking the survey respondents for completing the questionnaire, three prize draws were used.
PoRTUGUESE JOURNAL OF MANAGEMENT STUDIES, VOL. X/, N. 0 1, 2006
TABLE 1
Factor analysis of supermarket choice criteria
Factor Loading Factor 1: Quality of produce and staff
Quality of trolleys .734
Quality of packaged goods .726
Quality of fresh goods .597
General atmosphere in store .595
Friendliness of staff .503
Factor 2: Additional services
Restaurants/cafes .687
Transport provided by store .571
Parent & baby facilities .537
Help with packing at checkouts .501
Factor 3: Parking and Petrol
Car parking facilities -.830
Petrol Station -.800
Factor 4: Ease/speed of use
Availability of express checkouts -.668
Availability of cash point facilities -.599
Convenient location -.594
Factor 5: Value for money
Frequency of special promotions -.718
Low prices -.608
Availability of loyalty discount scheme -.548
KMO = .861; Bartlett's test of sphericity= 3149, p < .0005
RESULTS
The generalized linear modelling technique of multi-nomial logistic regression (see Dobson 2000; Gill 2000; Lindsey 1997; McCullagh and Neider 1989) was used to model store choice using all of the factor scores derived above, a variable indicating the importance of own-brand and value-range products, and information about the consumers' behaviour and circumstances (for example, take home pay, car ownership, number of people in the household and satisfaction with the supermarket). Nine supermarkets and one category relating to "other shops" (mostly small local shops) were modelled. Using a manual sequential model-building procedure (based on the automated backward elimination model selection procedure discussed in Agresti and Finlay, 1997 and Hutcheson and Sofroniou, 1999) a subset of variables that could be used to predict supermarket choice was identified. The model shown in Equation 1 only includes those variables that contributed significantly to the prediction of supermarket choice.
PoRTUGUESE JOURNAL OF MANAGEMENT STUDIES, VOL. X/, N. 0 1, 2006
logit (p) = a
+
{J1 Take Home Pay+
{J2 Satisfaction+
{J3 F _Services+
{J4 F _Value for money+
{J5 Car ownership Equation 1where ...
Take Home Pay represents household weekly take home pay in pounds sterling,
Satisfaction is a rating on a seven-point ordered scale,
F _Services is a factor score representing the importance of additional services (see Table 1),
F _value for money is a factor score representing the importance of value for money (see Table
1),
And Car ownership is a binary classification indicating whether consumers usually make use a
car when shopping.
For this model, logit(p) refers to the log odds of a consumer choosing one supermarket compared to another; a choice that is influenced by the consumer's take home pay, car use, and how importantly they rate factors such as satisfaction, services and value for money. The overall goodness of fit statistics show that consumers' store choice can be more accurately determined using this model than a null model (logit(p) = a) as chi-square = 254.87, df = 45; P<0.0005. The logistic regression equivalents of the popular R-square statistic show it to be equal to 0.449 (Cox and Snell pseudo R-Square, see SPSS 1999) and 0.461 (Nagelkerke R-Square, Nagelkerke 1991). The goodness of fit statistics for each variable in the model are presented in Table 2.
TABLE 2
Likelihood Ratio Tests
Effect -2 Log Likelihood of Chi-Square df Sig.
Reduced Model*
Take-Home Pay 1392.720 59.417 9 .000
Satisfaction 1362.509 29.207 9 .001
F Services 1360.750 27.448 9 .001
F Value for money 1361.692 28.390 9 .001
Car Ownership 1395.015 61.713 9 .000
• The reduced model is formed by omitting an effect from the final model. The resultant change in -2 Log Likelihood is tested for significance against the chi-square distribution.
PoRTUGUESE JoURNAL OF MANAGEMENT STUDIES, VOL. X/, N. 0 1, 2006
and 27.448 respectively; p< .005 in all cases). The variables retained in the model (see Equation 1) indicate those that exert an influence across all of the supermarkets. Whilst this information is important, it does not allow a detailed investigation of supermarket patronage for individual stores. For example, car ownership is the most significant variable in supermarket choice and differentitates well between a number of markets, as can be seen in Figure 1.
FIGURE 1
Car use and supermarket choice
250~---·
200 Use car?
.no
150 Dyes
100
50
0
Lo-Cost Gateway Iceland Sainsburys Tesco
Safeway Solo ASDA Kwik Save Other shops
PORTUGUESE JOURNAL OF MANAGEMENT STUDIES, VOL·. X/, N. 0 1, 2006
unlikely to be differentiated on the basis of take home pay and Lo-Cost, Gateway, Solo, Iceland and Kwik Save form a relatively low-earning group also unlikely to be differentiated on the basis of take home pay. If one is to obtain a picture of individual stores it is important to assess the effect of each variable in relation to the particular supermarket one is interested in. Multi-nomial logistic regression is an ideal tool for this as it allows explicit comparisons to be made of individual supermarkets as well as estimating the effect of the variables across all markets. Tables 3 and 4 show the parameter estimates for individual supermarkets for the multi-nomial logistic regression model of supermarket attendance. The parameters given in the tables (labeled B and Exp(B)) provide an explicit comparison between a named supermarket and a reference category. The two tables show the same model in each case (the model described in Equation 1 and in Table 2), but with two different reference categories chosen for the purposes of illustration (Tesco and Kwik Save)!.
The regression output can be used to provide a descriptive account of the relationship between the supermarkets and the variables that are important in differentiating between their clientele. The comparative framework of the analysis is based on analytical dyads within the UK's supermarket spectrum. For example, when comparing two market leaders, Tesco and Sainsburys, it appears that the former has a higher perceived value for money rating (variable F VALUE). Someone who shops in Tesco, is likely to choose Tesco as opposed to Sainsburys, at least to some extent, on the basis of the perceived value for money offered by the stores (Wald= 14.867, p<.0005)2
• When the market leader (Tesco) is compared with a
small market-share player like Lo-Cost, it appears that consumers with higher incomes prefer to shop at Tesco (variable TH_PAY; Wald = 7.415, p=.006) as well as those who displayed higher satisfaction levels (variable SATISFAC; Wald=10.613, p=.001), and are concerned with the offer of additional supermarket services (e.g., cafeterias, baby changing rooms, etc.; variable F_SERVIC; Wald=11.545, p=.001). The results clearly indicate that certain discriminators are highly associated with particular stores. For example, car users with the highest orientation towards "value for money" tend to prefer/patronise Tesco. Again, by comparing the overall market leader (Tesco) with two of the low-price supermarket strategic group, one can detect that customers who shop at Tesco usually have higher household incomes and experienced higher levels of satisfaction with their stores than those who shop at Kwik Save and Lo-Cost.
The parameters obtained from the multi-nomial model are particularly informative as they can be used to provide in-depth descriptions of each
1 The complete tables have been reproduced here as they provide a wealth of information that is described in
detail in this paper.
2 The Wald statistic has been criticised as a measure for assessing the significance of variables (see, for
PORTUGUESE JOURNAL OF MANAGEMENT STUDIES, VOL. X/, N. 0 1, 2006
TABLE 3
Regression parameters for supermarkets (Reference category = Tesco)
Parameter Estimates
95% Confidence Interval for Ex ill_
SHOP B B Std. Error Wald df Sig. Exp(B) Lower Bound ~Bound
Lo-Cost Intercept 2.195 1.071 4.197 1 .040
TH_PAY -.009 .003 7.415 1 .006 .991 .984 .997
SATISFAC -.680 .209 10.613 1 .001 .507 .337 .763
F_SERVIC -1.510 .444 11.545 1 .001 .221 9.242E-02 .528
F_VALUE .241 .313 .594 1 .441 1.272 .690 2.348
CAR_ OWN -.703 .607 1.340 1 .247 .495 .151 1.628
Safeway Intercept -3.250 1.502 4.681 1 .031
TH_PAY .002 .001 3.346 1 .067 1.002 1.000 1.005
SATISFAC -.216 .215 1.010 1 .315 .806 .528 1.228
F_SERVIC -.489 .346 2.001 1 .157 .613 .311 1.207
F_VALUE .259 .289 .802 1 .371 1.295 .735 2.282
CAR OWN 1.169 1.073 1.188 1 .276 3.218 .393 26.338
Gateway Intercept 1.883 .897 4.408 1 .036
TH_PAY -.003 .002 1.861 1 .173 .997 .993 1.001
SATISFAC -.553 .177 9.712 1 .002 .575 .406 .815
F_SERVIC -.402 .294 1.871 1 .171 .669 .376 1.190
F_VALUE -.248 .307 .650 1 .420 .781 .427 1.426
CAR OWN -1.447 .582 6.185 1 .013 .235 7.518E-02 .736
Solo Intercept .544 1.010 .290 1 .590
TH_PAY -.009 .003 9.038 1 .003 .991 .986 .997
SATISFAC .046 .172 .073 1 .787 1.047 .748 1.466
F_SERVIC -.131 .223 .345 1 .557 .877 .567 1.358
F_VALUE .383 .233 2.702 1 .100 1.467 .929 2.316
CAR_ OWN -2.372 .596 15.814 1 .000 9.329E-02 2.898E-02 .300
Iceland Intercept -.653 1.387 .222 1 .638
TH_PAY -.004 .003 2.143 1 .143 .996 .991 1.001
SATISFAC -.015 .244 .004 1 .952 .985 .611 1.589
F_SERVIC -.164 .319 .264 1 .608 .849 .454 1.587
F_VALUE -.213 .364 .343 1 .558 .808 .396 1.649
CAR_ OWN -2.083 .724 8.284 1 .004 .125 3.015E-02 .515
ASDA Intercept -3.229 1.410 5.244 1 .022
TH_PAY .001 .001 .323 1 .570 1.001 .998 1.003
SATISFAC .063 .226 .077 1 .781 1.065 .684 1.657
F_SERVIC .546 .247 4.896 1 .027 1.727 1.064 2.801
F_VALUE -.149 .277 .290 1 .590 .861 .500 1.483
CAR_ OWN .489 .681 .516 1 .473 1.631 .429 6.198
Sainsburys Intercept -4.071 1.156 12.402 1 .000
TH_PAY -.001 .001 .289 1 .591 .999 .998 1.001
SATISFAC .192 .159 1.443 1 .230 1.211 .886 1.656
F_SERVIC .052 .182 .080 1 .777 1.053 .736 1.506
F_VALUE .650 .169 14.867 1 .000 1.915 1.377 2.665
CAR OWN 1.913 .763 6.282 1 .012 6.776 1.518 30.250
Kwik Save Intercept 1.616 .665 5.907 1 .015
TH_PAY -.006 .001 23.050 1 .000 .994 .992 .996
SATISFAC -.290 .116 6.301 1 .012 .748 .597 .938
F_SERVIC -.048 .155 .095 1 .758 .953 .703 1.292
F_VALUE .137 .158 .744 1 .388 1.146 .840 1.564
CAR_ OWN .477 .361 1.751 1 .186 1.612 .795 3.269
Other shops Intercept -1.215 1.098 1.225 1 .268
TH_PAY .000 .001 .022 1 .881 1.000 .997 1.003
SATISFAC -.288 .190 2.298 1 .130 .749 .516 1.088
F_SERVIC -.146 .260 .316 1 .574 .884 .519 1.438
F_VALUE .771 .244 10.018 1 .002 2.162 1.341 3.484
CAR OWN .032 .661 .002 1 .961 1.033 .283 3.773
log [p(ldentified Store)/p(Tesco)] = a + fJ1(Take Home Pay) + fJ2(Car ownership) + fJ3(satisfaction) + fJ.CF _services)
+ fJ5(F _value for money)
PoRTUGUESE JoURNAL OF MANAGEMENT STUDIES, VOL. X/, N. 0 1, 2006
TABLE 4
Regression parameters for supermarkets (Reference category = Kwik Save)
Parameter Estimates
95% Confidence Interval for Ex Bl SHOP C B Std. Error Wald df Sia. Exp(B) Lower Bound Upper Bound Lo-Cost Intercept .579 1.053 .302 1 .583
TH_PAY -.003 .003 .811 1 .368 .997 .990 1.004 SATISFAC -.390 .209 3.474 1 .062 .677 .450 1.020 F_SERVIC -1.462 .448 10.636 1 .001 .232 9.620E-02 .558 F_VALUE .104 .317 .109 1 .742 1.110 .597 2.064 CAR_ OWN -1.180 .625 3.569 1 .059 .307 9.032E-02 1.045 Safeway Intercept -4.866 1.554 9.803 1 .002
TH_PAY .008 .002 23.764 1 .000 1.008 1.005 1.012 SATISFAC .074 .226 .107 1 .744 1.077 .691 1.677 F_SERVIC -.441 .362 1.485 1 .223 .643 .316 1.308 F_VALUE .122 .309 .157 1 .692 1.130 .617 2.069 CAR_ OWN .691 1.101 .395 1 .530 1.997 .231 17.261 Gateway Intercept .268 .885 .091 1 .762
TH_PAY .003 .002 1.739 1 .187 1.003 .998 1.008 SATISFAC -.263 .179 2.151 1 .142 .769 .541 1.092 F_SERVIC -.355 .304 1.361 1 .243 .701 .387 1.273 F_VALUE -.384 .316 1.479 1 .224 .681 .366 1.265 CAR_ OWN -1.925 .617 9.731 1 .002 .146 4.355E-02 .469 Solo Intercept -1.072 1.015 1.115 1 .291
TH_PAY -.003 .003 .794 1 .373 .997 .991 1.003 SATISFAC .336 .177 3.601 1 .058 1.400 .989 1.982 F_SERVIC -.083 .236 .124 1 .724 .920 .580 1.460 F_VALUE .246 .245 1.015 1 .314 1.279 .792 2.066 CAR OWN -2.849 .631 20.420 1 .000 5.788E-02 1.682E-02 .199 Iceland Intercept -2.269 1.398 2.634 1 .105
TH_PAY .002 .003 .517 1 .472 1.002 .996 1.008 SATISFAC .276 .249 1.229 1 .268 1.317 .809 2.144 F_SERVIC -.116 .331 .123 1 .726 .890 .465 1.705 F_VALUE -.350 .374 .874 1 .350 .705 .338 1.468 CAR_ OWN -2.560 .760 11.341 1 .001 7.727E-02 1.741E-02 .343 ASDA Intercept -4.844 1.460 11.015 1 .001
TH_PAY .007 .002 15.016 1 .000 1.007 1.003 1.010 SATISFAC .353 .236 2.239 1 .135 1.423 .897 2.259 F_SERVIC .594 .268 4.898 1 .027 1.811 1.070 3.065 F_VALUE -.286 .296 .934 1 .334 .751 .421 1.342 CAR_ OWN .012 .725 .000 1 .987 1.012 .244 4.187 Sainsburys Intercept -5.687 1.216 21.875 1 .000
TH_PAY .006 .001 14.880 1 .000 1.006 1.003 1.008 SATISFAC .482 .173 7.781 1 .005 1.619 1.154 2.271 F_SERVIC .100 .207 .232 1 .630 1.105 .737 1.657 F_VALUE .513 .194 7.015 1 .008 1.671 1.143 2.443 CAR_ OWN 1.436 .796 3.252 1 .071 4.204 .883 20.018 Other shops Intercept -2.831 1.135 6.224 1 .013
TH_PAY .006 .002 12.153 1 .000 1.006 1.003 1.010 SATISFAC .002 .198 .000 1 .993 1.002 .680 1.477 F_SERVIC -.098 .272 .130 1 .718 .906 .532 1.545 F_VALUE .634 .258 6.043 1 .014 1.886 1.137 3.127 CAR_ OWN -.445 .695 .411 1 .522 .641 .164 2.500 Tesco Intercept -1.616 .665 5.907 1 .015
TH_PAY .006 .001 23.050 1 .000 1.006 1.004 1.009 SATISFAC .290 .116 6.301 1 .012 1.337 1.066 1.676 F_SERVIC .048 .155 .095 1 .758 1.049 .774 1.422 F_VALUE -.137 .158 .744 1 .388 .872 .640 1.190 CAR OWN -.477 .361 1.751 1 .186 .620 .306 1.258
log [p(ldentified Store)/p(Kwik Save)] = a + {3
1 (Take Home Pay) + {32(Car ownership) + {33(satisfaction) +
PORTUGUESE JOURNAL OF MANAGEMENT STUDIES, VOL. X/, N. 0 1, 2006
supermarket. For every one pound increase in take home pay, the odds of someone shopping at Kwik Save compared to Tesco decreases by about 0.6%. Although this might appear to be quite a small decrease, it is highly significant (Wald=23.050; p<0.0005) with large differences in weekly pay having a substantial effect on store choice. For example, each £100 increase in weekly pay decreases the odds of a customer choosing Kwik Save compared to Tesco by about 45% (see Hutcheson and Sofroniou, 1999, for a discussion of the use and interpretation of logit scores).
The information contained in the models can be displayed economically by showing only those variables that reach significance, providing an overall picture of supermarket competition3. Table 5 shows a comparison of all supermarkets and identifies those variables that distinguish between the stores' clientele. For example, the variables included in the model do not enable one to differentiate between those people who choose Safeway and those that choose Asda, Gateway, Iceland, Sainsburys, Tesco, or the smaller stores included in the "Other" category. Take home pay, level of satisfaction and the other variables do not appear to play a significant role when consumers choose between these stores and Safeway. Presumably, consumer choice is based on other factors such as habit, access, age of store, current promotions and random selection; information that was not collected.
TABLE 5
Supermarket differentiation
Asda
Gateway Gateway Iceland Car Iceland Kwik Pay
Car Car Kwik
Save Save
Lo Cost Other Pay Other
Lo Cost
Safeway Pay Pay Safeway
Sa ins- Car Pay Salis
burys Price Sa tis Car Sa tis Other Sainsbur
Price Price Car ys
Solo Pay Car Sa tis Car Other Sa tis Pay Car Car Pay Solo
Other Car
Tesco Salis Car Pay Satis Price Pay
Tesco Pay
other Price Price Pay Other Car Price
I
Pay Pay
Variables are entered into the table if their significance is below .01 and in order of importance (higher in the cell means more significant). For interpreting the direction of the effect, one needs to look at the model parameters.
3 It should be noted that this information can also be represented graphically with diagrams showing how each
individual store interacts with other stores through which variables. However, due to limited space, only an overall table will be presented here.
PoRTUGUESE JOURNAL OF MANAGEMENT STUDIES, VOL. X/, N. 0 1, 2006
Table 5 suggests that Lo-Cost is very different from Sainsburys, Tesco, Asda, Solo and the smaller stores (other) as there are multiple variables that distinguish between the stores' clientele. Its closest competitors would appear to be Gateway and Iceland. A closer look at Iceland reveals a different profile as it appears to attract a wide selection of customers who are only differentiated on the basis of car use. Asda, Kwik Save, Sainsburys and Tesco all attract car users, whereas Iceland does not.
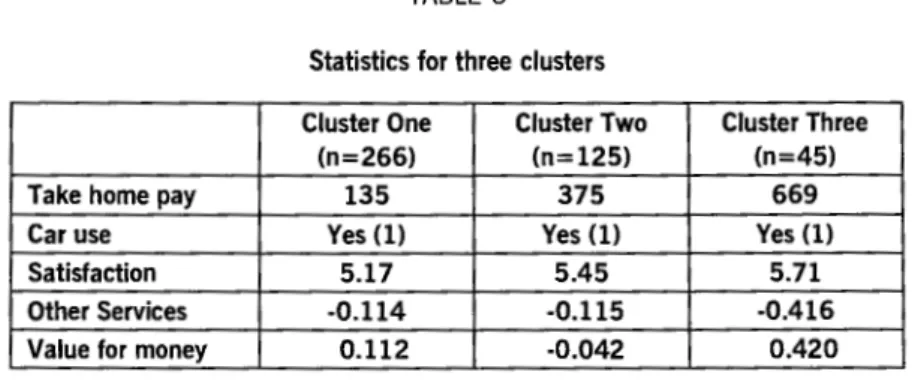
Whilst an overview of the supermarkets' customer base is useful, it is also useful to look at the patronage behaviour of groups of consumers. This can be achieved by segmenting the population into clusters and then making predictions about supermarket choice for these clusters. For this sample of consumers, three clusters were identified using a hierarchical cluster analysis (using between-groups linkage and the squared Euclidean distance) on the variables shown to be important in differentiating between the supermarkets. Table 6 shows the results of this analysis and provides the average levels of each variable.
TABLE 6
Statistics for three clusters
Cluster One Cluster Two Cluster Three
(n=266) (n=125) (n=45)
Take home pay 135 375 669
Car use Yes (1) Yes (1) Yes (1)
Satisfaction 5.17 5.45 5.71
Other Services -0.114 -0.115 -0.416
Value for money 0.112 -0.042 0.420
The three clusters shown in Table 6 display three different consumer profiles. Clusters 1 and 2 represent consumers who are quite similar on a number of variables apart from take-home pay (members of cluster 2 earn considerably more on average). Cluster 3 indicates a group of consumers who earn substantially more, are more concerned with satisfaction and less concerned with value for money and other services than the members of clusters 1 and 2. Using the multi-nomial logistic regression model shown in Equation 1, predictions for which supermarkets the members of each cluster prefer can be easily derived. For example, the probability of a member of cluster 1 shopping at Kwik Save as opposed to Tesco can be calculated by substituting the values for cluster 1 from Table 6 into the regression equation:
logit(Kwik Save/Tesco) = 1.616 + (-0.006 *Take home pay)
+ (0.477 * Car
ownership)+
(-0.290 *Satisfaction)+
(-0.048 * F _Services)PoRTUGUESE JOURNAL OF MANAGEMENT STUDIES, VOL. X/, N. 0 1, 2006
The log odds of someone from cluster 1 choosing Kwik Save as opposed to Tesco is:
log odds (Kwik Save/Tesco) = -0.196
which translates into an odds of 0.822 and a probability of 0.451. To put this into context, for every 1,000 people from this cluster who shop at Tesco, we can expect 822 to shop at Kwik Save. Similar statistics for all three clusters are shown in Table 7.
TABLE 7
Predicted attendance for three groups of consumers (Kwik Save vs Tesco)
Logit(p)
Cluster One -0.196
Cluster Two -1.737
Cluster Three -3.5
Logit(p)=log [p{Kwik Save)/p{Tesco)] Odds of p=P{Kwik Save)/p{Tesco) P= probability of attending the store
Odds of p Predicted attendance
Tesco Kwik Save
0.822 1000 822 0.176 1000 176 0.030 1000 30
From Table 7 it can be seen that the different clusters of consumers display very different shopping behaviour. Unsurprisingly, the characteristic of the consumer exerts an influence on the store they choose to frequent. For this sample, it appears that in comparison with members of clusters 2 and 3, cluster 1 members are much more likely to shop at Kwik Save4 • Similar statistics can easily be obtained for other store comparisons. For example, Table 8 compares Safeway and Tesco and shows that members of cluster 3 are more likely to choose Safeway than members of the other clusters. Detailed descriptions of the stores and their clientele can be built up in this way. One interesting finding can be observed by comparing tables 7 and 8. There is a large difference between members of clusters 1 and 2 when comparing Tesco and Kwik Save, but not when comparing Safeway and Kwik Save. The model provides detailed comparisons between individual supermarkets at the level of the individual groups, information that is invaluable for obtaining a detailed picture of local patronage behaviour and supermarket competition.
4 It should be noted that Tesco was selected by many more people than the other supermarkets in the survey.
This has resulted in relatively large numbers choosing Tesco from all clusters. What is of most importance, however, is the relative difference in preference between the clusters.
PORTUGUESE JoURNAL OF MANAGEMENT STUDIES, VOL. X/, N. 0 1, 2006
TABLE 8
Predicted attendance for three groups of consumers (Safeway vs Tesco)
Logit(p)
Cluster One ·2.789
Cluster Two ·2.313
Cluster Three -1.397
Logit(p} = log [p(Safeway}/p(Tesco)] Odds of p = p(Safeway}/p(Tesco}
Odds of p
0.062 0.099 0.247
CONCLUSION AND MANAGERIAL IMPLICATIONS
Predicted attendance
Tesco Safeway
1000 62
1000 99
1000 247
The model described in this paper has provided a number of results that have reinforced some previous research findings (see, for example, Magi and Julander, 1996 and Narayaman, 1998) and demonstrated the utility ofthe combined use of factor analysis, multi-nomial logistic regression and cluster analysis for modelling consumer behaviour and providing illustrative predictive models.
Taking into account the key independent variables retained in the basic logistic regression model, one can detect that in terms of general differentiation across all supermarkets, the main discriminators are take-home pay, car ownership, overall satisfaction, the existence of other services (i.e., cafeterias, transport provided by store, parent and baby facilities and help with packing at checkouts) and value for money (in this case measured by a retained factor which includes low prices, frequency of special promotions and the availability of loyalty discount schemes). This information derived from the findings is, no doubt, of major interest to managers but an important proviso will be its applicability and usefulness with respect to individual store locations, each one with its peculiarities and degree of competition. This fact calls for the need to be able to model consumer behaviour and store patronage for individual locations so that marketing managers can devise head-to-head positioning tactics based on analytical comparisons between individual stores. A critical antecedent for this process can already be gauged by the results of this study whereby a number of key discriminatory variables (e.g., household income and car ownership) were identified. These key segmentation variables clearly enable managers to partition the local market in terms of strategic groups of competitors. In our study this differentiation make-up is visibly demonstrated between the groupings of low-cost supermarkets (Gateway, Iceland and Solo) and the higher-quality of service supermarkets (Tesco, Sainsburys, Asda and Safeway). The only hybrid perception is connected to Kwik Save, since it is grouped with larger supermarkets when the local market is measured in terms of car ownership, but it is clearly grouped with the low-priced supermarkets on the basis of household income.
PoRTUGUESE JOURNAL OF MANAGEMENT STUDIES, VOL. X/, N. 0 1, 2006
The key managerial implications are that managers could have at their disposal local marketing research data which would enable them to undertake store-by-store comparisons on a (marketing controllable) variable-by-variable basis by taking as a reference category their own strategic group of competitors. Furthermore, and within the same strategic group of competitors pursuing similar market segments, the local supermarket can quantitatively position itself vis-a-vis the segment's market leader, or position itself attribute-by-attribute, as perceived by consumers, against the dominant store on each choice preference or dimension.
Furthermore, the multi-nomial logistic regression method provides in-depth descriptions of each supermarket as perceived by both current and potential customers. Gee-demographic characterisations and profiling can be much more precisely analysed. Therefore, managers can predict patronage for particular market segments by taking into consideration direct positioning strategies with regard to specific individual store competitors.
This modelling approach is also able to forecast traffic flows of customers vis-a-vis competing stores as a result of the manipulation of certain controllable marketing variables and management policies (i.e., pricing strategies and extended/ augmented supermarket services). With the advent of one-to-one marketing and the phenomenon of customer individualisation, the modelling of individual store choice behaviour is becoming more pressing and useful, by identifying critical variables/constructs that truly differentiate amongst local store competitors.
Managers should be encouraged to scan the local environment and have a systematic programme of data collection. They also need to be aware of the effect that local changes (i.e., new entrants, local demographics, new local legislation, etc.,) can have on their store patronage. Locally-based managers can also segment the market much more accurately in terms of gee-demographic profiling, behavioural and benefit segmentation, so that resources can be better allocated and tailored to key segments at a local level and strategic groups of competitors defined in order to lead to a more effective positioning. Furthermore, the retailing mix can also be better adjusted to the needs of different market segments (e.g., promotional messages and product range).
The multi-method approach offers a myriad of benefits to the researcher/ analyst which evolve around the following premises: i) the data collected can be accurately dissected and effective statistical manipulation can be carried out on it, ii) statistical model-building is performed with fewer assumptions violated and every facet of the conceptual model can be probed and analysed with regard to its role, attribution and research remit, and iii) the research platform can be clearly defined a priori in terms of its analytical objectives (e.g., explanatory, predictive and classificatory).
PORTUGUESE JOURNAL OF MANAGEMENT STUDIES, VOL. X/, N. 0 1, 2006
Managerial implications.
22
• Favouring the good use of local marketing research data to be used in decision-making
• Managers need to scan the local environment- programme of data collection • Aware of the effect of local changes - new entrants etc., can have on
patronage.
• Managers can segment the market more accurately geodemographic, behavioural and benefit segmentation- resources tailored to key segments at a local level and strategic groups defined in order to lead to more effective positioning.
PORTUGUESE JOURNAL OF MANAGEMENT STUDIES, VOL. X/, N. 0 1, 2006
References
Aaker, D. A. (1996). Building strong brands. Free Press. New York.
Agresti, A. (1996). An Introduction to Categorical Data Analysis. John Wiley & Sons Inc.
Agresti, A. and Finlay, B ( 1997). Statistical Methods for the Social Sciences (third edition). Prentice Hall
Allen by, G. M. and Leuk, P. J. (1994). Modeling household purchase behaviours with logistic normal
regression. Journal of the American Statistical Association, 89, 428: 1218-1231.
Anderson, E. W., Forwell, C. and Lehman, D. R. (1994). Customer satisfaction, market share and
profitability: Findings from Sweden. Journal of Marketing, 58, 3: 53-66.
Anderson, E. W. and Sullivan, M. W. (1993). The Antecedents and Consequences of Customer
Satisfaction, Marketing Science, 12 (Spring): 125-143.
Balabanis, G. and Vassileoiu, S. (1999). Some additional predictors of home shopping through the
internet. Journal of Marketing Management, 15: 361-385.
Bell, D. R., Ho, T, and Tang, C. S. (1998). Determining where to shop: Fixed and Variable costs of
shopping. Journal of Marketing Research, 35, 3 (August): 352-369.
Berthon, P., Pitt, L. and Watson, R. (1996). Re-surfing W3: Research perspective on marketing
communication and buyer behaviour on the world wide web. International Journal of
Adver-tising, 15: 258-301.
Bitner, M. J. (1990). Evaluating service encounters: the effect of physical surroundings and
em-ployee responses. Journal of Marketing, 54, 2: 69-82.
Chib, S., Greenberg, E. and Chen, Y. (1998). MCMC methods for fitting and comparing multinomial response models. Working paper, Washington University, St. Louis, Missouri.
Churchill, G. A. and Surprenant, C. (1982). An investigation into the determinants of customer
satisfaction. Journal of Marketing Research, 19 (November): 491-504.
Clarke, I. (2000). Retail power, competition and local consumer choice in the UK grocery sector.
European Journal of Marketing, 34, 8: 975-1002.
Corporate Watch (2003). What's wrong with supermarkets. www.corporatewatch.org.uk. Cronin, J. J. and Taylor, S. A. (1992). Measuring service quality: A re-examination and extension.
Journal of Marketing, 56, 3: 55-68.
Cronin, J. J. and Taylor, S. A. (1994). SEVPERF versus SERVQUAL: Reconciling performance based
and perception minus expectations measurement of service quality. Journal of Marketing, 58,
1: 55-68.
Dawar, N. and Parker, P. (1996). Marketing Universals: Consumers' use of brand name, price, physical appearance, and retailer reputation as signals of product quality. Journal of Market-ing, 58: 81-95
Dawson, John (2000). "Retailing at Century End; Some Challenges for Management and Research", The International Review of Retail, distribution and Consumer Research, 10, 2 (April): 119-148.
Dickson, J. and Maclachlan, D. L. (1990). Social distance and shopping behaviour. Journal of the
Academy of Marketing Science, 18, 2 (Spring): 153-161.
Dickson, P. R. and Sawyer, A. G. (1990). The Price Knowledge and Search of Supermarket
Shop-pers, Journal of Marketing, 54, 3 (July): 42-53.
Dobson, A. J. (2000). Introduction to Generalized Linear Models (second edition). Chapman and
Hall.
Dodds, W. B., Monroe, K. B. and Grewal, D. (1991). Effect of Price, Brand, and Store Information
on Buyers' Product Evaluations, Journal of Marketing Research, 28 (August): 307-319.
Fournier, S. and Yao, J. L. (1997). Reviving brand loyalty: A reconceptualization within the
frame-work of consumer-brand relationships. International Journal of Research in Marketing, 14:
451-472.
Gardner, M.P. and Siomkos, G. J. (1985). Toward a Methodology for Assessing Effects of In-store
Atmosphere, in Advances in Consumer Research, (ed.) Richard Lutz (Chicago, Illinois:
Asso-ciation for Consumer Research): 27-31.
PoRTUGUESE JOURNAL OF MANAGEMENT STUDIES, VOL. X/, N. 0 1, 2006
Gill, J. (2000). Generalized Linear Models: a unified approach. Quantitative Applications in the
Social Sciences Series, Sage Publications.
Hortman, S., McCurley, A. W., Allaway, J. B. and Rasp, J. (1990). Multi-segment analysis of
supermarket patronage. Journal of Business Research, 21, 3 (November): 209-223.
Hutcheson, G. D. and Moutinho, L. (1998). Measuring preferred store satisfaction using consumer
choice criteria as a mediating factor. Journal of Marketing Management, 14, 7: 705-720.
Hutcheson, G. D. and Sofroniou, N. (1999). The Multivariate Social Scientist: Introductory statis-tics using generalized linear models. Sage Publications.
Jin Byoungho and Jai-Ok Kim. (2003). "A Typology of Korean Discount Shoppers: Shopping Motives
Store Attributes, and Outcomes", International Journal of Service lndustryManagement, 14,
3-4: 396-419
Kaiser, H. F. (1970). A second-generation little jiffy. Psychometrika, 35: 401-415.
Kerin, R., Howard, D. J. and Jain, A. (1992). Store Shopping Experience and Consumer
Price-Quality-Value Perceptions, Journal of Retailing, 68, 4: 376-397.
Kincade, Doris h. and Leticia N. Moye. (2003). "Shopping Orientation Segments: Exploring Differ-ences in Store Patronage and attitudes Toward Retail Store Environments Among Female
Consumers", International Journal of Consumer Studies, 27, 1 (January)
Koelemeijer, K. and Oppewal, H. (1999). Assessing the effect of assortment and ambience: a choice
experimental approach. Journal of Retailing, 75, 3: 319-345.
Lindsey, J. K. (1997). Applying Generalized Linear Models. Springer-Verlag New York Inc.
Macintosh, G. and Lockshin, L. S. (1997). Retail relationships and store loyalty: a multi-level
perspective. International Journal of Research in Marketing, 14: 487-497.
Magi, A. and Julander, C-R. (1996). Perceived service quality and custoimer satisfaction in a store
performance framework. Journal of Retailing and Customer Services, 3, 1: 33-41.
McCullagh, P. and Neider, J. (1989). Generalized Linear Models (Second Edition). Chapman and Hall.
Messinger, P. R. and Narasimham, C. (1997). A model of retail formats based on consumers'
economising on shopping time. Marketing Science, 16, 1: 1-23.
Monroe, K. B. and Chapman, J. D. (1987). Framing effects on buyers' subjective product
evalua-tions. Advances in Consumer Research, 14: 193-197.
Monroe, K. B. and Krishnan, R. (1985). The effect of price on subjective product evaluation. In
Perceived Quality: How consumers see stores and merchandise. Jacoby and Olson (eds.), Lexington Books: 209-232.
Moore, Geoff and Andy Robson. (2002). "The UK Supermarket Industry: An Analysis of Corporate, Social and Financial Performance", Business Ethics; A European Review, 11, 1 (January): 25-39.
Moutinho, L.A. and Hutcheson, G. D. (2000). Modelling store patronage using comparative
struc-tural equation models. Journal of Targeting, Measurement and Analysis for Marketing, 8, 3:
259-275.
Moye, Leticia N. and Doris H. Kincade (2002). "Influence of Usage Situations and Consumer Shop-ping Orientations on the importance of the Retail Store Environment". The International Re-view of Retail, Distributing and Consumer Research, 12, 1 (January 1): 59-79.
Murthi, B. P. S. and Srinivasan, K. (1998). Performance of the integrated random coefficients
covariance probit model: implications for brand choice. International Journal of Research in
Marketing, 15: 137-156.
Nagelkerke, N.J. D. (1991). A note on general definition ofthe coefficient of determination. Biometrika, 78: 691-692.
Narayaman, S. (1998). Understanding a Retailer's Role to Provide Solutions. Retail World, 51, 17: 6-7. Oliver, R. L. (1980). A cognitive model of the antecedents and consequences of satisfaction
deci-sions. Journal of Marketing Research, 17 (November): 460-469.
Parasuraman, A., Zeithaml, V. A. and Berry, L. L. (1994). Reassessment of expectations as a
comparison standard in measuring standard quality: Implications for further research. Journal
PoRTUGUESE JouRNAL OF MANAGEMENT STUDIES, voL. XI, N. 0 1, 2006
Rao, A. R. and Monroe, K. B. (1989). The effect of price, brand name and store name on buyers'
perceptions of product quality: an integrative review. Journal of Marketing Research, 26:
351-357.
Reichheld, F. F. and Sasser, W. E. (1990). Zero defections: Quality comes to services. Harvard Business Review, 68, 5: 105-111.
Rhee, Hongjai and David R. Bell. (2002). "The Inter-Store Mobility of Supermarket Shoppers",
Journal of Retailing, 78: 225-237.
Rowley, J. (2000). Product search in e-shopping. A review for research propositions. Journal of Consumer Marketing, 17, 1: 20-35.
Rust, R. T. and Zahorik, A. J. (1993). Customer satisfaction, customer retention and market share.
Journal of Retailing, 69, 2: 193-215.
Sellers, P. (1990). What consumers really want. Fortune, 121, 13: 58-68.
Severin, Valerie, Jordan J. Louviere and Adam Finn. (2000). "The Stability of Retail Shopping Choices Over Time and Across Countries", Journal of Retia/ing, 77, 2: 185-202.
Shocker, A. D., Srivastava, R. K. and Ruekert, R. W. (1994). Challenges and opportunities facing
brand management: an introduction to the special issue. Journal of Marketing Research, 31:
149-158.
Solgaard, Hans S. and Robet Hansen. (2003). "A Hierarchical Bayes Model of Choice Between
Supermarket Formats", Journal of Retailing and Consumer Services, 10, 3 (May): 169-180.
Simester, D. 1., Hauser, J. R., Wernerfelt, B. and Rust, R. T. (2000). Implementing quality improve-ment programs designed to enhance customer satisfaction: Quasi-experiimprove-ments in the United
States and Spain. Journal of Marketing Research, 37: 102-112.
Spies, K., Hesse, F. and Loesch, K. (1997). Store atmosphere, mood and purchasing behaviour.
International Journal of Research in Marketing, 14, 1: 1-17. SPSS, Inc (1999). SPSS Regression Models 9.0. SPSS Inc.
Strachan, J. (1997). Multiples target the home front. Marketing Week, 19: 34.
Teas, K. R. (1993). Expectations, performance evaluation and consumers' perceptions of quality.
Journal of Marketing, 57, 4: 18-34.
Teas, K. R. and Agarwal, S. (2000). The effect of extrinsic product cues on consumers' perceptions
of quality, sacrifice and value. Journal of the Academy of Marketing Science. 28, 2:
278-290.
TGI (Target Group Index), (1998). BMRB International.
Vermeir, Iris and Patrick Van Kenhove (2004). "The Influence of Need for Closure and Perceived Time Pressure on Search Effort for Price and Promotional Information in a Grocery Shopping Context", Psychology and Marketing, 22, 1: 71-95
Yi, Y. (1990). A critical review of consumer satisfaction. In Review in Marketing (1990), Zeithaml (ed.). American Marketing Association, Chicago: 68-123.
Zeithaml, V. (1988). Consumer Perceptions of Price, Quality and Value; A Means-End Model and Synthesis of Evidence, Journal of Marketing, 52 (July): 2-22