49 Australasian Journal of Market & Social Research | Volume 17, Number 2, December 2009
Introduction
The penetration rate of mobile phones has increased to such an extent in recent years that it has already exceeded fixed phone penetration in some regions. In the European Union, 81% of households have at least one mobile phone compared with 71% with a fixed telephone; the per-centage of mobile-only households is also becoming more marked, reaching 24% in 2007 (EC 2008). In the US, more than 50% of households possess a mobile phone while a fixed phone is found in over 89% of the households (Brick et al 2006); the percentage of mobile only households was 13% in 2006 (Keeter et al. 2007). With the decline in households and per-sons with a fixed phone, the coverage in traditional fixed telephone surveys also decreases which implies that estimates from these surveys have more potential coverage bias. Moreover, it may become more difficult to reach the households with a fixed phone as well as mobile phones and who rely on the latter for most of their calls. Thus, sampling mobile
phones may be necessary to gain access to the growing proportion of households that use mobile phones either exclusively or extensively.
A nationwide survey was designed to evaluate issues associated with conduct-ing surveys on mobile phones. The study sampled telephone numbers from frames of both mobile phone numbers and fixed numbers. This article focuses on the operational feasibility of surveying mobile phone numbers. Specifically, the follow-ing issues are covered: (a) response rates from both samples – mobile and fixed, (b) survey procedures – time of contacts, level of effort, completion time of inter-views - from both samples, and (c) mobile and fixed phone penetration within spe-cific sub-groups of respondents. The next section gives an overview of the design of the study. The outcomes of the mobile phone sample are then presented and compared with those on the fixed phone sample. The last section summarizes the key findings.
Telephone Surveys Using Mobile
Phones: An Analysis of Response
Rates, Survey Procedures and
Respondents’ Characteristics
Paula Vicente and Elizabeth Reis
Department of Quantitative Methods,
ISCTE-Lisbon University Institute, Portugal
Corresponding author: Paula VicentePostal address: Edifício ISCTE, Av. Forças Armadas, 1649-026 Lisbon, Portugal Telephone: +351 21 790 32 02
Fax: +351 21 790 32 38 e-mail: [email protected]
Abstract
Telephone surveying has become the major mode of data collection in the sample survey field since the mid 1980s; presently other modes of advanced telecommunication such as mobile phones are fast becoming important supplements and even competitors to the fixed telephones. This paper uses a nationwide dual frame survey of fixed and mobile phone numbers to examine the potential of mobile phones for survey work, the methodological implications of their use and the differences to fixed phones surveys.
50 Australasian Journal of Market & Social Research | Volume 17, Number 2, December 2009 The Mobile Sample was comprised of
randomly generated phone numbers. Mobile phones numbers are nine-digit and the first two digits identify the opera-tor. The Portuguese Telecommunications Regulation Authority provides informa-tion about the market share of each of the three operators providing mobile phone service in Portugal which was used to divide the mobile sample into three subsamples. Within each two-digit prefix, mobile phone numbers were cre-ated by a generator of 7-digit random numbers. The selection method was ultimately very similar to a simple ran-dom sample from a set of numbers, not all of which have necessarily been attrib-uted. In the mobile sample, interviews were conducted with the person who answered the phone. Interviewers con-firmed that the person was aged 15 or older and in a safe place to talk before administering the questionnaire. Where this was not the case, an appointment was made with the respondent at a more convenient time.
The Fixed Sample was selected from Portugal Telecom Directory (the so called White Pages) which contains attributed residential numbers. An interval, K, was formed by dividing the population count of telephone numbers in the frame, N, by the desired sample size, n. The frame of telephone num-bers was divided into n intervals of size K telephone numbers. One telephone number was drawn at random from each interval. Interviews were conduct-ed with the last birthday adult at home at the time of the call, or in the absence of this adult, with any other adult avail-able at the time of contact.
naire was used for the mobile and fixed phone sample and included questions about Internet usage, attitudes towards the Internet and demographics.
The same general scheduling protocols were used for both the mobile and the fixed phone sample. Up to 7 call attempts were made to each number to establish contact, except when the number was immediately identified as non-attributed or non-working (a mes-sage from the phone service operator provides this information). For the initial contact, the scheduling algorithm sched-uled calls over different times of the day during weekdays.
Response rates
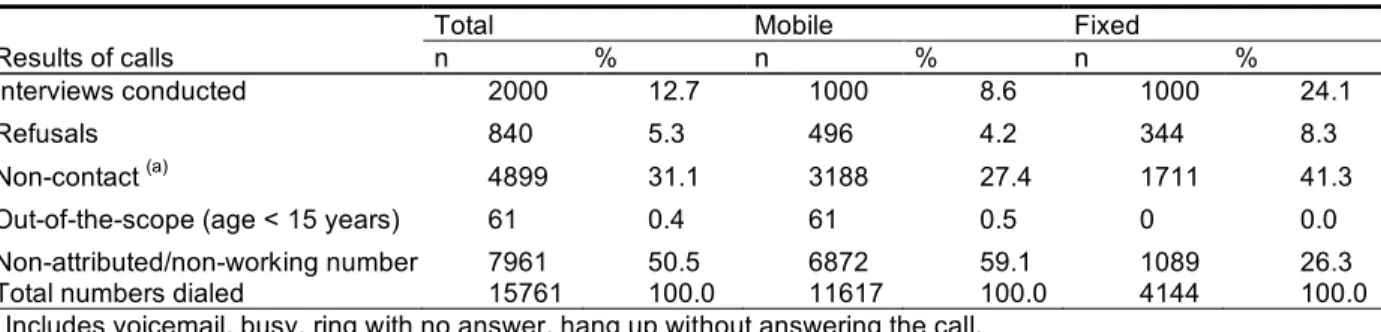
In this section we present the outcomes of contact results by sample type (Table 1). In order to conduct 2000 interviews of individuals aged 15 and older, 11617 numbers were required in the mobile phone sample and 4144 in the fixed phone sample. Nearly 60% of the mobile numbers dialed were non-attributed. In the fixed sample 26.3% of the numbers were found to be not-working or discon-nected. In the mobile sample 61 contacts were rejected and coded as out-of-the-scope because the person answering the phone was under 15 years old.
The completion rate was 8.6% for the mobile phone sample and 24.1% for the fixed phone sample. Based on useful numbers, i.e. by excluding the non-attributed, non-connected and out-of-the-scope numbers, the completion rate was 21.1% for the mobile phone sample as opposed to 32.7% for the fixed phone sample.
51 Australasian Journal of Market & Social Research | Volume 17, Number 2, December 2009
There were 496 refusals in the mobile phone sample, corresponding to 4.2% of the cases; the percentage for the fixed phone sample was 8.3%. On the basis of useful numbers, the refusal rate was 10.5% for the mobile phone sample and 11.3% for the fixed phone sample thus indicating that there is a similar tendency for refusal in the mobile and the fixed phone sample. The fact that the interviewers began the mobile phone interviews by asking respondents if it was a convenient time and place for the interview and only proceeded if this was confirmed by the respondent might have contributed to a reduction in refusals and thus to bring-ing mobile phone results closer to fixed phone results.
Regarding non-contacts the rate was 27.4% in the mobile sample whereas in the fixed sample was 47%. However, when restricting the analysis to use-ful numbers the scenario changes: the non-contact rate in the mobile sample is higher (68.1% against 56%).
Results of survey procedures
This section examines the efficiency of contacting and getting people’s coop-eration by time period, level of effort, in terms of number of call attempts and number of calls necessary per complete interview, and completion time of inter-views, by sample type.Interview rate by time period
The outcomes of the time periods of the interviews are good indicators of when peo-ple answer their phones and are available to cooperate with surveys. To make the analy-sis pertinent to this goal, phone numbers found to be non-attributed, non-working, or out of the scope are excluded. Using this definition, 4729 mobile numbers and 3055 fixed phone numbers were used
As interviewing was not conducted on weekends, the outcomes only concern weekdays. All last call attempts were classified in four time periods. Table 2 presents the interview rate by the four grouped time periods for the fixed phone and the mobile phone samples.
Table 1. Detailed results of the calls by sample type
Total Mobile Fixed
Results of calls n % n % n %
Interviews conducted 2000 12.7 1000 8.6 1000 24.1
Refusals 840 5.3 496 4.2 344 8.3
Non-contact (a) 4899 31.1 3188 27.4 1711 41.3
Out-of-the-scope (age < 15 years) 61 0.4 61 0.5 0 0.0 Non-attributed/non-working number
Total numbers dialed
7961 15761 50.5 100.0 6872 11617 59.1 100.0 1089 4144 26.3 100.0 (a)
Includes voicemail, busy, ring with no answer, hang up without answering the call.
Table 2. Interview rate, by sample type and time period
Time period Mobile Fixed 10 a.m. – 3 p.m. 19.8% (465) – (0) 3 p.m. – 6 p.m. 11.9% (1386) 12.6% (484) 6 p.m. – 8 p.m. 27.6% (1547) 40.7% (995) 8 p.m. – 10.30 p.m. 23.4% (1331) 33.9% (1576)
Note: Numbers in ( ) are the number of cases in the time period. Only numbers identified as attributed and working are included. No fixed phone call attempts were made during the earlier period.
Table 3. Percentage of interviews by number of call attempt and sample type
Number of calls Mobile Fixed
1 call 63.0% 66.4%
2 calls 21.6% 18.6%
3 calls 9.0% 8.7%
4 calls 3.9% 2.4%
5 or more calls 2.5% 3.9%
Table 4. Mean completion time (minutes) by time period and sample type
Time period Mobile Fixed 10 a.m. – 3 p.m. 11.58 -- 3 p.m. – 6 p.m. 12.31 11.08 6 p.m. – 8 p.m. 11.93 11.06 8 p.m. – 10.30 p.m. 11.56 10.61
Overall 11.99 10.91
Note: Numbers in ( ) are the number of cases in the time period. Only numbers identified as attributed and working are included. No fixed phone call attempts were made during the earlier period.
52 Australasian Journal of Market & Social Research | Volume 17, Number 2, December 2009 A chi-square test shows that the
inter-view rate across the four time periods for the mobile phone sample is statistically different (κ2=51.952, dƒ=3, p<0.001)
(ranging from 11.9% to 27.6%) between time periods. The fixed phone sample exhibits the most typical pattern identi-fied in previous telephone surveys, with lower interview rates during the earlier hours than in the evening periods; differ-ences across time periods (ranging from 12.6% to 40.7%) were statistically signifi-cant κ2=115.800, dƒ=2, p<0.001).
Despite the significant differences found across time periods for the mobile sam-ple the interview rate did not vary as much as in the fixed sample. A possible explanation is that the mobile phone is a personal device that is carried at all times and people can answer them anywhere and anytime thus increasing the likeli-hood of getting a successful contact; the fixed phone, on the other hand, can only be answered when someone is at home which is more likely later in the day. Level of effort
This section examines the level of effort required to complete the interviews. Specifically, we look at the total number of call attempts and the number of calls necessary per complete interview. In the mobile phone sample, a total of 20602 call attempts were made to obtain 1000 interviews as opposed to 8112 call attempts in the fixed phone sample. This means that while an aver-age of 20.6 calls had to be made to obtain one complete interview in the mobile phone sample, only 8.1 calls
were required in the fixed phone sample. If we exclude the non-attributed/non-working and out-of-the-scope numbers in both samples the average number of calls per complete interview is 13.7 in the mobile sample and 7.0 in the fixed phone sample. In each case the mobile phone sample required a greater level of effort to obtain the same number of completed interviews.
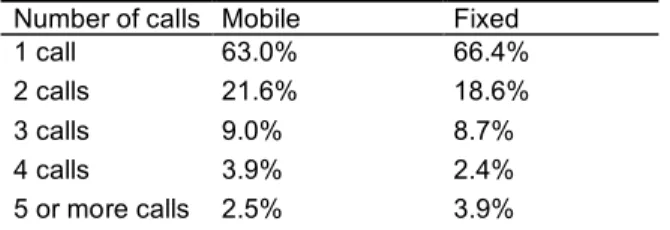
Table 3 presents the percentage of inter-views accomplished by number of call attempt. Between 1 and 7 calls were necessary to the telephone numbers that led to the successful completion of an interview. A chi-square test shows that the distribution of the percentage of interviews by number of call attempt was different across sample type κ2=13.743,
dƒ=4, p<0.008). Although in both sam-ples the interview became less likely as the number of call attempts increased, the percentage of interviews that could be completed with one single call attempt was higher in the fixed sample than in the mobile sample.
Completion time of interviews Short questionnaires are typically rec-ommended when the mode of data col-lection is the telephone as maintaining long conversations requires a mode in which the respondent cannot hang up so easily. The questionnaire of our study was intentionally designed to be short following advice from the researchers of the survey company cooperating in the project; more specifically they warned us of the risk of high dropout rates, especially for the mobile sample, if the questionnaire took much more than 15
1
Total numbers dialed 15761 100.0 11617 100.0 4144 100.0
(a)
Includes voicemail, busy, ring with no answer, hang up without answering the call.
Table 2. Interview rate, by sample type and time period
Time period Mobile Fixed 10 a.m. – 3 p.m. 19.8% (465) – (0) 3 p.m. – 6 p.m. 11.9% (1386) 12.6% (484) 6 p.m. – 8 p.m. 27.6% (1547) 40.7% (995) 8 p.m. – 10.30 p.m. 23.4% (1331) 33.9% (1576)
Note: Numbers in ( ) are the number of cases in the time period. Only numbers identified as attributed and working are included. No fixed phone call attempts were made during the earlier period.
Table 3. Percentage of interviews by number of call attempt and sample type
Number of calls Mobile Fixed
1 call 63.0% 66.4%
2 calls 21.6% 18.6%
3 calls 9.0% 8.7%
4 calls 3.9% 2.4%
5 or more calls 2.5% 3.9%
Table 4. Mean completion time (minutes) by time period and sample type
Time period Mobile Fixed 10 a.m. – 3 p.m. 11.58 -- 3 p.m. – 6 p.m. 12.31 11.08 6 p.m. – 8 p.m. 11.93 11.06 8 p.m. – 10.30 p.m. 11.56 10.61
53 Australasian Journal of Market & Social Research | Volume 17, Number 2, December 2009
minutes to be administered. In this sec-tion we present the outcomes for com-pletion times in the overall samples and across the four grouped time periods in which the interviews were accom-plished (Table 4).
Mobile phone respondents took on aver-age 11.99 minutes to complete the inter-views while the fixed phone respondents took 10.91 minutes, i.e. mobile phone interviews took about 1 minute longer on average to complete than fixed phone. The comparison of the overall mean completion times between samples was statistically different (t=–4.840, dƒ=1998, p<0.001). The mean completion time of the interviews was higher in the mobile sample for every time period and the major difference was found in the period 3 p.m. – 6 p.m.
On the whole, the lower mean times of completion were all obtained in the fixed phone sample namely in evening peri-ods – 6 p.m.-8 p.m. and 8 p.m.-10.30 p.m. While these time periods favor find-ing people at home, they are also critical for household activities (e.g. cooking dinner, dining, putting children to bed). Calling respondents on the fixed phone in a time period when they are engaged in other tasks is likely to cause rushed responses which might have an impact in the overall mean completion time of fixed phone interviews.
Respondents’ characteristics
Despite the massive dissemination of mobile phones, it is not thought to be uniform, i.e., mobile phone own-ership and usage varies considerablybetween population groups. In this sec-tion we analyze the impact of using mobile phones on sample composition by looking at the proportion of interviews obtained via mobile phone and via fixed phone among specific sub-groups of the sample. Comparative profiles of sample type characteristics are shown within the sub-groups of gender, age, educational level, working status, household size and family life-cycle (Table 5).
Mobile and fixed samples were found to be statistically different at p<0.001 in all demographic characteristics except for gender. Regarding age, it is noted that approximately 70% of the interviews of respondents aged between 25 and 34 years were conducted over the mobile phone while only 27% of the respon-dents older than 55 were interviewed over the mobile phone.
Working status also has a signifi-cant effect on sample type composi-tion. Nearly 60% of either employed or unemployed people were interviewed by mobile phone but only 21% of the interviews with the retired segment were conducted by mobile phone.
Respondents’ life cycle also has an influence on this. Among the respon-dents living alone, 66.3% were inter-viewed by mobile phone while the pro-portion of mobile phone interviews with married people without children did not reach 40%.
1
Table 1. Detailed results of the calls by sample type
Total Mobile Fixed
Results of calls n % n % n %
Interviews conducted 2000 12.7 1000 8.6 1000 24.1
Refusals 840 5.3 496 4.2 344 8.3
Non-contact (a) 4899 31.1 3188 27.4 1711 41.3
Out-of-the-scope (age < 15 years) 61 0.4 61 0.5 0 0.0 Non-attributed/non-working number
Total numbers dialed
7961 15761 50.5 100.0 6872 11617 59.1 100.0 1089 4144 26.3 100.0 (a)
Includes voicemail, busy, ring with no answer, hang up without answering the call.
Table 2. Interview rate, by sample type and time period
Time period Mobile Fixed 10 a.m. – 3 p.m. 19.8% (465) – (0) 3 p.m. – 6 p.m. 11.9% (1386) 12.6% (484) 6 p.m. – 8 p.m. 27.6% (1547) 40.7% (995) 8 p.m. – 10.30 p.m. 23.4% (1331) 33.9% (1576)
Note: Numbers in ( ) are the number of cases in the time period. Only numbers identified as attributed and working are included. No fixed phone call attempts were made during the earlier period.
Table 3. Percentage of interviews by number of call attempt and sample type
Number of calls Mobile Fixed
1 call 63.0% 66.4%
2 calls 21.6% 18.6%
3 calls 9.0% 8.7%
4 calls 3.9% 2.4%
5 or more calls 2.5% 3.9%
Table 4. Mean completion time (minutes) by time period and sample type
Time period Mobile Fixed 10 a.m. – 3 p.m. 11.58 -- 3 p.m. – 6 p.m. 12.31 11.08 6 p.m. – 8 p.m. 11.93 11.06 8 p.m. – 10.30 p.m. 11.56 10.61 Overall 11.99 10.91
1
Table 1. Detailed results of the calls by sample type
Total Mobile Fixed
Results of calls n % n % n %
Interviews conducted 2000 12.7 1000 8.6 1000 24.1
Refusals 840 5.3 496 4.2 344 8.3
Non-contact (a) 4899 31.1 3188 27.4 1711 41.3
Out-of-the-scope (age < 15 years) 61 0.4 61 0.5 0 0.0 Non-attributed/non-working number
Total numbers dialed
7961 15761 50.5 100.0 6872 11617 59.1 100.0 1089 4144 26.3 100.0 (a)
Includes voicemail, busy, ring with no answer, hang up without answering the call.
Table 2. Interview rate, by sample type and time period
Time period Mobile Fixed 10 a.m. – 3 p.m. 19.8% (465) – (0) 3 p.m. – 6 p.m. 11.9% (1386) 12.6% (484) 6 p.m. – 8 p.m. 27.6% (1547) 40.7% (995) 8 p.m. – 10.30 p.m. 23.4% (1331) 33.9% (1576)
Note: Numbers in ( ) are the number of cases in the time period. Only numbers identified as attributed and working are included. No fixed phone call attempts were made during the earlier period.
Table 3. Percentage of interviews by number of call attempt and sample type
Number of calls Mobile Fixed
1 call 63.0% 66.4%
2 calls 21.6% 18.6%
3 calls 9.0% 8.7%
4 calls 3.9% 2.4%
5 or more calls 2.5% 3.9%
Table 4. Mean completion time (minutes) by time period and sample type
Time period Mobile Fixed 10 a.m. – 3 p.m. 11.58 -- 3 p.m. – 6 p.m. 12.31 11.08 6 p.m. – 8 p.m. 11.93 11.06 8 p.m. – 10.30 p.m. 11.56 10.61
54 Australasian Journal of Market & Social Research | Volume 17, Number 2, December 2009 Regarding household size, mobile phone
interviews are less likely in the case of smaller households – 1 or 2 persons – and more likely in bigger households. As for educational level, 57.3% of the university respondents were interviewed on the mobile phone while among the basic level respondents mobile phone interviews were 46%.
In short, the outcomes illustrate that the proportion of completed interviews over the mobile phone varies according demo-graphic characteristics, especially on age, working status and family life cycle of the respondent; gender does not differentiates mobile and fixed sample respondents.
While the average deviation between fixed and mobile sample (computed within all the sub-groups of each variable) is less than 5 percentage points for gender (4.3 percentage points) it goes to over 20 per-centage points for age (25.3 perper-centage points), working status (23.2 percentage points) and family life-cycle (20.9 percent-age points).
These results replicate to some extent the findings for mobile phone popula-tions in other countries. In most European countries, mobile phone owners tend to be younger, are more often employed, single and are more likely to belong to households with three or more persons than those who do not have a mobile
2
25-34 35-44 45-54 69.0 60.2 53.0 31.0 39.8 47.0 55+ 27.0 73.0 Educational levelBasic level (9 years compulsory) 46.0 54.0
χ2=17.362*** (df=2) Secondary/professional (3 years after compulsory)
Superior/University 53.9 57.3 46.1 42.7 Working status Employed Unemployed Student Retired Other 60.9 59.8 52.0 21.0 43.6 39.1 40.2 48.0 79.0 56.4 χ2=215.300*** (df=4) Household size 1 person 2 persons 3 persons 4 or more persons 43.9 41.0 57.8 52.9 56.1 59.0 42.2 47.1 χ2=35.909*** (df=3) Family life-cycle
Single living with the parents 51.1 48.9
χ2=84.357*** (df=5)
Single living alone 66.3 33.7
Married having no children 39.6 60.4
Married having children Single-parent family
62.7 63.3
37.3 36.7
Other type of family 41.1 58.9
55 Australasian Journal of Market & Social Research | Volume 17, Number 2, December 2009
phone (EC 2007). In the United States, mobile phone owners are more likely to be employed persons and single or never married; they are also less likely to be aged 65 years or older and retired (Link et al 2007).
Conclusion
Our findings support the idea that the use of mobile rather than fixed phones to col-lect data causes important differences to appear in response rates, survey proce-dures and sample composition.
Sample selection for mobile and fixed telephones was very different. In the mobile phone sample, 59.2% of the dialed numbers were of no use since they were non-attributed or out-of-the-scope numbers, while the figure for non-useful numbers for the fixed sample was only 26.3%. Although this is due to the non-existence of a sampling frame for mobile phone number selection, the time spent to screen those numbers and discover they were of no interest was in fact higher in the mobile sample than in the fixed sample. The refusal rate was around 10% in both samples but the completion rate was lower in the mobile than the fixed sample. The non-contact rate was higher in the mobile phone sample – 67.4%, after excluding non-useful numbers – against 56.0% in the fixed phone sample. Even though people always carry mobile phones everywhere, this does not mean the person can be more easily contacted than via the fixed phone. In fact, the larg-est proportion of the contacts coded as “non-contact” in the mobile sample – 55.9% – was coded as “voicemail”, which means that a considerable share of mobile phone owners do not always keep their mobile phones switched on.
The mobile sample contacts were more evenly distributed across the day; while more than half the contacts (51.6%) in the fixed phone sample were concentrated in one single period (8 p.m. till 10.30 p.m.) the largest share of contacts in the mobile phone sample did not exceed one third
of the overall number of contacts, rang-ing from 10% to 32% across the time periods. This outcome is likely to reflect the fact that the survey company knows people always carry their mobile phones everywhere which enables them to pro-long the schedule for interviewing. The biggest share of interviews was accomplished on the first contact attempt both in the mobile and in the fixed sam-ple; however, overall the mobile sample required more contact attempts per com-pleted interview than the fixed phone sample. Fixed phone contacts were therefore more efficient.
The samples were different in terms of interview length; interviews with the mobile phone respondents took almost 10% lon-ger to complete; however, some caution is needed before concluding that mobile interviews systematically last longer than fixed phone interviews. The completion time issue must be linked with the pric-ing strategies in each country for mobile phone services. Whereas receiving a call on a mobile phone is free of charge in Portugal, as in most European countries as well as Australia and New Zealand, the subscriber of the mobile phone in countries such as US, Canada, Hong Kong, Singapore or China has to pay for received calls (OECD 2000); when the call originates an expense for the recipient, there is likely to be a tendency to rush responses and thus make mobile inter-views shorter than those by fixed phone. As this question is closely linked to the specific conditions of mobile phone ser-vice in each country, it certainly warrants further investigation.
Significant differences were found in respondents’ characteristics between the samples. Although the demographic dif-ferences between mobile and fixed phone respondents are expected to become less prevalent as mobile phones dissemination increases and extends to other spe-cific subgroups, at present mobile phones ownership is more marked among
young-56 Australasian Journal of Market & Social Research | Volume 17, Number 2, December 2009 is likely to increase in the near future, both
in the context of mixed-mode designs and in single mode designs. The cover-age rate of fixed phone frames is likely to decrease even more as mobile phones continue to proliferate and this will surely be the main reason for bringing mobile phones to survey research. The challenge for survey methodologists will be to adapt old methods to this new survey mode, a domain that in the times ahead will be rich in investigation.
Acknowledgement
This work has been supported by Marktest, Lda and by GIESTA/ISCTE - Survey Methodology and Statistics Research Centre of the ISCTE-Lisbon University Institute.
66.3, European Commission: Brussels. European Commission 2008, Eurobarometer 293, European Commission: Brussels. Keeter, S., Kennedy, C., Clark, A., Tompson, T. & Mokrzycki, M 2007, ‘What’s Missing from National Landline RDD Surveys? The Impact of the Growing Cell-Only Population’, Public Opinion Quarterly, vol.71, pp. 772-792.
Link, M., Battaglia, M., Frankel, M., Osborn, L. & Mokdad, A 2007, ‘Reaching the US Cell Phone Generation’, Public Opinion Quarterly, vol.71, no. 5, pp. 814-839.
Organisation for Economic Co-operation and Development (OECD) 2000, Cellular Mobile Pricing Structures and Trends, 19 May, <http://www.oecd.org/ dataoecd/54/42/2538118.pdf.>