Crop Breeding and Applied Biotechnology S2: 87-98, 2012 Brazilian Society of Plant Breeding. Printed in Brazil
Genetic improvement of sugar cane for bioenergy: the Brazilian
experience in network research with RIDESA
Márcio Henrique Pereira Barbosa1*, Marcos Deon Vilela Resende2, Luiz Antônio dos Santos Dias1, Geraldo Veríssimo de Souza Barbosa3, Ricardo Augusto de Oliveira4, Luiz Alexandre Peternelli5 and Edelclaiton Daros4
Received 15 September 2012 Accepted 03 October 2012
Abstract – In this paper, it is presented RIDESA’s model for sugar cane breeding to ethanol, and its scientific, technological and hu -man resources training contributions. RIDESA is an inter-university network for the development of sugar cane industry in Brazil, and was formed by a technical cooperation agreement between ten public universities. The model of network management is presented in this study, which involves, among other things, the public-private partnership (Universities-Mills) for the development of cultivars. RIDESA has produced 59 cultivars since 1990 and is now responsible for 59% of the total area cultivated with this plant in Brazil. In the last five years, 286 agronomists were trained in breeding programs at universities that comprise RIDESA. In this same period, the network formed 35 professors, 24 doctors and 7 post-docs in researches with this crop. It is also presented a conceptual approach on methods of sugar cane breeding involving families and genome-wide selection.
Key words:Saccharum spp., breeding for bioenergy, sugar cane cultivars, human resources training, network management.
1 Universidade Federal de Viçosa (UFV), Departamento de Fitotecnia, 36.570-000, Viçosa, MG, Brazil. *E-mail: barbosa@ufv.br
2 Embrapa Florestas, Current address: UFV, Departamento de Engenharia Florestal
3 Universidade Federal de Alagoas,Centro de Ciências Agrárias, BR 104, Norte, km 85, 57.100-000, Rio Largo, AL, Brazil
4 Universidade Federal do Paraná (UFPR), SCA, DFF, Rua dos Funcionários, 1540, 80.035-050, Juvevê, Curitiba, PR, Brazil
5 UFV, Departamento de Estatística INTRODUCTION
Undoubtedly, the cultivars are the bases of the entire pro-duction chain involving the propro-duction of renewable energy, especially ethanol and bioelectricity, produced by sugar cane in Brazil. Therefore, it is crucial to maintain and increase investments in breeding, as well as in other technologies, so the sugar cane, among other species with potential energy, is competitive against other energy crops of worldwide interest.
However, when analyzing the background of sugar cane (Figure 1), it can be seen some instability in actions related
to genetic improvement of this crop in Brazil. The first fact
was the extinction, in 1990, of PLANALSUCAR (National Program for Sugar Cane Breeding). As a result, the breed-ing program was transferred to some public universities, which created RIDESA (Inter-University Network for the Development of Sugarcane Industry; www.ridesa.com.br), presented in more details in this review paper. The second action was the closing, in 2004, of the breeding program
of COPERSUCAR (Central Cooperative of Sugar and Alcohol Producers of the State of São Paulo). Even with the law of cultivar protection, created in 1997 (Figure 1),
COPERSUCAR had difficulties in collecting royalties for
maintaining its breeding program, supported maintained by a group of about thirty cooperative mills since 1969. In 2004, COPERSUCAR became OSCIP (Civil Society Or-ganization of Public Interest), denominated CTC (Sugarcane Technology Center), and in 2011, it became a Corporation,
receiving financial support of hundreds of mills and suppliers. These changes were intended to attract more financial and
technological resources for researches, in order to maintain its competitiveness and to ensure to Brazil the leadership position in the global sugar cane industry. However, such
actions affected, differently and financially, both programs,
which spent time and resources to adjust to the new reality.
Historically, the financial resources invested in research and
genetic improvement of sugarcane have been inconsistent and inadequate, compared to other species.
It is estimated that investments of 50 million dollars are required to develop a cultivar. Currently, the cost of cultivation of sugar cane, as a percentage of the cost of production, is much lower than in other crops. This cost has varied around 1-6 dollars per hectare, which represents less than 0.3% of the production cost. This is a very low value compared with other cultures. In the case of corn, for example, the germplasm cost is 10%
of the production cost. For genetically modified corn and soybeans, the
germplasm cost is around 15% and 10%, respectively. Therefore, for Brazil to remain competitive in the energy and sugar industry, from sugarcane cultivation, it is required additional public and private investments in clas-sical and advanced genetics, as well as basic research and technological innovation throughout the production chain.
Since the first major investment of public resources during the im -plementation of Proálcool (National Ethanol Program) in 1974, only in 2006 the Brazilian government became interested again in the subject, when creating Embrapa Agroenergy and encouraging researchers from universities and institutes to do bioenergy research projects supported by their agencies. However such funds have been inconsistent and this will directly affect the competitiveness of the sugar cane in Brazil compared to other world scenarios.
However, even before this changing scenario, the total recoverable sugar productivity (TRS; sugars: sucrose, fructose and glucose) per hectare in Brazil has increased at the rate of 155.7 kg ha-1 (
Y=3697.6+155.7x;R2=0.93). In
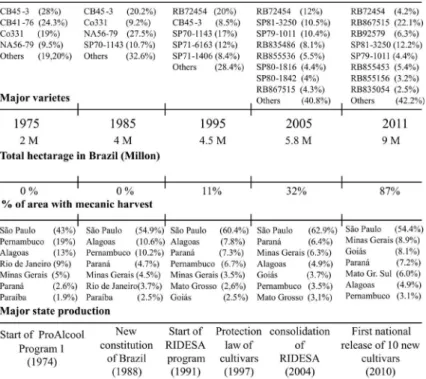
1970, the national yield by hectare of TRS was 3712 and, in 2011, it reached Figure 1. Major cultivars, producing states, the total area cultivated with sugar cane in Brazil and the percentage of mechanically harvested area in 1975, 1985, 1995, 2005 and 2011; and the major events that impacted sugar cane industry after Proálcool started. In parentheses are shown the percentages of the main cultivars and the main producing states in 1975, 1985, 1995, 2005 and 2011.
9148 kg ha-1. Obviously, these gains are due to the use of technology, both in agriculture and
in industry. In this field, cultivars occupied a prominent position, although it is difficult to
quantify the contribution of each factor of production to the advance of this sector.
An estimate of the genetic improvement contributions considers that 50% of the productivity gain is due to the continuous replacement by other more productive culti-vars. Thus, if considered half the advances of 155.7 kg ha-1 TRS, from 1970 to 2011, there would be 77.85 kg ha-1. That would mean an increase of 700.6 million tons of TRS, in 2011, in an area of 9 million hectares in Brazil, due to the continuous replacement of cultivars. This would represent about 175 million dolar, considering the current price of TRS (U$0.24). In percentage terms, this represents an increase of 4% per year in terms of kg ha-1 of TRS, quite considerable when compared to the percentage gains reported
in other cultures. Dias (2011) affirms that
the Brazilian programs for sugar cane breed-ing has dropped 111 sugarcane cultivars, as registered by the Ministry of Agriculture, and that only in the last decade (2000-2009), new cultivars accounted for 20.8 % gain in productivity (in m3 ha-1) with ethanol.
THE ORIGIN OF RIDESA
The IAA (Institute of Sugar and Alco-hol), associated to the Ministry of Industry and Trade of the Federal Government, was established in 1933. This Institute had as main objectives the sugar market regulations in the country and the promotion of ethanol production. During the implementation of Proálcool, PLANALSUCAR was created on July 29th, 1971, to power the development of technologies for the sugar cane sector. The
program had five major regional coordinators,
Until 1988, the production of ethanol in Brazil was heavily regulated and subsidized by the Federal Government. With the promulgation of the new federal constitution in 1988, it was established a new scenario for economic policy, which ended with the subsidy programs, including Proálcool (Figure 1). It is important to emphasize that, during that period, the country was going through problems in its economy, like high
inflation, besides the low price of oil (around US$ 25), which
negatively and indirectly affected Proálcool. Therefore, the scenario was not favorable to the production of ethanol. Soon, all incentives to develop research with sugar cane, including breeding, were interrupted with the extinction of IAA in 1990. Consequently, staff and infrastructure of coordinating and experimental stations of PLANALSUCAR were incor-porated into some public universities, which belong now to RIDESA. Researchers and technicians were incorporated into
universities, but without the financial resources to conduct
their research with sugar cane. Those who remained in
uni-versities organized themselves and started the first projects
for fundraising, especially near the mills and distilleries that produce sugar and ethanol. Therefore, it was necessary to split
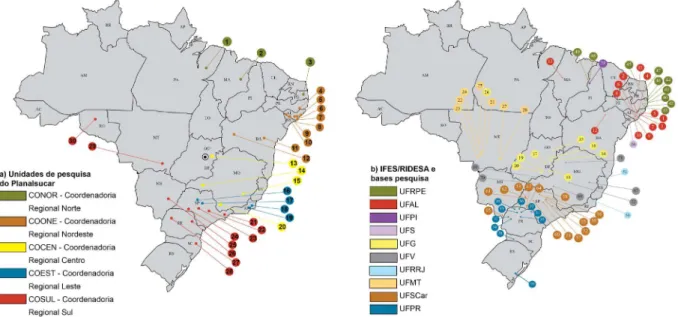
into areas of performance (Figure 2b), so that the financial
resources of the private sector were distributed and invested in universities in order to promote research and to continue the program, especially breeding. But this transition was not easy, since without funds some universities had a lot of
difficulty to enable their breeding programs. This occurred
especially in those states with fewer sugar and ethanol mills. After this phase, RIDESA expanded with the incorporation of the Federal University of Paraná (UFPR) and Sergipe (UFS)
in 1992. In 2003, the Federal University of Goiás (UFG) also joined RIDESA. The Federal Universities of Mato Grosso (UFMT) and Piauí (UFPI) became members in 2008.
However, since most sugar and ethanol companies were located in São Paulo (Figure 1), the Federal University of
São Carlos (UFSCar) received a lot of financial contributions
from mills and distilleries. As a result of infrastructure and
germplasm that UFSCar got from PLANALSUCAR, five cultivars were released in 1992, another five in 1995, and
six in 1998 (Table 1). Clones that originated these cultivars were created by PLANALSUCAR. It is observed that these cultivars have two digits after the code RB and are numbered less than 90. For example, the cultivar RB835486 had the seed produced in 1983 by PLANALSUCAR, and was
in-corporated by UFSCar, which finalized the experiments in
RIDESA. The further code represents the selection number allocated to the respective clone, i.e. 5486.
Through the germplasm received from PLANALSUL-CAR by the Federal University of Alagoas (UFAL), it was
released nine cultivars, five in 1993 and four in 2000 (Table
1). Likewise, the Federal University of Pernambuco (UFRPE) released two cultivars in 1996, and two other in 2005. On the other hand, the Federal University of Viçosa (UFV) released one cultivar in 1998, UFPR released four in 2001, and the Federal Rural University of Rio de Janeiro (UFRRJ) released one cultivar in 1999, and another in 2002. All these cultivars were created during PLANALSUCAR, and the experiments to evaluate the clones were initiated in 1990, before the transition to RIDESA. From the hybridizations made after 1990, 24 new cultivars were produced by RIDESA (Table 2).
Since the transition of PLANALSUCAR to universities, it was established a network research model, which has been consolidated in RIDESA in recent years. The following
as-sumptions for this network research are defined in technical
cooperation agreement signed among the universities: 1) funding should be primarily private, a fact that has ensured
continuous flow of financial resources in the long term for
the development of the program; 2) Each university should develop its own SCBP (Sugar Cane Breeding Program) in partnership with mills and distilleries of the state in which it is located, raising private resources to do so; 3) all uni-versities should assist in maintaining the germplasm bank and crossing experimental stations, being this cost of two million dollars annually distributed among the universities, and in proportion to the contributions received from the partnerships with mills and distilleries; 4) the university must register and protect their cultivars in the Ministry of Agriculture, and these cultivars should be licensed to other
universities that are members of RIDESA; 5) the partnership model with mills and distilleries should involve introduction, evaluation and selection of clones through experiments in companies. At the same time, universities should provide, by contract, a nonexclusive license to use cultivars RB, being decided that 5% of the partnership are royalties; 6) exchange between promising clones should be performed annually among universities, so that those clones developed in other states are evaluated in experiments on the lands of mills and distilleries of the other States.
Thus, the research of RIDESA are developed and shared among all partner universities, stimulating the exchange of
information, knowledge and the scientific and technology
results. This greatly increases the ability and the national scope of the results of research and innovation. RIDESA has no legal personality, because it was created through a technical cooperation agreement between the universities. The top management has been made by the universities Table 1. Thirty-five cultivars released by RIDESA from the merger of the technical and patrimonial collection of PLANALSUCAR in 1990
Release year Property Holder Cultivars1
1992 UFSCar RB785750, RB806043, RB825336, RB835089 e RB835486
1993 UFAL RB75126, RB83102, RB83160, RB83252 e RB83594
1995 UFSCar RB835019, RB855156, RB855453 e RB855563
1996 UFRPE RB763710 e RB813804
1998 UFSCar RB835054, RB845257, RB855536, RB855113, RB855546 e RB855035
1998 UFV RB867515
1999 UFRRJ RB758540
2000 UFAL RB8495, RB842021, RB855511 e RB855463
2001 UFPR RB845197, RB865230, RB845210 e RB855036
2003 UFRRJ RB858927
2005 UFRPE RB863129 e RB872552
1 The first two digits after RB refer to the year of hybridization. The other numbers refer to the original code of the clone; UFSCar: Federal University of São Carlos, UFAL: Federal University of Alagoas, UFRPE: Federal Rural University of Pernambuco, UFV: Federal University of Viçosa, UFRRJ: Federal Rural University of Rio de Janeiro and UFPR: Federal University of Paraná.
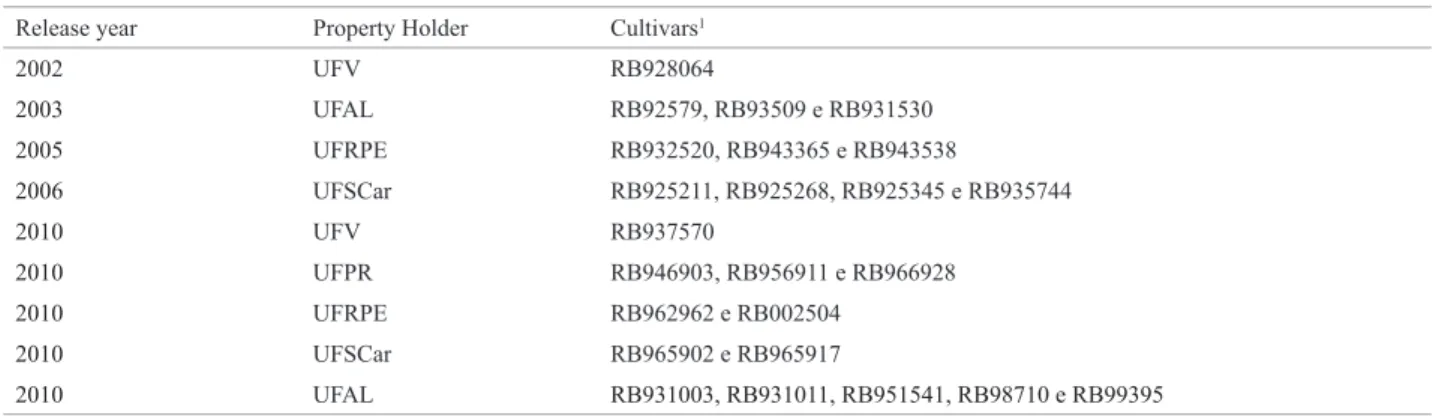
Table 2. Twenty-four cultivars released by RIDESA after hybridizations performed, since 1990
Release year Property Holder Cultivars1
2002 UFV RB928064
2003 UFAL RB92579, RB93509 e RB931530
2005 UFRPE RB932520, RB943365 e RB943538
2006 UFSCar RB925211, RB925268, RB925345 e RB935744
2010 UFV RB937570
2010 UFPR RB946903, RB956911 e RB966928
2010 UFRPE RB962962 e RB002504
2010 UFSCar RB965902 e RB965917
2010 UFAL RB931003, RB931011, RB951541, RB98710 e RB99395
deans, who constitute a board of director, and among them a president is chosen. Among professors and researchers involved in the activities of SCBP, it is formed a council, being elected a general coordinator for a two year term.
RIDESA’S GERMPLASM BANK AND CROSSINGS
RIDESA started its research with the germplasm bank of the Flowering and Crossing Station of Serra do Ouro, in Mu-rici, Alagoas (lat 09º 13’ S, long 35º 50’ W and alt 515 m asl), with average annual rainfall of 2363 mm, average minimum temperature of 18.2 ºC, and average maximum temperature of 27.9 ºC. The station is located 34 km from the coast and has a total area of 32 hectares. For its privileged location
and climate, it allows the natural and profuse flowering of
sugar cane that are necessary for performing hybridizations previously planned by researchers of RIDESA (Barbosa et al. 2002). This research base had its origin in 1967, when the Union of Sugar Industry in the State of Alagoas implanted
the first collection of sugar cane genotypes, performing the first hybridizations selections for RB varieties. From 1971
until 1989, these activities were carried out by the IAA-PLA-NALSUCAR, which obtained and released 19 RB cultivars to the national productive sector (Barbosa et al. 2002). After 1990, Serra do Ouro was incorporeted to RIDESA, which
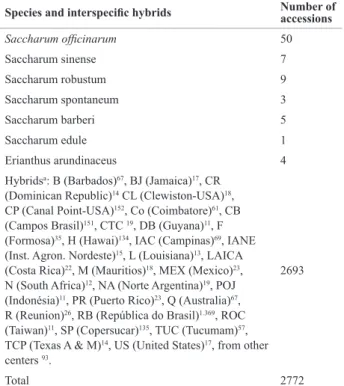
was controlled by the Center of Agricultural Sciences of UFAL. Therefore, 78 cultivars were generated from seeds produced at Serra do Ouro, 19 of them before RIDESA, and 59 cultivars released after 1990. Currently, the germplasm bank of Serra do Ouro is composed of 2772 genotypes from national and international programs (Table 3).
RIDESA has also counted on the Flowering and Crossing Station of Devaneio, in Amaraji (lat 08° 19.8’ S, long 35° 24.8’ W and alt 514 m asl), Pernambuco, since 2007. It was established with the objective of complementing Serra do Ouro Station in seed production for the breeding network. There are 15 hectares of total area and privileged climate, with average annual rainfall of 2.600 mm, average mini-mum temperature of 18.92 ºC, and an average maximini-mum temperature of 28.15 ºC. These conditions have allowed the
required natural and profuse flowering of sugar cane for the
realization of planned hybridizations. Devaneio is managed by EECAC (Sugar Cane Experimental Station of Carpina) of UFRPE. Nowadays, the germplasm bank of Devaneio consists of 814 genotypes, from national and international programs, involving basically clones and RB cultivars.
For the annual exchange of clones to be introduced at crossing stations from universities that are members of RIDESA, as well as imported genotypes, it is required quarantine. Thus, the genotypes introduced to crossing sta-tions have been previously evaluated in quarantine station coordinated by UFAL. This station is located in Bebedouro (lat 9° 39’ 59” S, long 35° 44’ 6” W and alt 4 m asl), Mac-eió, Alagoas, and has an area of 4 hectares of forest and 1 hectare of sugar cane cultivation. In the station, there are three rooms with capacity to evaluate approximately 250 genotypes, a room for phytosanitary treatment, compartments for soil sterilization and incineration of vegetative debris and packaging, and a greenhouse of 250 m².
THE IMPORTANCE OF INTERACTION BETWEEN PUBLIC AND PRIVATE COMPANIES IN THE PRODUCTION OF CULTIVARS
The public-private partnership has existed since PLA-NALSUCAR, but has been maintained and improved by RIDESA. During PLANALSUCAR, the federal government supported most of the research. The technologies developed, including the cultivars, were validated in business. This in-teraction of PLANALSUCAR researchers with companies provided continuity to this action in RIDESA. However, the cost of this research began to be supported by the mills and distilleries, having in return, from the universities, the dedication of professors, technicians and students in develop-Table 3. Number of accessions in the germplasm bank of RIDESA Serra
do Ouro, Murici, AL, Brazil
Species and interspecific hybrids Number of
accessions
Saccharum officinarum 50
Saccharum sinense 7
Saccharum robustum 9
Saccharum spontaneum 3
Saccharum barberi 5
Saccharum edule 1
Erianthus arundinaceus 4
Hybridsa: B (Barbados)67, BJ (Jamaica)17, CR (Dominican Republic)14 CL (Clewiston-USA)18, CP (Canal Point-USA)152, Co (Coimbatore)61, CB (Campos Brasil)151, CTC 19, DB (Guyana)11, F (Formosa)35, H (Hawai)134, IAC (Campinas)69, IANE (Inst. Agron. Nordeste)15, L (Louisiana)13, LAICA (Costa Rica)22, M (Mauritios)18, MEX (Mexico)23, N (South Africa)12, NA (Norte Argentina)19, POJ (Indonésia)11, PR (Puerto Rico)23, Q (Australia)67, R (Reunion)26, RB (República do Brasil)1.369, ROC (Taiwan)11, SP (Copersucar)135, TUC (Tucumam)57, TCP (Texas A & M)14, US (United States)17, from other centers 93.
2693
Total 2772
ing the breeding program of sugar cane. There are now 350 companies that have partnership agreements with universities. This represents 95% of Brazilian sugar cane, ethanol and bioletrectricity companies. Thus, validation and adoption of a new cultivar is greatly facilitated. That is, when a new cultivar is released, there are already companies, which are already growing them in large areas. This happens because all the companies receive the clones for evaluation experi-ments, some years before its possible release as a cultivar.
RIDESA’s partnership model allows the definition of
management of cultivars. There is hundreds of experiments conducted on the lands of mills and distilleries for this purpose. In addition, clones that present high yield in the experiments are evaluated in areas of 10 to 100 hectares in different management conditions. Thus, there is a very positive interaction between university and mills staff, increasing the number of observations and the planning of seedling nurseries, especially of new genotypes that may be released as new cultivars.
CULTIVARS PRODUCED BY RIDESA
‘RB72454’ is a cultivar of high yield potential when com-pared to all cultivars that were developed by PLANALSUCAR. A growing area with this cultivar was expanded after 1990. It occupied 20% of the total area cultivated with sugar cane in Brazil in 1995, but it dropped to 4.2% in 2012 (Figure 1), due to yield loss that came from mechanization, and susceptibility to orange rust (Puccinia kuehnii). The first occurrence of the disease in Brazil was registered in December 2009.
Another cultivar that deserves attention is the ‘RB835486’, which was grown mainly in central Brazil, comprising the western state of São Paulo, Minas Gerais, Goiás and Mato Grosso. It occupied about 20% of the area cultivated with sugar cane in some Brazilian cerrado mills. Considering the total area cultivated with sugar cane, it occupied about 8% in 2005 (Figure 1). This is an early maturing cultivar adapted to mechanical harvesting and has intermediate tolerance to brown rust (Puccinia melanocephala H. & P.Syd.).
Among the 35 cultivars released by RIDESA (Table 1), ‘RB855536’ is highlighted, presenting 5.5% of the cul-tivated area in 2005, and ‘RB867515’, with 4.3% (Figure
1). The first was cultivated mainly in the center-south, in
soils with high fertility and greater moisture retention. The second, ‘RB867515’, which is hard and more productive in dystrophic and sandy soils, reached 22.1% of the area cultivated with sugarcane in 2011. In that same year, culti-vars RB855453, RB855156 and RB835054 were adopted, being early maturing for harvesting in south-central Brazil. Table 2 presents 24 cultivars released by RIDESA, whose hybridizations were performed after 1990, i.e., such clones
were created by the universities. Among them, the first to
be widely adopted was the ‘RB92579’, occupying 6.3% of the cultivated area in 2011, and about 28% and 21% in the states of Alagoas and Pernambuco, respectively.
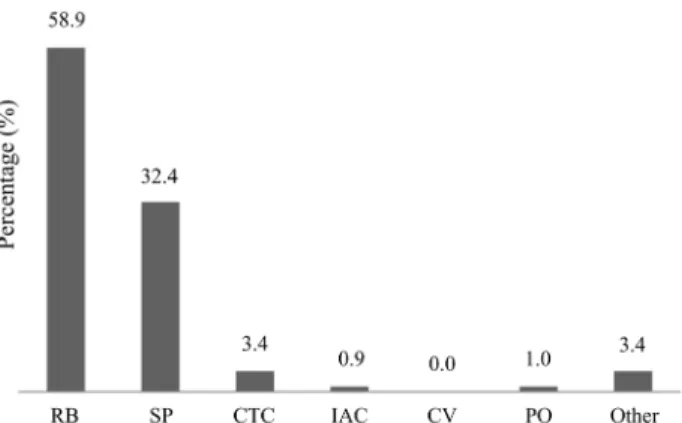
The adoption and use of new cultivars is the best way to quantify the results of research and investment of pub-lic and private resources. RIDESA has contributed to the production of sugar cane in Brazil, accounting for 58.9% of its total cultivated area (Figure 3).
Figure 3. Varieties planted and cultivated by the sugar cane breeding program’s acronym in Brazil, 2011 season. Acronyms/Institution: RB / RIDESA; SP/COPERSUCAR (program extinct in 2004); CTC/Sugar-cane Technology Center; IAC/Agronomic Institute of Campinas, CV/ Canavialis-Monsanto; PO/PAUL Ometto (extincted program); Other: Clones in tests in these same programs.
RIDESA’S NETWORK RESEARCH AND HUMAN RESOURCES TRAINING
RIDESA consists of 246 professionals dedicated to the breeding program, distributed in 10 universities. Among them, 89 are Ph.D. Professors and Researchers, 62 are Agricultural Technicians, 75 are Operational and 20 are Administrative employees. RIDESA also has 72 research bases, consisting of Crossing Stations, Experimental Sta-tions, Research Centers, and Selection SubstaSta-tions, being the last one conducted in partnership with mills (Figure 2b).
In addition to the great success in the development of sugar cane cultivars in Brazil, this network stands out in the training of human resources. Thus, the universities infra-structure has provided support for training students at the undergraduate and graduate levels in the crop of sugar cane. There are hundreds of professionals who work for private
companies and public institutions. In the past five years, there
This training occurs in the mills, under the supervision of professors from the universities that coordinate the program.
There are universities in RIDESA, which have
post-graduate programs. In the last five years, 35 Masters and
24 PhD were graduated, developing researches related to the improvement of sugar cane. Also, during this period, there were 7 Post-Docs dedicated on these projects. There
are several scientific methodology proposals that have con -tributed to the continuous evolution of knowledge directed to genetic improvement of sugar cane, as reported below.
METHODS OF SELECTION
Genetic improvement is based on two actions: i) the
identification of superior individuals and ii) the creation of
better new genotypic combinations by crossing among these individuals. In both phases, the selection is fundamental and is performed based on the genetic evaluation of individuals and aims to: i) infer their genetic values ii) sort them based on their
genetic values. Therefore, studies to assess the efficiency of
augmented designs or plot sizes in the early stages of selection
and sampling of families in experiments have been carried out (Leite et al. 2006, Souza et al. 2006, Leite et al. 2009). Other studies involving selection of families via REML/ BLUP (Barbosa et al. 2004, Barbosa et al. 2005, Pedrozo et
al. 2011) or calculation of the parentage coefficient for use
in procedures for selecting clones and families (Peternelli et al. 2009) have also been developed by RIDESA.
The implementation of recurrent selection in sugar cane is based on experimentation with families from controlled
crossings. In this context, different identification methods
and selection of superior individuals for cloning and for making new crosses may be employed. The comparative
efficiency of selection methods involving the evaluation of
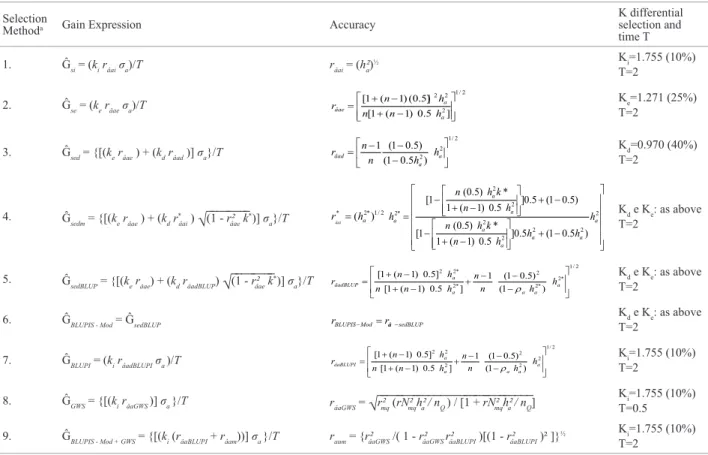
full-sib families in sugar cane is discussed below, when it is presented the expressions of the gain with the selection and accuracy for nine selection methods (Table 4). For comparisons, it was considered the evaluation of n = 100
plants (five replicates of 20 plants each, being each plot
consisted of two rows of 5 m length and spaced 1.40 m apart) per full-sib family (Table 5).
Table 4. Expressions of genetic gains derived for comparative efficiency of selection methods in sugar cane, considering different characters with individual heritability in the narrow sense (h²a)
Selection
Methoda Gain Expression Accuracy
K differential selection and time T
1. Ĝsi = (ki râai σa)/T râai = (h²a)½ Ki=1.755 (10%)
T=2
2. Ĝse = (ke râae σa)/T
2 / 1 2 2 2 ] 5 . 0 ) 1 ( 1 [ )] 5 . 0 ( ) 1 ( 1 [ − + − + = a a âae h n n h n
r Ke=1.271 (25%)
T=2
3. Ĝsed = {[(ke râae ) + (kd râad )] σa}/T
2 / 1 2 2) 5 . 0 1 ( ) 5 . 0 1 ( 1 − − − = a a âad h h n n
r Kd=0.970 (40%)
T=2
4. Ĝ
sedm = {[(ke râae ) + (kd r *
âai ) √͞(͞1͞ -͞ ͞r²â͞ae͞ ͞k *
)] σa}/T * ( 2*)1/2
a h r âai= − + − + − − + − + − = 2 2 2 2 2 2 2 * 2 ) 5 . 0 1 ( 5 . 0 ] 5 . 0 ) 1 ( 1 * ) 5 . 0 ( 1 [ ) 5 . 0 1 ( 5 . 0 ] 5 . 0 ) 1 ( 1 * ) 5 . 0 ( 1 [ a a a a a a a a h h h h n k h n h n k h n
h Kd e Ke: as above
T=2
5. Ĝ
sedBLUP = {[(ke râae) + (kd râadBLUP) √͞(͞1͞ -͞ ͞r²â͞ae͞ ͞k * )] σ
a}/T 2 / 1 * 2 * 2 2 * 2 * 2 2 ) 1 ( ) 5 . 0 1 ( 1 ] 5 . 0 ) 1 ( 1 [ ] 5 . 0 ) 1 ( 1 [ − − − + − + − + = a a a a a âadBLUP h h n n h n n h n r ρ
Kd e Ke: as above T=2
6. ĜBLUPIS - Mod = ĜsedBLUP rBLUPIS−Mod=râa−sedBLUP
Kd e Ke: as above T=2
7. ĜBLUPI = (ki râadBLUPIσa )/T
2 / 1 2 2 2 2 2 2 ) 1 ( ) 5 . 0 1 ( 1 ] 5 . 0 ) 1 ( 1 [ ] 5 . 0 ) 1 ( 1 [ − − − + − + − + = a a a a a âaBLUPI h h n n h n n h n r ρ
Ki=1.755 (10%) T=2
8. ĜGWS = {[(ki râaGWS )] σa }/T râaGWS = √͞r²͞m͞q ͞(͞r͞N²͞m͞qh͞a͞²͞/ ͞n͞Q ͞) ͞/ ͞[͞1͞ ͞+͞ ͞r͞N²m͞͞q͞ha͞²͞/ ͞n͞Q]
Ki=1.755 (10%) T=0.5
9. ĜBLUPIS - Mod + GWS = {[(ki (râaBLUPI + râam))] σa }/T raum = {r²âaGWS /( 1 - r²âaGWS r²âaBLUPI )[(1 - r²âaBLUPI )² ]}
½ Ki=1.755 (10%) T=2
a 1. Mass in sugar cane plant; 2. Between families in sugar cane plant; 3. Between families in sugar cane plant and ratoon; 4. Between families in sugar cane plant and missal in ratoon;
5. Between families in sugar cane plant and BLUP in ratoon; 6. Modified BLUPIS in sugar cane plant ratoon; 7. Individual BLUP in sugar cane plant; 8. GWS in seedlings; 9. Modified BLUPIS + GWS; k* = k(k – t) = 1.271(1.271-0.25) = 1.298: reduction factor in h2 due to selection between families in sugar cane plant r²
a* = (1 - r²âaek * ) σ
It is noticed that among the methods based only on phe-notypes, the more accurate are those that involve BLUP and
modified BLUPIS (methods 5, 6 and 7 of Table 5). Among
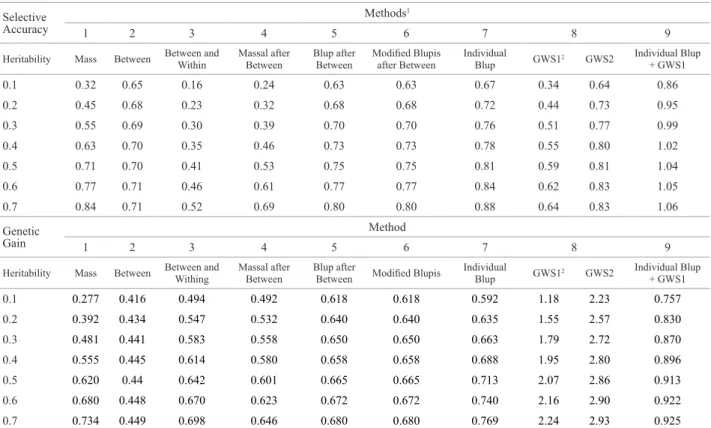
the methods based on molecular markers, GWS1 (Genome Wide Selection using 2 thousand individuals genotyped for 20 thousand markers) shows accuracy similar to the mass selection, whereas GWS2 (Genome Wide Selection using 10 thousand individuals genotyped for 30 hundred marks) shows accuracy similar to individual BLUP selection, both with the advantage of early selection in seedling level. The simultaneous method individual BLUP + GWS1 leads to accuracy practically equal to 1, but it demands the genotyp-ing of 2000 individuals to 20,000 marks in the population of estimation of the markers effects.
Furthermore, it was noticed that methods based on mo-lecular markers have genetic gain per unit time much superior because it only takes half a year (T = 0.5) to complete the selection cycle, whereas other methods take two years (Table 5). Thus, GWS has great potential, but it demands great effort in terms of number of individuals for genotyping and number
of markers. Among the methods based only on phenotypes,
BLUP and modified BLUPIS lead to greater gains. These two
methods have been used in RIDESA’s breeding program since the last decade (Barbosa et al. 2004, Barbosa et al. 2005). The results also show that the selection among families in sugar cane plant and individual selection in ratoon cane, in the mix of families previously selected in the stage of sugar cane plant through BLUP is an appropriate strategy (Table 5). The high repeatability and genetic correlation between
sugar cane plant and ratoon confirms the feasibility of this
approach (Pedrozo et al. 2011).
The improvement of selection methods in sugar cane breeding has been emphasized by RIDESA. Moreover, the adoption of BLUP, other important developments were
made to enhance the efficiency of the process. The method
BLUPIS, for example, was developed by Barbosa and Re-sende (2006) and consists in determining dynamically the number of individuals to be selected in each family, with no individual assessment. The expression that determines the
nk number of individuals to be selected in each k family is Table 5. Selective accuracies and genetic gains (in additive genetic standard deviation units - σa ) per unit time (year), associated with the selection
methods in sugar cane
Selective Accuracy
Methods1
1 2 3 4 5 6 7 8 9
Heritability Mass Between Between and Within
Massal after Between
Blup after Between
Modified Blupis after Between
Individual
Blup GWS12 GWS2
Individual Blup + GWS1
0.1 0.32 0.65 0.16 0.24 0.63 0.63 0.67 0.34 0.64 0.86
0.2 0.45 0.68 0.23 0.32 0.68 0.68 0.72 0.44 0.73 0.95
0.3 0.55 0.69 0.30 0.39 0.70 0.70 0.76 0.51 0.77 0.99
0.4 0.63 0.70 0.35 0.46 0.73 0.73 0.78 0.55 0.80 1.02
0.5 0.71 0.70 0.41 0.53 0.75 0.75 0.81 0.59 0.81 1.04
0.6 0.77 0.71 0.46 0.61 0.77 0.77 0.84 0.62 0.83 1.05
0.7 0.84 0.71 0.52 0.69 0.80 0.80 0.88 0.64 0.83 1.06
Genetic Gain
Method
1 2 3 4 5 6 7 8 9
Heritability Mass Between Between and Withing
Massal after Between
Blup after
Between Modified Blupis
Individual
Blup GWS1
2 GWS2 Individual Blup + GWS1
0.1 0.277 0.416 0.494 0.492 0.618 0.618 0.592 1.18 2.23 0.757
0.2 0.392 0.434 0.547 0.532 0.640 0.640 0.635 1.55 2.57 0.830
0.3 0.481 0.441 0.583 0.558 0.650 0.650 0.663 1.79 2.72 0.870
0.4 0.555 0.445 0.614 0.580 0.658 0.658 0.688 1.95 2.80 0.896
0.5 0.620 0.44 0.642 0.601 0.665 0.665 0.713 2.07 2.86 0.913
0.6 0.680 0.448 0.670 0.623 0.672 0.672 0.740 2.16 2.90 0.922
0.7 0.734 0.449 0.698 0.646 0.680 0.680 0.769 2.24 2.93 0.925
1 Methods: 1. Mass in sugar cane plant; 2. Between families in sugar cane plant; 3. Between families in the sugar cane plant and within ratoon; 4. Between families in sugar cane plant and missal in ratoon; 5.Between families in sugar cane plant and BLUP in ratoon; 6. Modified BLUPIS in sugar cane plant and ratoon; 7. Individual BLUP in sugar cane plant; 8. GWS in seedlings; 9. Modified BLUPIS + GWS; k* = k(k – t) = 1.271(1.271-0.25) = 1.298: reduction factor in h2 due to selection among families in sugar cane plant.
given by: nk = (ĝk / ĝj )nj , where: ĝj refers to the genotypic effect of the best family; ĝk refers to the genotypic effect of the k-th family, and nj refers to the number of selected
individuals in the best family, which should be defined by
the researcher (typically 50 to 100). The procedure was applied by Oliveira et al. (2011).
An improvement on BLUPIS is considering the family estimated genotypic value (VG) instead of its g genotypic effect, and nk-1 instead of nj. Thus, it is given
nk = (VGk/VGj=1 ) nk-1 , where VG = general mean + ĝand nk-1
refers to the number of selected individuals in the immediately preceding family in the rank. In relation to nj regarding to the ones selected in the best family, this should be the total number of individuals in the family. This new predictor,
modified BLUPIS, reproduces almost exactly individual
BLUP, leading to 98% correlation between the two methods, same total number of selected individuals, same number of selected individuals per family (error of only 2-4 individuals per family), and selection of the same individuals by both methods. These results are consistent with those presented
in Tables 2 and 3, which show that modified BLUPIS and
individual BLUP are virtually identical. These are far supe-rior to traditional sequential selection between and within families, especially for traits with low heritability (Table 5).
It was found that the individuals selected by
indi-vidual BLUP and by modified BLUPIS come from 30%
best families. Thus, the methods 5 and 6 shown in Table
5 tend to be identical. Modified BLUPIS can be used
according to the following steps: a) Identifying superior families in sugar cane plant, harvesting the whole plot; b) Using modified BLUPIS to determine the number of selected individuals per family; c) Measuring in the ratoon sugar cane, at individual level, only families with
one or more individuals indicated by modified BLUPIS
(about 30% of families) and evaluating the other families by harvesting the whole plot and doing an average per plant in plot; d) Making the individual BLUP prediction in selected families and ordering the individuals in the mix of these families. The genotype value of each indi-vidual can be calculated by gi = gfam + Res*h²ad, where:
Res = yratoon - (Xb + Zgfam + Wplot), from the harvests combined analysis, h²d = Var(gfam) / Var(within family in ratoon); y ratoon: individual measurements performed in ratoon sugar cane and Xb+Zgfam+Wplot: individual
phenotypes predicted via model fit in the joint analysis of
sugar cane plant and ratoon, where b, gfam and plot are block, family genotypic and plot effects estimated and, X, Z and W are incidence matrices of the referred effects.
According to Bayesian Principle, it should not be selected more than 50% of the evaluated individuals in each family
(Resende 2002). The other (indicated by BLUPIS or BLUP) must be taken randomly among the non-evaluated individu-als of each family. For example, when it is desired to select 30 individuals, but from a test of only 40 individuals taken
randomly from the progeny. In this case, the most efficient
procedure is to select the best 20 individuals (which will
probably be above progeny mean) identified based on the
test and take the other 10 (not tested) randomly from the progeny. It is expected that among these 10, about 5 are above progeny mean. Thus, among 30 individuals selected, it would be collected, on average, 25 and not only 20 indi-viduals above progeny mean.
In the last phase of clones recommendation, an efficient
method of selection was developed, considering experimen-tation involving multiple locations and multiple harvests, while contemplating the heritability and repeatability of the traits and the genetic correlations across seasons and loca-tions (associated with double and triple interacloca-tions). This approach includes, at the same time, productivity, stability and adaptability, and led to the method of harmonic aver-age of relative performance of genetic values (MHPRVG), which is computed in the context of linear mixed models through REML/BLUP (Resende 2002). This method has been used frequently in the Sugar Cane Breeding Program of RIDESA (Oliveira et al. 2005, Bastos et al. 2007).
The improvement of the experimental quality has also been emphasized by RIDESA. And the experimental quality assessment should be based on selective accuracy or on the magnitude of Snedecor’s F statistic, rather than the
experi-mental coefficient of variation (Resende and Duarte 2007).
Experiments with few repetitions and low genetic variability
are inadequate even if associated with low coefficient of
experimental variation. Optimization of experimentation is discussed in detail by Peternelli et al. (2011).
GENOME WIDE SELECTION
Genome-wide selection (GWS) or genomic selection (GS) was proposed by Meuwissen et al. (2001) as a way to
increase efficiency and to accelerate the genetic improve -ment. GWS emphasizes the simultaneous prediction (without
the use of significance tests for individual markers) of the
The genetic effects of markers on phenotypes of quantita-tive traits are summed and used to predict genetic values of only genotyped individuals, which are candidate for selec-tion in breeding programs. The predicselec-tion and selecselec-tion can be performed in very young stages of plants and animals, hence accelerating the process of breeding. Additionally, the prediction tends to be more accurate by considering the actual genetic parentage of individuals in evaluation, rather than the mathematically expected parentage mean (Resende 2007). The GWS provides a direct early selection (DES), therefore it acts early on genes expressed in adult stage. On the other hand, the traditional early selection is indirect, because it acts (through phenotypic evaluation) on genes activated in early age, hoping that they inform partly on genes expressed in adult stage. Thus, the DES provided by the GWS is especially important for the improvement of perennial and semi-perennial organisms such as sugar cane.
In summary, the superiority of GWS on selection based on phenotypes can be attributed to four factors: i) use of
the real and specific parentage matrix of each character,
which increases the selection accuracy ii) feasibility of DES, which increases the genetic gain per unit time, iii) permission of the repeated evaluation of each allele (provid-ing experimental replication) without the use of clonal and progeny testing, which increases the selection accuracy iv)
use of more information by combining three information types (phenotypic, genotypic and pedigree) to correct the data and do the genetic analysis, which increases accuracy.
GWS is the new paradigm in quantitative genetics in plant and animal breeding, and practical results already exist for eucalyptus (Resende et al. 2012) and pine (Resende Jr. et al. 2012). It is believed that GWS will provide a positive impact on selection methods and strategies for breeding. However, it is necessary to get practical experience with GWS in order to infer on its effectiveness. For sugar cane, GWS presents great potential, but it demands great effort in terms of number of individuals for genotyping and number of markers, as seen in Table 5.
The accuracy of GWS depends on five factors: i) the
heritability of the trait (h²), ii) the number of loci control-ling the character and distribution of its effects (nQ), iii) the number of individuals in the population of discovery (N); iv) the effective population size (Ne), (v) the spacing between markers (L), which depends on the number of markers and size of the genome. Resende (2008) and Resende et al. (2008) presented the following estimator for accuracy computation (rgĝ) expected from GWS:
(
)
2 2 2/ / 1 1 2 2/
ˆ = + −
rgg r Nr h n N r h n
mq mq Q mq Q
Table 6. Accuracy (rgg) of GWS to various scenarios in cane sugarcane
h² N Nmarks r2mq rgg N Nmarks r2mq rgg
0.1 1000 1000 0.11 0.04 2000 1000 0.11 0.06
0.2 1000 1000 0.11 0.06 2000 1000 0.11 0.08
0.3 1000 1000 0.11 0.07 2000 1000 0.11 0.09
0.4 1000 1000 0.11 0.08 2000 1000 0.11 0.11
0.1 1000 10000 0.56 0.20 2000 10000 0.56 0.27
0.2 1000 10000 0.56 0.27 2000 10000 0.56 0.36
0.3 1000 10000 0.56 0.32 2000 10000 0.56 0.41
0.4 1000 10000 0.56 0.36 2000 10000 0.56 0.45
0.1 1000 20000 0.71 0.25 2000 20000 0.71 0.34
0.2 1000 20000 0.71 0.34 2000 20000 0.71 0.44
0.3 1000 20000 0.71 0.40 2000 20000 0.71 0.51
0.4 1000 20000 0.71 0.44 2000 20000 0.71 0.55
0.1 1000 30000 0.79 0.27 10000 30000 0.79 0.64
0.2 1000 30000 0.79 0.37 10000 30000 0.79 0.73
0.3 1000 30000 0.79 0.43 10000 30000 0.79 0.77
0.4 1000 30000 0.79 0.48 10000 30000 0.79 0.80
where: 2
1
4
1
=
+
mq
r
N L
e
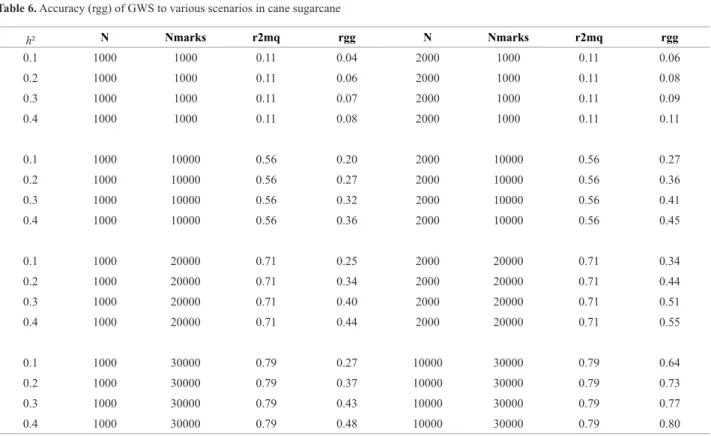
The amount nQ can be taken as the effective number of segregating chromosome segments in the population, given by nQ = 2NeLg/[Ln(2Ne)], where Ln is the natural logarithm and Lg is the length of the genome (20 Morgans for sugar cane). Table 6 presents GWS accuracies for various sce-narios in sugar cane.
In sugarcane, with a genome of 20 Morgans and an effective population size of 100, there are 755 independ-ent chromosome segmindepend-ents segregating in the population, which need to be captured by the markers. If individuals are genotyped for a thousand of markers, not all segments are
captured, and the coefficient of determination of genes by
markers is only 11%. If the individuals are genotyped for
30,000 markers, the coefficient of determination increases
to 79% (Table 6). Ten thousand genotyped individuals are required for 30,000 markers in order to obtain accuracy above 60%. But with 2000 genotyped individuals for 20,000 markers, spectacular gains per unit time are obtained, surpassing the gains from selection based on phenotypes (Table 5). With the accumulation of genotypic data over the years, the genetic evaluation system in sugar cane will involve both phenotypic and genotypic data, and RIDESA is getting ready for that.
ACKNOWLEDGEMENTS
The authors thank the Mills and Distilleries which are
partners with RIDESA for the constant financial support
for the breeding program development, and FAPEMIG,
FINEP, CNPq and Petrobras for the financial support for
research projects.
Melhoramento genético da cana-de-açúcar para bioenergia: a experiência
brasileira de pesquisa em rede com a RIDESA
Resumo – É apresentado o modelo RIDESA de melhoramento de cana-de-açúcar para etanol e sua contribuição científica, tecnológica
e na formação de recursos humanos. A RIDESA é a rede interuniversitária para desenvolvimento do setor sucroenergético do Brasil, e foi formada por um convênio de cooperação técnica entre dez Universidades Federais. Apresenta-se o modelo de gestão da rede, o qual envolve, dentre outros aspectos, a parceria público-privada (Universidades-Usinas) para desenvolvimento de cultivares. A RIDESA produziu 59 cultivares desde 1990 e responde, atualmente, por 59% da área total de cultivo com essa planta no Brasil. Nos últimos cinco anos, 286 agrônomos foram treinados nos seus programas de melhoramento nas universidades que compõem a RIDESA. Neste mesmo período, a rede formou 35 mestres, 24 doutores e 7 pós-doutores em pesquisas com a cultura. É apresentada também uma abordagem conceitual sobre os métodos de melhoramento de cana envolvendo a seleção de famílias e a seleção genômica ampla.
Palavras-chave: Sacharum spp., melhoramento para agroenergia, cultivares de cana, formação de recursos humanos, gestão de rede.
REFERÊNCIAS
Barbosa GVS, Cruz MM, Soares L, Rocha AMC, Ribeiro CAG, Sousa AJR, Ferreira JLC, Barreto EJS, Silva WCM and Santos AVP (2002) A brief report on sugarcane breeding program in Alagoas, Brazil. Crop Breeding and Applied Biotechnology 2: 613-616.
Barbosa MHP, Resende MDV, Bressiani JA, Silveira LCI and Peternelli LA (2005) Selection of sugarcane families and parents by Reml/Blup.
Crop Breeding and Applied Biotechnology 5: 443-450.
Barbosa MHP, Resende MDV, Peternelli LA, Bressiani JA, Silveira LCI, Silva FL and Figueiredo ICR (2004) Use of REML/BLUP for the selection of sugarcane families specialized in biomass production.
Crop Breeding and Applied Biotechnology 4: 218-226.
Bastos IT, Barbosa MHP, Resende MDV and Peternelli LA (2007) Avaliação da interação genótipos x ambientes em cana-de-açúcar via modelos mistos. Pesquisa Agropecuária Tropical 37: 195-203.
Dias LAS (2011) Biofuel plant species and the contribution of genetic improvement. Crop Breeding and Applied Biotechnology S1: 16-26.
Leite MSO, Peternelli LA and Barbosa MHP (2006) Effects of plot size on the estimation of genetic parameters in sugarcane families. Crop Breeding and Applied Biotechnology 6: 40-46.
Leite MSO, Peternelli LA, Babrosa MHP, Cecon PR and Cruz CD (2009) Sample size for full-sib family evaluation in sugarcane. Pesquisa Agropecuária Brasileira 44: 1562-1574.
Meuwissen THE, Hayes BJ and Goddard ME (2001) Prediction of total genetic value using genome-wide dense marker maps. Genetics 157: 1819-1829.
Oliveira R, Daros E, Resende MDV, Bespalhok Filho JC and Zambon JL (2011) Procedimento Blupis e seleção massal em cana-de-açúcar.
Bragantia 70: 796-800.
Oliveira R, Resende MDV, Daros E, Bespalhok Filho JC, Zambon JL, Ido O and Koehler H (2005) Genotypic evaluation and selection of sugarcane clones in three environments in the state of Paraná. Crop Breeding and Applied Biotechnology 5: 426-434.
Peternelli LA, Ferreira FM, Rocha RB, Barros WS and Barbosa MHP (2009) Análise dos coeficientes de endogamia e de parentesco para qualquer nível de ploidia usando o pacote estatístico R. Bragantia 68: 849-855.
Peternelli LA, Resende MDV and Mendes TOP (2011) Experimentação e análise estatística em cana-de-açúcar. In Santos FA, Borém A and Caldas C (eds). Cana-de-açúcar. Editora UFV, Viçosa, p. 333-353.
Resende Jr. MFR, Valle PRM, Resende MDV, Garrick DJ, Fernando RL, Davis JM, Jokela EJ, Martin TA, Peter GF and Kirst M (2012) Accuracy of genomic selection methods in a standard dataset of loblolly pine.
Genetics 190: 1503-1510.
Resende MDV (2002) Genética biométrica e estatística no melhoramento de plantas perenes. Embrapa Informação Tecnológica, Brasília, 975p.
Resende MDV (2007) Matemática e estatística na análise de experimentos e no melhoramento genético. Embrapa Florestas, Colombo, 561p.
Resende MDV (2008) Genômica quantitativa e seleção no melhoramento de plantas perenes e animais. Embrapa Florestas, Colombo, 330p.
Resende MDV and Barbosa MHP (2006) Selection via simulated individual BLUP based on family genotypic effects in sugarcane.
Pesquisa Agropecuária Brasileira 41: 421-429.
Resende MDV and Duarte JB (2007) Precisão e controle de qualidade em experimentos de avaliação de cultivares. Pesquisa Agropecuária Tropical 37: 182-194.
Resende MDV, Lopes OS, Silva RL and Pires IE (2008) Seleção genômica ampla (GWS) e maximização da eficiência do melhoramento genético.
Pesquisa Florestal Brasileira 56: 63-78.
Resende MDV, Resende Jr. MFR, Sansaloni C, Petroli C, Missiaggia AA, Aguiar AM, Abad JIM, Takahashi E, Rosado AM, Faria D, Pappas G, Kilian A and Grattapaglia D (2012) Genomic Selection for growth and wood quality in Eucalyptus: capturing the missing heritability and accelerating breeding for complex traits in forest trees. New Phytologist 194: 116-128.
Souza EFM, Peternelli LA and Barbosa MHP (2006) Designs and models effects definitions in the initial stage of a plant breeding program.