An Acad Bras Cienc (2015) 87 (4) Anais da Academia Brasileira de Ciências (2015) 87(4): 2243-2253
(Annals of the Brazilian Academy of Sciences)
Printed version ISSN 0001-3765 / Online version ISSN 1678-2690 http://dx.doi.org/10.1590/0001-3765201520140297
www.scielo.br/aabc
Spatial Distribution of Eggs of
Alabama argillacea
Hübner and
Heliothis
virescens
Fabricius (Lepidoptera: Noctuidae) on
Bt
and non-
Bt
Cotton
TATIANA R. RODRIGUES, MARCOS G. FERNANDES, PAULO E. DEGRANDE and THIAGO A. MOTA
Programa de Pós-graduação em Entomologia e Conservação da Biodiversidade, Faculdade de Ciências Biológicas e Ambientais, Universidade Federal da Grande Dourados, Caixa Postal 364, 79804-970 Dourados, MS, Brasil
Manuscript received on June 5, 2014; accepted for publication on February 4, 2015
ABSTRACT
Among the options to control Alabama argillacea (Hübner, 1818) and Heliothis virescens (Fabricius, 1781) on cotton, insecticide spraying and biological control have been extensively used. The GM ‘Bt’ cotton has been introduced as an extremely viable alternative, but it is yet not known how transgenic plants affect populations of organisms that are interrelated in an agroecosystem. For this reason, it is important to know how the spatial arrangement of pests and beneficial insect are affected, which may call for changes in the methods used for sampling these species. This study was conducted with the goal to investigate the pattern of spatial distribution of eggs of A. argillacea and H. virescens in DeltaOpalTM
(non-Bt) and DP90BTM
Bt cotton cultivars. Data were collected during the agricultural year 2006/2007 in two areas of 5,000 m2
, located in in the district of Nova América, Caarapó municipality. In each sampling area, comprising 100 plots of 50 m2
, 15 evaluations were performed on two plants per plot. The sampling consisted in counting the eggs. The aggregation index (variance/mean ratio, Morisita index and exponent k of the negative binomial distribution) and chi-square fit of the observed and expected values to the theoretical frequency distribution (Poisson, Binomial and Negative Binomial Positive), showed that in both cultivars, the eggs of these species are distributed according to the aggregate distribution model, fitting the pattern of negative binomial distribution.
Key words: Cotton leafworm, Gossypium hirsutum, Tobacco Budworm, GMO.
Correspondence to: Thiago Alexandre Mota E-mail: thiamota@hotmailcom
INTRODUCTION
Alabama argillacea (Hübner, 1818) and Heliothis virescens (Fabricius, 1781) (Lepidoptera, Noctuidae) are important pests of cotton that can cause considerable damage (Peres et al. 2012). Traditionally, these pests have been controlled with insecticides. Pesticide applications, however, have
negative environmental effects, such as killing beneficial organisms and creating insecticide-resistant moths. A viable alternative to insecticides is the use of transgenic, as Bacillus thuringiensis Berliner Bt cotton varieties.
An Acad Bras Cienc (2015) 87 (4)
to soybean and corn (James 2013). Besides being effective in pest control, Bt- modified crops are an economically viable alternative toreduce the need for chemical insecticide applications (Baker et al. 2008, Brookes and Barfoot 2007, Fitt 2008). For this reason, these GMOs are also believed to be a more environmentally friendly alternative (Pray et al. 2002, Qaim and Zilberman 2003) when compared with conventional pest control methods.
G e n e t i c a l l y m o d i f i e d p l a n t s h a v e revolutionized agriculture by creating crops that are resistant to certain insects (Shelton et al. 2002). In the case of Bt crops, insect resistance is achieved by incorporating, into the plant’s DNA, the gene for toxin production from the bacterium Bacillus thuringiensis Bt (Berliner) (Romeis et al. 2006). This gene enables the plant to produce the Bt protein, which is toxic to the larvae of many insects. The Bt protein is short-lived and does not linger in the environment. Furthermore, it is not toxic to many non-target insects, or to vertebrates (Glare and O’Callaghan 2000). Despite these desirable characteristics, however, it is not known with certainty whether the Bt protein of modified cotton affects the populations of several organisms in agroecosystems. For this reason, studies that aim to detect alterations in the spatial distribution of target and non-target insect populations in response to Bt cotton are extremely desirable.
In order to determine the patterns of spatial distribution of a species in a given ecosystem, it is
necessary to obtain individual count data, as defined
in (Young and Young 1998). This data can be used to make inferences about the spatial distribution of the sampled population.
Because transgenic plants seem to alter the distribution of insects in the environment, it is important to devise sampling techniques that can be used in these crops. In order to accomplish the
latter, however, we first need to understand how
insect populations are distributed in the trangenic
and non-trangenic crop fields.
The spatial patterns of organisms in the field
fall into three patterns: aggregated, uniform, or random (Ricklefs 2003). Placing the distribution of an organism into one of these three categories can be achieved through dispersion indexes and the theoretical distribution of their frequencies (Barbosa 1992). Although aggregation and dispersion indexes do not mathematically describe the distribution of the population studied (Elliot 1977), they provide data for an approximation of reality. It is important to note that knowing the distribution of frequencies (which describe mathematically the spatial distribution of the pest) is important to determine the adequate sampling criterion, for decision to control (Ruesink 1980, Taylor 1984).
Generally, it is important to know the particularities of the infestations caused by these pests in order to determine suitable management strategies for them, for instance, their type of
spatial distribution in the field. It is, thus, necessary
to have data to count these pests and to determine
their spatial distribution patterns, which define the
behavioral patterns of the population.
This study was conducted to compare the patterns of spatial distribution of eggs of A. argillacea and H. virescens between the cotton cultivar DeltaOpalTM (convencional cotton- Cv) and DP90BTM (Bt-cotton). We aimed to contribute to the understanding of the impact of the Bt-technology on the behavior of target adults, particularly with regards to their oviposition behavior.
MATERIALS AND METHODS
desCriptionoftHe samplinG area
An Acad Bras Cienc (2015) 87 (4)
SPATIAL DISTRIBUTION OF PESTS ON COTTON CROPS 2245
includes 300 ha, irrigated with center pivot. Sowing was conducted as follows: 80% for the cultivar DP90BTM Bt express the toxin Cry1Ac protein and
20% cotton cultivar with DeltaOpalTM (conventional
- Cv). The first Bt cotton emerged on December 13
and the first Cv cotton on December 27.
samplinG
The sampling was organized as follows: two areas of 5000 m2 were demarcated in the sampling area, one with Bt cotton and another with Cv cotton.
Each field was divided into 100 plots of 50 m2
(5 m X 10 m). In each plot we assessed two plants,
totaling 200 plants in each field. Assessments in
both cultivars were conducted weekly until the
appearance of the first flower. From the emergence of the first flower to the first boll, we conducted
two assessments per week. After the onset of the
first boll, we performed one evaluation every week.
We counted the eggs of the pests from January 10th, 2007 to March 27th, 2007, totaling
15 assessments in each cultivar. We searched the entire plant, from the pointer to the lowest leaves, recording the number of eggs of A. argillacea and H. virescens in each plant. During the evaluation period, no chemical pest control was performed.
aGGreGation indexes
The rates of aggregation used to determine the oviposition behavior of the moths A. argillacea and H. virescens were: Ratio Variâncie/Mean (I) (Rabinovich 1980), Morisita index (Id) (Morisita 1962, Rabinovich 1980) and K exponent of the negative binomial distribution Id (Elliot 1977, Silveira Neto et al. 1976, Southwood 1966).
tHeoretiCal distriButionof frequenCies
The theoretical distribution of the frequencies used to evaluate the spatial distribution of the species observed were: Poisson, Positive and Negative Binomial. We used the chi-square test of adhesion
to make adjustments to the theoretical frequency of distributions (Young and Young 1998).
RESULTS AND DISCUSSSION
oviposition ofA. argillacea
The first evaluation was conducted on January 10th,
2007, on both cultivars. This corresponds to the 28th DAE (days after emergence) of the Bt cultivar,
and the 15th DAE of the Cv cultivar. In this first
assessment, we only found eggs of A. argillacea in the Bt cultivar (Table I). (Fernandes et al. 2003) also recorded A. argillacea in Dourados from the 30th DAE until the end of the crop cycle.
The aggregation indices calculated, indicate that the values of the variance/mean ratio were greater than 1 in 15 of the evaluations, conducted in both cultivars (Table I). Thus, it is observed that the eggs of A. argillacea are laid both individually and in aggregates, in both the Bt and Cv cultivars. However, the average number of eggs found in the Bt cultivar was always very low. When this
happens, i.e. when the density of eggs in the field
is low, the rate of aggregation may be unreliable. Nevertheless, with the data obtained, it is observed that that eggs of A. argillacea have aggregate distribution in the field, because whenever the average was high enough to perform statistical
analyses, the values obtained confirmed this type
of spatial distribution. Based on the results of Morisita index, it is obvious that in all the tests, the values were also higher than the unit, allowing us
to confirm that the arrangement of the eggs on both
crops is aggregate.
Analyzing the K exponent, we found support for the hypothesis that the eggs on the conventional crop have aggregate distribution, because the K values varied between 0 and 7 (Table II). The same assessment of the Bt cotton field revealed
significantly lower K values, between 0 and 1.5,
Acad Bras Cienc
(2015)
87
(4)
2246
T
A
TIANA
R. RODRIGUES, MARCOS
G. FERNANDES, P
AULO E. DEGRANDE and
THIAGO A.
MOT
A
TABLE I
Statistical analysis (sample mean and variance) and dispersion indexes for Alabama argillacea and Heliothis virescens eggs on cotton crop DP90B™, Caarapó, MS, 2007.
28DAE 35DAE 42DAE 45DAE 49DAE 52DAE 59DAE 63DAE 73DAE 77DAE 80DAE 84DAE 88DAE 95DAE 102DAE
A. ar
gillacea
mˆ 0,43 0,72 0,30 1,27 0,54 0,40 0,49 0,56 0,43 0,28 0,30 0,50 0,91 0,69 0,46
s2
1,722 4,587 0,373 1,6536 1,160 0,565 1,363 1,360 0,752 0,466 1,020 0,818 2,244 1,266 0,937
I 4,0054**
6,3714**
1,2457**
1,3020**
2,1481**
1,4141**
2,7827**
2,4285**
1,7502**
1,6652**
3,4006**
1,6363**
2,4663**
1,8356**
0,9377**
Iδ 8,0841 **
8,4898**
1,8390**
1,2373**
3,1446**
2,0512**
4,6768**
3,5714**
2,7685**
3,4391**
9,1954**
2,2857**
2,6129**
2,2165**
3,2850**
K 0,1430 ag
0,1340 ag
1,2205 ag
4,2042 ag
0,4703 ag
0,9658 ag
0,2748 ag
0,3920 ag
0,5731 ag
0,4209 ag
0,1249 ag
0,7857 ag
0,6206 ag
0,8257 ag
0,4428 ag
H. vir
escens
mˆ 0 4,4 4,9 7,94 5,09 8,72 5,78 1,2 0,18 0,66 0,62 0,21 0,48 0,03 0,11
s2
- 18,2422 19,4040 19,3094 21,2342 26,1834 13,2036 3,5353 0,3915 1,3781 1,4096 0,3089 1,1612 0,0495 0,15949
I - 4,1460**
3,9600**
2,4319**
4,1717**
3,0026**
2,2843**
2,9461**
2,1750**
2,0881**
2,2737**
1,4713**
2,4191**
1,6531**
1,4499**
Id - 1,7094**
1,5992**
1,1787*
1,6181**
1,2276**
1,2203**
2,6190**
7,8431**
2,6573**
3,0671**
3,3333**
3,9893**
33,3333**
5,4545**
K - 1,3985 ag 1,6554 ag 5,5449 ag 1,6047 ag 4,3541ag 4,5002 ag 0,6166 ag 0,1531 ag 0,6065 ag 0,4867 ag 0,4455 ag 0,3382 ag 0,0459 ag 0,2444 ag
mˆ = sample mean of eggs per sampling unit; s2
= variance; I= variance/mean relationship; Id = Morisita index; K = K exponent; DAE = Days after plant emergence;
An
Acad Bras Cienc
(2015)
87
(4)
SP
A
TIAL
DISTRIBUTION OF PESTS
ON COTT
ON CROPS
2247
TABLE II
Statistical analysis (sample mean and variance) and dispersion indexes for Alabama argillacea and Heliothis virescens eggs on cotton crop DeltaOpal™, Caarapó, MS, 2007.
15 DAE 22 DAE 29 DAE 32DAE 36 DAE 46DAE 50 DAE 60 DAE 64 DAE 67 DAE 71 DAE 75 DAE 82 DAE 85DAE 89 DAE
A. ar
gillacea
mˆ 0 0,04 0,04 0,98 0,22 0,37 0,82 1,89 1,16 0,62 2,32 2,43 1,39 3,3 1,11
S 2
- 0,0589 0,0589 1,3329 0,4359 1,6293 1,442 3,3312 2,4791 0,945 3,5531 3,3182 1,9574 9,0404 2,2807
I - 1,4747**
1,4747**
1,3601**
1,9816 **
4,4037 **
1,7585**
1,7625**
2,1372**
1,5242**
1,5315**
1,3655**
1,4082**
2,7395**
2,0546**
Id - 16,6666**
16,6666**
1,3675**
5,6277**
10,3603**
1,9271**
1,4015**
1,9790**
1,8508**
1,2277**
1,1495**
1,2928**
1,5234**
1,9492**
K - 0,0842ag 0,0842ag 2,7212ag 0,2241ag 0,1087ag 1,0809ag 2,4785ag 1,0200ag 1,1825ag 4,3648ag 6,6475ag 3,4047ag 1,8970ag 1,0524ag
H. vir
escens
mˆ 0 1,99 2,04 4,35 2,69 1,01 1,87 0,53 0,71 0,48 0,9 0,1 0,25 0,09 0,11
s2
- 7,5857 7,5135 9,9267 16,66 4,2726 3,4475 1,0596 1,3392 0,9591 2,0101 0,1313 0,4722 0,5069 0,1998
I - 3,8119**
3,6831**
2,2820**
6,1934**
4,2303**
1,8436**
1,9994**
1,8863**
1,9983**
2,2334**
1,3131**
1,8888**
5,6329**
1,8172**
Id - 2,4059**
2,3085**
1,2924**
2,9184**
4,1980**
1,4490**
2,9027**
2,2535**
3,1028**
2,3720**
4,4444**
4,6666**
58,3333**
9,0909**
K - 0,7076 ag
0,7603 ag
3,3930ag
0,5179 ag
0,3126 ag
2,2166ag
0,5303ag
0,8010 ag
0,4808ag
0,7296 ag
0,3193 ag
0,2812 ag
0,0194 ag
0,1345 ag
mˆ = sample mean of eggs per sampling unit; s2
= variance; I= variance/mean relationship; Id = Morisita index; K = K exponent; DAE = Days after plant emergence; **=
An Acad Bras Cienc (2015) 87 (4)
The exponent K, when calculated for the Cv cultivar, was always above zero, indicating an aggregate disposition, corroborating the results of the Morisita index and the variance/mean ratio. However, in two instances the exponent K calculated for the Bt cultivar resulted in values above one. These data demonstrate that the distribution of the eggs on the Cv cotton is aggregate. By contrast, even though eggs are laid in aggregates on the Bt cotton, there is a tendency for a uniform distribution, as shown by the values near zero, absent in the calculations for the Cv cultivar.
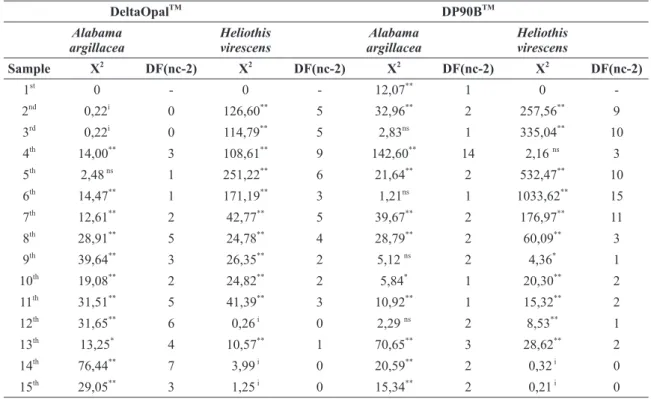
tHeoretiCal frequenCyoftHe distriButions
With one exception, the 5th sampling, the data pertaining to A. argillacea eggs on the Cv cotton
did not fit the Poisson distribution (Table III). In
addition, the first three samples did not achieve sufficient degrees of freedom for us to test their fit
to this type of distribution.
On the Bt cotton field, data on four of the
samplings fit the Poisson distribution. Among the samplings that did not, ten were significant at the
1% level probability using the chi-square. Data on only one sampling in each cultivar, the 13th Cv
sample and the 10th Bt sample resulted significant
at 5% probability.
The tests of the adjustment of the classes obtained for the eggs of A. argillacea fit the negative binomial distribution (Table IV) well: among the 15 assessments made, 12 of those for the Cv cotton, and all of those for the Bt cultivar had sufficient degrees of freedom for the chi-square test to be performed. Nine samples from the DeltaOpalTM cultivar and 11 samples from the DP90B® cultivar
TABLE III
Chi-square test to Alabama argillacea and Heliothis virescens eggs (Poisson) on cotton cultivars in Caarapó, MS, 2007.
DeltaOpalTM DP90BTM Alabama argillacea Heliothis virescens Alabama argillacea Heliothis virescens
Sample X2
DF(nc-2) X2
DF(nc-2) X2
DF(nc-2) X2
DF(nc-2) 1st
0 - 0 - 12,07**
1 0
-2nd
0,22i
0 126,60**
5 32,96**
2 257,56**
9 3rd
0,22i 0 114,79** 5 2,83ns 1 335,04** 10
4th
14,00**
3 108,61**
9 142,60**
14 2,16 ns
3 5th
2,48 ns
1 251,22**
6 21,64**
2 532,47**
10 6th
14,47**
1 171,19**
3 1,21ns
1 1033,62**
15
7th 12,61** 2 42,77** 5 39,67** 2 176,97** 11
8th
28,91**
5 24,78**
4 28,79**
2 60,09**
3 9th
39,64**
3 26,35**
2 5,12 ns
2 4,36*
1 10th
19,08**
2 24,82**
2 5,84*
1 20,30**
2
11th 31,51** 5 41,39** 3 10,92** 1 15,32** 2
12th
31,65**
6 0,26 i
0 2,29 ns
2 8,53**
1 13th
13,25*
4 10,57**
1 70,65**
3 28,62**
2 14th
76,44**
7 3,99 i
0 20,59**
2 0,32 i
0 15th
29,05**
3 1,25 i
0 15,34**
2 0,21 i
0 ns – non-significant at 5% probability, * - significant at 5% probability, ** - significant at 1% probability, i = insufficient
An Acad Bras Cienc (2015) 87 (4)
SPATIAL DISTRIBUTION OF PESTS ON COTTON CROPS 2249
fit the negative binomial distribution. As the values of the chi-square of most samples were not
significant for the negative binomial distribution,
the spatial distribution found for the eggs of A. argillacea is aggregate.
The chi-square test of adherence to the positive binomial distribution (Table V) showed that adults of this noctuid do not have any tendency to lay eggs
in a manner that fits such distribution: of the 15
samples taken from the Cv and Bt varieties, none
fit this distribution.
The same spatial distribution patterns of posture described in this paper showed that A. argillacea female, does not distinguish between Bt cotton and non-Bt, due to the proposed differentiation in volatiles produced by plants (Yan et al. 2004). As reported in a previous study Lima and Torres (2011)
the female of A. argilacea presents no preference in laying eggs on Bt and non-Bt cotton.
ovipositionofH. virescens
The first evaluation of the Bt and Cv crops (Table I)
did not indicate the presence of eggs of H. virescens
in the sampled area, which were first found only in
the second evaluation. The greatest amount of eggs was found from the 2nd to the 7th samplings in both cultivars. In this context, the higher incidence of
postures during the first assessments was mainly due
to favorable conditions of the host plant during that
period. This finding confirms the results obtained
by Fernandes et al. (2007) who showed that moths of H. virescens prefer to lay eggs on the upper third part of the plant, where plant structures are newer and are more appropriate to the younger larvae.
TABLE IV
Chi-square test to Alabama argillacea and Heliothis virescens eggs (Negative Binomial) on cotton cultivars in Caarapó, MS, 2007.
DeltaOpalTM DP90BTM Alabama argillacea Heliothis virescens Alabama argillacea Heliothis Virescens
Sample X2
DF(nc-3) X2
DF(nc-3) X2
DF(nc-3) X2
DF(nc-3) 1st
0 - 0 - 2,75 ns
3 0
-2nd
0 - 5,69 ns
7 6,14 ns
4 10,90 ns
12 3rd
0 - 6,28 ns
8 0,36 i
0 13,20 ns
13 4th
4,40 ns
2 21,97**
9 142,59**
15 2,157 ns
3 5th
2,06 ns
1 9,17 ns
10 0,94 ns
2 15,33 ns
13 6th
1,20 ns
2 33,42**
5 1,04 ns
1 39,29 **
18
7th 7,27* 2 9,92** 5 1,42 ns 3 18,17 ns 13
8th
8,32 ns
5 2,87 ns
2 8,63*
2 7,37 ns
6 9th
5,94 ns
4 8,64*
2 1,91 ns
1 0,41 ns
1 10th
4,72 ns
2 2,06 ns
2 0,10 ns
1 3,08 ns
3
11th 11,76* 5 4,71 ns 4 0,48 ns 3 4,23 ns 3
12th
22,27**
5 0,88 i
0 2,29 ns
1 8,52 ns
0 13th
6,59 ns
3 7,54**
1 11,09*
3 6,34*
2 14th
8,87 ns
9 0 - 3,74 ns
2 0
-15th
5,31 ns
3 1,12 0 4,24 ns
2 0,02 i
-ns – non-significant at 5% probability, * - significant at 5% probability, ** - significant at 1% probability, i = insufficient
An Acad Bras Cienc (2015) 87 (4)
The aggregation indexes for eggs of H. virescens indicate that the values variance/mean were greater than 1 in all 14 evaluations, and the means differing from zero for both the Cv and the Bt varieties (Table I), in view of the probability of 99% accuracy. However, it appears that, from the 9th assessment on, very low means were observed, resulting in unreliable conclusions about the levels of aggregation.
The Morisita index and the chi-square values for the randomness were also greater than 1,
allowing us to confirm the aggregate distribution
of this pest in both cultivars. The 4th sampling carried out in the Bt cultivar and the 12th sampling
carried out in the Cv cultivar were exceptions, with
a 95% confidence level. Thus, we expect a greater
probability of adjusting the frequencies found in
the field to the existing theoretical distributions
for this type of spatial arrangement, not discarding
the possibility of obtaining a fit to non-aggregated
distributions, since some samples resulted in very low averages. It should be noted that these results conform to those observed for the variance/mean ratio.
The values of the exponent K were between 0.0459 and 4.5002 (Table I) in all evaluations of the transgenic crop, indicating an aggregate distribution among-plants for the eggs of this insect. The eggs of this pest also tended to be aggregate on the Cv cultivar, with K values between 0.0194 and 3.3930 (Table I), but as most values were close to zero, there is a slight tendency to a uniform distribution.
Of the 15 total evaluations, 11 and 12 on the Cv and Bt cultivars, respectively, had sufficient number of classes for the Poisson distributions to be adjusted by Chi-square test (Table III). However, TABLE V
Chi-square test to Alabama argillacea and Heliothis virescens eggs (Positive Binomial) on cotton cultivars in Caarapó, MS, 2007.
DeltaOpalTM
DP90BTM
Alabama argillacea
Heliothis virescens
Alabama argillacea
Heliothis virescens
Sample X2
DF(nc-3) X2
DF(nc-3) X2
DF(nc-3) X2
DF(nc-3)
1st 0 - 0 - 0,36 - 0
-2nd
241,16 i
0 9,61 - 0,36 - 32,49
-3rd
241,16 i
0 10,24 - 18,16 i
0 38,44
-4th
4,8333 i
0 44,68 - 79,28 - 23,11 i
0 5th
113,91 - 14,44 - 2214,21 - 42,25
-6th
0,16 i
0 2,89 - 63,77 i
0 86,49
-7th
457,73 i
0 384,52 i
0 17,38 - 74,94
-8th
73,02 i
0 0,01 - 215,04 - 39,32
-9th
1275,23 - 3195,80 i
0 773,58 - 2429,47
-10th
102,54 i
0 0,36 - 493,56 - 0,49
-11th
22,05 i
0 512,96 - 0,09 - 519,10
-12th 52,84 i 0 80,65 i 0 286,56 - 167,86 i 0
13th
7,63 i
0 5764,40 i
0 126,98 - 236,49
-14th
30,72 i
0 0,01 - 1442,92 i
0 698,57 i
0
15th 2,56 - 2492,69 i 0 0,09 - 176,99 i 0
ns – non-significant at 5% probability, * - significant at 5% probability, ** - significant at 1% probability, i = insufficient
An Acad Bras Cienc (2015) 87 (4)
SPATIAL DISTRIBUTION OF PESTS ON COTTON CROPS 2251
almost all assessments resulted in no adjustment, except for the 4th sampling of the Bt cultivar. This result, however, may be considered unreliable, because the average number of eggs found on the plants examined was very low. It should also be noted that, as in all other assessments, there was no adjustment to the Poisson distribution, proving that the oviposition of H. virescens is not random on either variety of cotton.
The adjustment tests to the negative binomial distribution (Table IV) show that the distribution
of eggs fit to this type of distribution very well, as most samples taken, showed sufficient number
of classes for the test to be adjusted: 11 samplings from the cultivar DeltaOpalTM, and 12 samplings from the cultivar DP90BTM. Of those samples, six from the Cv cultivar and 10 from the transgenic cultivar obtained to this distribution.
There were no sufficient degrees of freedom
to adjust to the positive binomial distribution, in any of the samples taken (Table V). Therefore, it was not possible to perform the chi-square test to this pattern of distribution, thus showing that the eggs of this noctuid do not have any tendency for a uniform distribution. Thus, the spatial distribution of eggs of H. virescens was found to be aggregated for both crop varieties. The observed and expected frequencies for the number of eggs in both cultivars only conformed to the negative binomial distribution. Torres and Ruberson (2006) also compared the oviposition behavior of H. virescens between Bt and non-Bt cotton in a commercial
area and concluded that there was no significant
difference among cultivars with respect to the temporal distribution of eggs.
Given these observations, the spatial distribution of eggs of A. argillacea and H. virescens was found to be aggregated in both cultivars, in agreement with Maruyama et al. (2002), who stated that the distribution of insects
in the field, in general, tends to be aggregate. The
observed and expected frequencies for the number
of eggs of A. argillacea and H. virescens fit the negative binomial distribution in the vast majority of samples taken.
According to these observations, one can conclude that the spatial distribution of the eggs of A. argillacea on the Bt the cultivar follows the pattern of an aggregate distribution tending to a uniform distribution, being aggregated on the Cv cotton. The spatial distribution of the eggs of H. virescens, on the other hand, is aggregate on both crops. This type of distribution requires a larger number of sampling units than any spatial distribution when accessing the distribution of the eggs of this species. This assessment can be very important, since, according to Pray et al. (2002), H. virescens is becoming resistant to Bollgard I technology in China. Thus, we suggest that future studies develop sequential sampling plans for eggs of these species in Cv cotton.
It should also be noted that the Bt cultivar did not have a major impact on the spatial distribution of the eggs of H. virescens and A. argillacea, since the same distribution pattern was observed on both cotton varieties. This indicates that transgenic plants do not alter the characteristic oviposition pattern of these insects, which are the target pests of the Bt technology.
Thus, we recommend the application of insecticides that have ovicidal action, whenever necessary, in localized areas of a culture. This decreases the amount of pesticides sprayed in the environment, reducing the risk of human poisoning, and enables the development of natural enemies of pests. In this sense, Metcalf (1980) stated that it is important to provide refuges for the survival of
populations of beneficial insects in agro-ecosystems
An Acad Bras Cienc (2015) 87 (4)
Citrus orchards, that have improved due to spraying on alternate lanes, every six months, and spraying on stretches of streets lanes, thus providing refuges for natural enemies.
In conclusion, we did not observe changes in the spatial distribution of posture A. argillacea and H. virescens in two tested cotton cultivars (Bt and non-Bt). Thus, suggest the development of a sequential sampling plan calculated starting from model aggregated spatial distribution (negative binomial), and therefore monitoring for decision making for pest control in question, does not discriminate cotton cultivars, which implies saving time.
ACKNOWLEDGMENTS
We thank Coordenação de Aperfeiçoamento Pessoal de Nível Superior (CAPES) for the
Master’s scholarship granted to the first author.
RESUMO
Dentre as opções para o controle de lagartas de Alabama argillacea (Hubner, 1818) e Heliothis virescens (Fabricius, 1781) na cultura algodoeira, aplicações de inseticidas e o controle biológico têm sido amplamente usados. O algodão transgênico ‘Bt’ tem se inserido como uma alternativa extremamente viável, porem não se sabe com exatidão como as plantas transgênicas afetam as populações de organismos que se inter-relacionam em um agroecossistema. Nesse sentido, é importante saber como a disposição espacial de insetos pragas ou benéficos é afetada, pois pode alterar o método de amostragem dessas espécies na cultura, além de sua forma de controle. Este estudo foi conduzido buscando investigar o padrão da distribuição espacial de ovos de A. argillacea e de H. virescens em cultivar DeltaOpalR (convencional) e DP90BR (algodão-Bt). A coleta dos dados ocorreu durante o ano agrícola 2006/2007 em duas áreas de 5.000 m2
localizada na região do distrito de Nova América, município de Caarapó. Em cada área amostral, composta por 100 parcelas de 50 m2, foram realizadas 15 avaliações com contagens dos ovos das pragas em analise, em duas plantas por parcela. Os
índices de agregação (razão variância/media, índice de Morisita e Expoente k da Distribuição Binomial Negativa) e o teste de qui-quadrado, com o ajuste dos valores encontrados e esperados as distribuições teóricas de frequência (Poisson, Binomial Negativa e Binomial Positiva), mostraram que em ambas cultivares a distribuição espacial de posturas dessas espécies estão distribuídas de acordo com o modelo de distribuição espacial agregada, ajustando-se ao padrão da distribuição binomial negativa.
Palavras-chave: Curuquerê-do-algodoeiro, Gossypium hirsutum, Lagarta-das-macas, OGM.
REFERENCES
Baker GH, tann Cr and fitt Gp. 2008. Production of
Helicoverpa spp. (Lepidoptera, Noctuidae) from different refuge crops to accompany transgenic cotton plantings in eastern Australia. Aust J Agr Res 59: 723-732.
BarBosa JC. 1992. Métodos estatísticos aplicados à entomologia. Jaboticabal Funep, 254 p.
Brookes G and Barfoot p. 2007. Global Impact of Biotech Crops: Socio-Economic and Environmental Effects in the First Ten Years of Commercial Use. AgBioForum 9: 139-151.
elliot Jm. 1977. Some methods for the statistical analysis of samples of benthic invertebrates. Freshwater Biological Association, 159 p.
fernandes mG, Busoli aC and BarBosa JC. 2003. Spatial distribution of Alabama argillacea (Hübner) (Lepidoptera: Noctuidae) on cotton crop. Neotrop Entomol 32: 107-115.
fernandes mG, moreiraMAS, deGrande pe, CuBas aC and silva am. 2007. Vertical distribution, population density, and natural egg parasitism of cotton leafworm on cotton under IPM. Rev Colomb Entomol 33: 27-30. fitt Gp. 2008. Have Bt Crops Led to Changes in Insecticide
Use Patterns and Impacted IPM. In: Romeis AMSJ and Kennedy GG (Eds), Integration of Insect-Resistant Genetically Modified Crops Within IPM Programs, 5th
ed., Dordrecht, Netherlands, Springer, p. 441.
Glare tr and o’CallaGHan m. 2000. Bacillus thuringiensis: Biology, Ecology and Safety: Chichester, UK, 350 p.
James C. 2013. Global Status of Commercialized Biotech/ GM Crops: 2013: Ithaca, NY, ISAAA Brief.
limaMSDand torres JB. 2011. Cry1Ac toxin production and feeding and oviposition preference of Alabama argillacea in Bt cotton under water stress. Pesqui Agropecu Bras 46: 451-457.
maruyama wi, BarBosa JC, fernandes mG and yamamoto pt. 2002. Distribuição espacial de
An Acad Bras Cienc (2015) 87 (4)
SPATIAL DISTRIBUTION OF PESTS ON COTTON CROPS 2253
em citros na região de Taquaritinga, SP. Neotrop Entomol 31: 35-40.
metCalf rl. 1980. Changing role of insecticides in crop protection. Annu Rev Entomol 25: 219-256.
morisita m. 1962. I σ-Index, a measure of dispersion of individuals. Res Population Ecol 4: 1-7.
peres AJA, tomquelski Gv, papa G, vilela r and martinsGLM. 2012. Occurrence of pests on genetically modified (Bt) and conventional cotton. Revista Brasileira de Ciências Agrárias 7: 810-813.
pray Ce, HuanG J, Hu r and rozelle s. 2002. Five years of Bt cotton in China – the benefits continue. Plant J 31: 423-430.
qaim m and zilBerman d. 2003. Yield Effects of genetically modified crops in developing countries. Science 299: 900-902.
raBinoviCH Je. 1980. Introducción a la ecología de poblaciones animales. Mexico, Compañía Editorial Continental, 313 p.
riCklefs re. 2003. A economia da natureza. Rio de Janeiro, Guanabara/Kogan, 470 p.
romeis J, meissle m and BiGler f. 2006. Transgenic crops expressing Bacillus thuringiensis toxins and biological control. Nature Biotechnology 24: 63-71.
ruesink wG. 1980. Introduction to sampling theory. In: Kogan M and Herzog DG (Eds), Sampling methods in soybean entomology. New York, Springer, p. 61-78. sHelton am, zHao Jz and rousH rt. 2002. Economic,
ecological, food safety, and social consequences of the deployment of Bt transgenic plants. Annu Rev Entomol 47: 845-881.
silveira neto s, nakano o, Bardin d and novaNAV. 1976. Manual de ecologia dos insetos, Editora Agronômica Ceres. 419p.
soutHwood r. 1966. Ecological methods, with particular reference to the study of insect populations, Methuen. taylor lr. 1984. Assessing and Interpreting the Spatial
Distributions of Insect Populations. Annu Rev Entomol 29: 321-357.
torres J and ruBerson J. 2006. Spatial and temporal dynamics of oviposition behavior of bollworm and three of its predators in Bt and non-Bt cotton fields. Entomol Exp Appl 120: 11-22.
yan f, BenGtsson m, anderson p, anseBo l, xu C and witzGall p. 2004. Antennal response of cotton bollworm (Helicoverpa armigera) to volatiles in transgenic Bt cotton. J Appl Entomol 128: 354-357.