BEHAVIOUR OF DISPERSION INDICES IN PATTERN
DETECTION OF A POPULATION OF ANGICO,
Anadenanthera peregrina
(LEGUMINOSAE)
MALHADO, A. C. M. and PETRERE Jr., M.
Departamento de Ecologia, UNESP, C.P. 199, CEP 13506-900, Rio Claro, SP, Brazil
Correspondence to: Miguel Petrere Júnior, Departamento de Ecologia, UNESP, C.P. 199, CEP 13506-900, Rio Claro, SP, Brazil, e-mail: mpetrere@rc.unesp.br
Received August 27, 2002 Accepted February 17, 2003 Distributed May 31, 2004 (With 8 figures)
ABSTRACT
In this paper we calculate the values of eight pattern detection indices, using different quadrat sizes where individuals of angico above 1.5 m were located, in order to examine their statistical behaviour with increasing sample size. It was concluded that the best index is the standardized Morisita index (Ip) which is completely independent of sample size.
Key words: spatial pattern, aggregation, angico, Anadenanthera peregrina.
RESUMO
Padrão de agregação do Angico Anadenanthera peregrina
Neste trabalho calculamos os valores de oito índices de detecção de padrões, usando quadratins de tamanhos diferentes, onde indivíduos de angico com mais de 1,5 m estavam localizados, a fim de examinar seus comportamentos estatísticos com o aumento do tamanho da amostra. Conclui-se que o melhor índice é de Morisita padronizado (Ip), o qual é independente do tamanho da amostra.
Palavras-chave: padrão espacial, agregação, angico, Anadenanthera peregrina.
INTRODUCTION
In ecological or population studies, the pattern is defined by Ludwig (1979 circa Rossi & Higuchi, 1998) as a quantitative description of the horizontal distribution of individuals of a species within a community. This has been widely studied by comparing communities and ecosystems, as a means of providing a mechanism to foresee the functional state of the system.
The pattern of plants and animals is a funda-mental characteristic of a population. The patterns exhibited by a population living in a given geographic area can be of three basic types: random, clumped, or uniform (Pielou, 1977; Southwood, 1978; Elliot, 1979; Matteucci & Colma, 1982; Odum, 1986; Krebs, 1989, 1999; Carvalho, 1992; Buschini, 1999; Petrere, 1985).
According to Pielou (1977), Odum (1986), and Krebs (1999), the clumped type is the most commonly observed pattern. The main reasons that can lead to a clumped pattern in a population are the characteristics of the species, the relationship between them, and with the environmentally variations (Kershaw, 1973; Matteucci & Colma, 1982; Meirelles & Barreto Luiz, 1995; Soviano, 1997). Krebs (1999) pointed out that the most important part of the pattern is the ecology behind it, i.e., the causal mechanisms and the factors that promote and maintain it.
Meirelles & Barreto Luiz (1995), working with 18 tree species in the cerrado (savannah-like vege-tation) of the Experimental Ecological Farm of the University of Brasília, obtained 16 species with a clumped pattern and only two populations with a random pattern. This result corroborates the suggestion that the clumped pattern is most often observed. However, the work of Rossi & Higuchi (1998) failed to support this theory; these authors observed that, within a total of 8 species studied in the Amazonian Rain Forest, two species showed a clumped pattern, while the others showed a predominantly random pattern.
Among the applications of pattern analysis stand its use in forestry surveys, which sets the base for gathering information for forest management. Also worth mentioning is its application in mana-gement systems based on natural regeneration, in planning mechanized exploitation, and in imple-mentation forestry methods, as well as in defining the size of an area selected for conservation purposes (Rossi & Higuchi, 1998). Krebs (1999) further noted that pattern analysis could also allow the exact choice of methods to estimate population density. This point was also made by Odum (1986), who stated that pattern analysis is important for selection of sampling procedures for ecological studies.
Nowadays, there is a proliferation of quan-titative tools and acceptance about their use in formulating and solving ecological problems. Within this context, the aim of the present work is to observe the behaviour of statistical indices for the pattern detection of a tree species, the angico Anadenanthera peregrina, in a population from Rio Claro (SP).
MATERIAL AND METHODS
This study was carried out in a secondary forest located in the Horto Municipal Navarro de Andrade, Municipality of Rio Claro, São Paulo State, Brazil. The study species, Anadenanthera peregrina, com-monly known as angico, vermelho, angico-do-morro, angico branco, paricá, ricá-de-curtume, and paricá de terra-firme, is a pioneer species of the family Leguminosae (Lorenzi, 1998). This species has a wide geographical distribution, occur-ring in semideciduous forests and in the transition to cerrado vegetation, in the states of Tocantins, Goiás, Bahia, Minas Gerais, Rio de Janeiro, São Paulo, Mato Grosso, and Mato Grosso do Sul (Lorenzi, 1998).
Albeit frequently used and cited, the sampling method used here has the disadvantage inconvenien of using arbitrary sampling units. It is worth noting that different quadrat sizes should be considered when using this method. In the case of a species with a clumped pattern for example, the quadrat size that will detect it is affected by the size of the group of individuals. Thus, it is imperative to use different quadrat sizes to detect clumped patterns (Kershaw, 1973); Matteucci & Colmas, 1982; Meirelles & Barreto Luiz, 1995; Krebs, 1999).
Initially we determined, in an area of 9600 m2
(120 m x 80 m), all the spatial coordinates (x,y) of individuals of Anadenanthera peregrina higher than 1.5 m. Measurements were carried out with the aid of a tape placed on the lateral boundaries of the study area. Quadrats of different sizes (1 x 1 m, 2 x 2 m, 4 x 4 m, 5 x 5 m, 10 x 10 m, 20 x 20 m, and 40 x
40 m) were considered in order to evaluate the effects of the size by analyzing the pattern variations among them. Afterwards, dispersion indices were used to observe valve behaviour with respect to the pattern diagnosis.
The indices used were: the variance-to-mean ratio (I), Morisita's dispersion index (Ιδ), standardized Morista index (Ip), 1/k index (inverse of the negative binomial parameter), and four other indices based on the variance-to-mean ratio: David & Moore index, Lexis index, the coefficient of Charlier, and the coefficient of Green. All the formulas, calculations, and statistical tests of goodness of fit were based on Krebs (1989, 1999) and Elliot (1979).
RESULTS
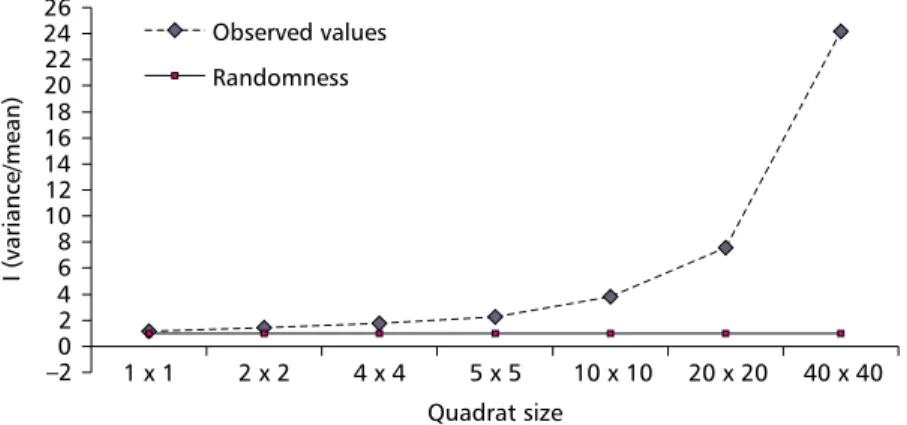
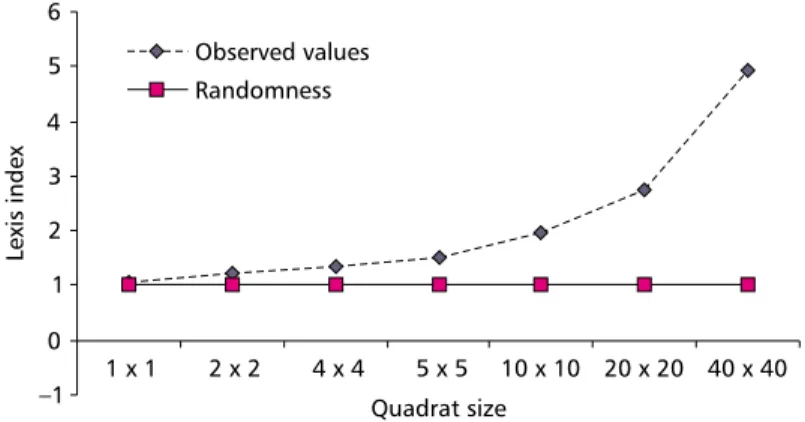
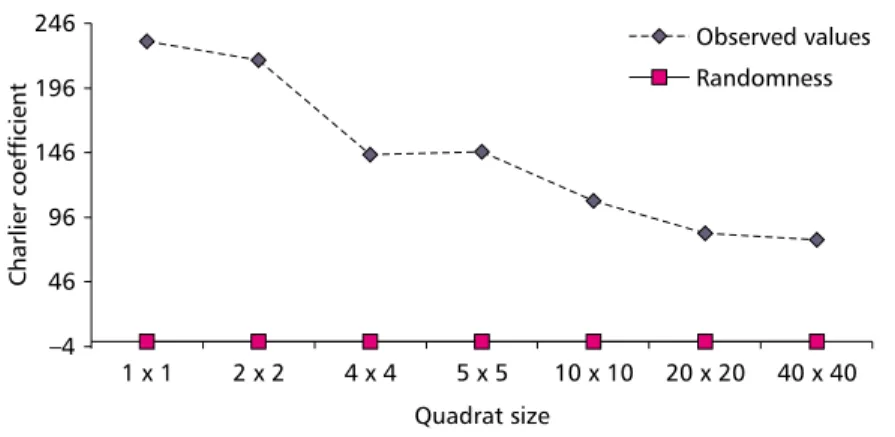
The behaviour of the values found for each of the dispersion indices, as well as for deviations from the random pattern, can be seen in Figs. 1-8. The curves for the indices of the variance-to-mean ratio (Fig. 1), the David & Moore index (Fig. 5), and that of Lewis (Fig. 6) increased with quadrat size increase, indicating a tendency for higher levels of clumping, since the values were different from those expected for randomness. On the other hand, the indices of Morisita (Fig. 2), 1/k (Fig. 4), and the Charlier coefficient (Fig. 7) showed descendent curves, following the same tendency towards an increase in the quadrat size. The only curve that did not demonstrate marked differences in behaviour was the standardized Morisita (Fig. 3) which showed a curve paralleling the curve describing the random pattern, suggesting independence of quadrat size. The Green coefficient (Fig. 8) started to increase slightly after the 20 x 20 m quadrat.
DISCUSSION
The present work corroborated Pielou (1977), Odum (1986), and Krebs (1999) who observed that the clumped pattern is the most often detected in natural populations; in this work, such a pattern was observed by analyzing the indices of the variance-to-mean ratio, the Morisita, and standardized Morisita, all of them with good fit.
The 1/k, David & Moore, and Lexis indices, and the coefficients of Green and Charlier do not have known variance, which precludes calculating their significance limits. This fact hampered the use of statistical tests to detect random patterns, thus restricting their utility for pattern determination anchored in hypothesis tests. Probably, this disadvantage is responsible for the low use of these indices for pattern detecting. Krebs (1999) stated that the Green index is the best, as it is independent of population density and sample size, although evidence was shown here of a slight increase with quadrat size. The great disadvantage it presents is that its exact variance is unknown.
Although we cannot test the significance of the values of the David & Moore, Lexis, 1/k, Charlier and Green indices, they all showed a tendency towards randomness for our data.
The indices based on the variance-to-mean ratio have the drawback of being strongly dependent on the sampling unit size (Rossi & Higuchi, 1998); the previously cited authors also emphasize that this
criticism can be applied to the majority of indices that are obtained based on sampling units with a defined area. This property become advantageous, however, if the objective is to observe enhancement of the different scales at which a given pattern can occur. In our work, indices derived from the variance-to-mean ratio enhanced the level of clumping angico population.
Among all the indices for pattern detection currently available, the most often used, is the Morisita index (Ιδ) to judge by the work of Oliveira
et al. (1989), Meirelles & Barreto Luiz (1995), Bergamin (1998), Leitão (1998), And Rossi & Higuci (1998). Rossi & Higuchi (1998) stated that the main reason for its use is that this index is less affected by the sampling unit size. These authors further suggested that the most adequate indices for pattern analysis are the Morisita (Ιδ) and the variance-to-mean ratio; Myers (1978) shared the same opinion about the last index.
The behaviour of the indices as a function of quadrat size variation allowed the description of three different curves (increasing, decreasing, and parallel), which endorsed the variety of mathematical calcu-lations seeking to delineate a given pattern. Pielou (1977) further stressed that each index is only a simple statistical analysis and, thus, can only describe a simple aspect of another complex pattern.
Fig. 1 Variation in the values obtained with the application of the variance-to-mean ratio index as a function of the
differ-ences in quadrat size (m) and deviation from the expected curve for randomness.
Fig. 2 Variation in the values obtained with the application of the Morisita index (Ιδ) as a function of the differences in quadrat size (m) size and deviation from the expected curve for randomness.
Fig. 3 Variation in the values obtained with the application of the standardized Morisita index (Ip) as a function of the dif-ferences in quadrat size (m) size and deviation from the expected curve for randomness.
–2 0 2 4 6 8 10 12 14 16 18 20 22 24 26
1 x 1 2x2 4x4 5x5 10x10 20x20 40x40 Quadrat size
I
(variance/mean)
Observed values
Randomness
0 1 2 3 4 5 6 7
1x1 2x2 4x4 5x5 10x10 20x20 40x40 Quadrat size
I
Observed values Randomness
–2 –1.5 –1 –0.5 0 0.5 1 1.5 2
1 1x 2 2x 4 4x 5 5x 10 10x 20 20x 40 40x
Quadrat size
Ip
Observed values
Fig. 5 Variation in the values obtained with the application of the David & Moore index as a function of the differences in quadrat size (m) size and deviation from the expected curve for randomness.
–5 0 5 10 15 20 25
1x1 2x2 4x4 5x5 10x10 20x20 40x40
Quadrat size
David
&
Moore
index
Observed values
Randomness
Fig. 6 Variation in the values obtained with the application of the Lexis index as a function of the differences in quadrat size (m) size and deviation from the expected curve for randomness.
–1 0 1 2 3 4 5 6
1x1 2x2 4x4 5x5 10x10 20x20 40x40 Quadrat size
Lexis
index
Observed values Randomness
Fig. 4 Variation in the values obtained with the application of the 1/k index of the binomial negative as a function of the differences in quadrat size (m) size and deviation from the expected curve for randomness.
–2 0 2 4 6 8
1x1 2x2 4x4 5x5 10x10 20x20 40x40
Quadrat size
1/k
Observed values
Fig. 8 Variation in the values obtained with the application of the Green coefficient as a function of the differences in quadrat size (m) size and deviation from the expected curve for randomness.
–0.3 –0.15 0 0.15 0.3 0.45 0.6 0.75 0.9
1x1 2x2 4x4 5x5 10x10 20x20 40x40 Quadrat size
Green
coefficient
Observed values
Randomness
Fig. 7 Variation in the values obtained with the application of the Charlier coefficient as a function of the differences in quadrat size (m) size and deviation from the expected curve for randomness.
–4 46 96 146 196 246
1x1 2x2 4x4 5x5 10x10 20x20 40x40
Quadrat size
Charlier
coefficient
Observed values
Randomness
It is worth noting that this species is singu-lar in that it showed a clumped pattern irrespective of quadrat size, a fact which we related to through the replication of the behaviours previously described the detection of a clumped pattern.
It is important to point out that these indices have limitations and criticism exist as to their use, which can be observed in the simulation works of Myers (1978), Hurlbert (1990), and Perry (1995). Finally, we must emphasize that our results can hardly be generalized to a wider geographical area, as the data are based on a secondary forest where succession took place in a particular site.
Acknowledgments We thank Dra. Leila Cunha, from the Department of Ecology of UNESP, for her criticisms; and FAPESP, for a Scientific Initiation Scholarship ACMM (Processo IC 00/00505-5); and UNESP and CNPq for financial support.
REFERENCES
BERGAMIN, M., 1998, Aspectos reprodutivos e distribuição de duas espécies de Byrsonima (Malpighiaceae) em área de cerradão na Reserva Biológica de Mogi-Guaçu, SP.
Master's Dissertation, Instituto de Biociências, UNESP, Rio Claro, SP, Brazil.
BUSCHINI, M. L. T., 1999, Spatial distribution of nests of
Nasutitermes sp. (Isoptera: Termitidade) in a cerrado area in southeastern Brasil. Environ. Entomol.,28(4): 618-621 CARVALHO, M. B., 1992, Distribuição espacial do caranguejo de rocha Pachygrapsus transversus (Gibbes, 1850) (CRUSTACEA, BRACHYURA, GRAPSIDAE), Praia da Costa, Município de Ubatuba, SP. BSc Dissertation, Instituto de Biociências, UNESP, Rio Claro, SP, Brazil.
ELLIOT, J. M., 1979, Some Methods for the Statistical Analysis of Samples of Benthic Invertebrates. 2nd ed., Freshwater Biological Association Scientific Publication: 25. HURLBERT, S. H., 1990, Spatial distribution of the montane
KERSHAW, K. A., 1973, Quantitative and dynamic plant ecology. Edward Arnold, London, UK.
KREBS, C. J., 1989, Ecological methodology. Harper & Row, NY, USA.
KREBS, C. J., 1999, Ecological methodology. 2nd. ed., A. Wesley Longman, NY, USA.
LEITÃO, A. C., 1998, Nutrição mineral, fenologia e distribuição espacial da população de Ouratea spectabilis (Mart.) Engl., em áreas de cerrado na Reserva Biológica de Mogi-Guaçu, SP. Master's Dissertation, UNESP, Rio Claro, SP, Brazil. LORENZI, H., 1998, Árvores brasileiras: manual de identificação e cultivo de plantas arbóreas nativas do Brasil. Vol. 2. Plantarum, Nova Odessa, SP.
LUDWIG, J. A., 1979, A test of different quadrat variance methods for the analysis of spatial pattern. In: R. M. Cormack & J. K. Ord (eds.), Spatial and temporal analysis in ecology. International Cooperative Publishers, Fairland, pp. 284-304. MALHADO, A. C. M., 2000, Estudo do padrão espacial do angico Andenanthera peregrina, no Horto Florestal "Navarro de Andrade". BSc Dissertation, Instituto de Biociências, UNESP, Rio Claro, SP, Brazil.
MATTEUCCI, S. D. & COLMA, A., 1982, Metodología para el estudio de la vegetación. OEA, DC.
MEIRELLES, M. L. & BARRETO LUIZ, A. F., 1995. Padrões espaciais de árvores de um cerrado em Brasília, DF. Revista Brasileira de Botânica, 18: 185-189.
MYERS, J. H., 1978. Selecting a measure of dispersion. Environment Entomology, 7: 619-621.
ODUM, E. P., 1986. Ecologia. Guanabara Koogan, Rio de Janeiro, RJ, Brazil.
OLIVEIRA, P. E. A. M., RIBEIRO, J. F. & GONZALES, M. I., 1989, Estrutura e distribuição espacial de uma população de Kielmeyera coriacea Mart. de cerrados de Brasília. Revista Brasileira de Botânica, 12: 39-47.
PERRY, J. U. N., 1995, Spatial analysis by distance indices.
Journal of Animal Ecology, 64: 303-314.
PETRERE, M. Jr., 1985, The variance of the index (R) of aggregation of Clark and Evans. Oecologia,68: 158-159. PIELOU, E. C., 1977, Mathematical ecology. 2nd. Wiley, NY. ROSSI, L. M. B. & HIGUCHI, N., 1998, Aplicação de métodos de análise do padrão espacial em oito espécies arbóreas da floresta tropical úmida. In: Floresta Amazônica: dinâmica, regeneração e manejo. C. Gascon & P. Moutinho (eds.), CNPq/INPA, Manaus, AM, Brazil, pp. 41-60.
SOUTHWOOD, T. R. E., 1978, Ecological methods. 2nd. ed. Chapman & Hall, London, UK.
SOVIANO, A. J. S., 1997, Distribuição espacial e temporal de invertebrados bentônicos da Represa de Barra Bonita-SP. MSc. Dissertation, USP, São Carlos, SP, Brazil. VANDERMEER, J., 1981, Elementary mathematical ecology.