(Annals of the Brazilian Academy of Sciences) ISSN 0001-3765
www.scielo.br/aabc
Methodological development of a quality index for agricultural operations,
for corn cultivation using multi-criterion analysis
RUBENS A.C. LAMPARELLI1 and HUGO S. DIAS2
1Centro de Pesquisas Meteorológicas e Climáticas Aplicadas à Agricultura, UNICAMP
Cidade Universitária Zeferino Vaz s/n, Barão Geraldo, 13083-970 Campinas, SP, Brasil
2Laboratório de Geoprocessamento, Faculdade de Engenharia Agrícola
Caixa Postal 6011, 13083-875 Campinas, SP, Brasil
Manuscript received on July 7, 2008; accepted for publication on March 3, 2009; presented byELIBIOL. RECH
ABSTRACT
One of the major problems in the Brazilian agriculture is related to the production loss in the field, which, due to many factors, is not being considered. This article has the objective to develop a methodology to identify a quality index which integrates some crop quality variables which are able to indicate how the crop is developing in terms of loss in the field. The results have showed that the strategy of multi-criterion analysis and Fuzzy logic proved to be important tools for the assessment and preparation of a quality index for corn production. The index proposed performed well in representing the quality of agricultural operations when compared with reality.
Key words:annual crop, optimization, fuzzy, crop quality.
INTRODUCTION
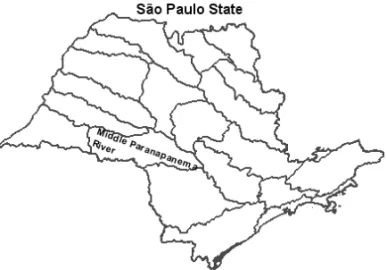
The winter corn began to be planted in the State of Paraná in the mid-1980. With the end of the govern-ment’s policy of subsidizing the production of wheat, a vertiginous growth of the area of the winter corn cul-tivation starts in the Center-South of Brazil, with the Middle-Paranapanema in the State of São Paulo stand-ing out due to the improvement of technology applied to this crop (CONAB 2007).
In spite of recent gains, the difference between the productivity of experimental trials and that of commer-cial crops is enormous, and is linked to the lacking use of technology by farmers, the key factor to explain such different ways in the quality with which the operations are carried out. The distribution of the plants along the line of planting, the crop mulch being kept on the soil, the density of the plants, the infestation of weeds
Correspondence to: Rubens Augusto Camargo Lamparelli E-mail: [email protected]
and the loss of crops are just some of the factors that have determined the difference between sowing in ex-periments and that of farmers. (IEA 2002). De Maria et al. (1999) have shown that 60% of the crops of winter corn, in the middle-Paranapanema, had some problem of soil compacting probably due to preparation without ideal conditions of dampness, while 8% of the used land was unsuitable for the crop given to its low contents of phosphorus and low saturation by bases.
A brief review of international literature relates agriculture to the quality of the water (Honisch et al. 2002, Benson et al. 2006), the soil (Andrews and Car-roll 2001, Gruhn et al. 2000) and the environment (Biggs et al. 2007), but not exactly to those factors linked to farming operations.
and Fernandes 2002). Measurements of central trends in the control of a production process, such as means, are fundamental in quality control, but not enough for their proper characterization. Control of variability is vital to characterize the process and also to indicate the causes of problems within the process (Bonilha 1994, Peche Filho 1999, 1994). Some quality control programs make use of the coefficient of variation, CV, as a mea-sure of dispersion (Pimentel-Gomes 1978, Garcia 1989). Scapim et al. (1995), analyzing the results of 66 tests in the area of plant enhancement and genetics, pro-posed a classification of the coefficients of variation for some characteristics of corn growing, such as height of the plant, weight of 100 grains, height, weight and number of the ears, weight of the grains and prolificity, with a view to appraising the accuracy of the exper-iments. Based on the criterion put forward by Garcia (1989), the coefficient of variation (CV) was classified by those authors by virtue of the mean (m) and standard deviation (sd) of the CV of the 66 studied tests. The authors concluded that the limits of classes, proposed by Garcia (1989), are similar to those proposed by Pimentel-Gomes (1978) whose studied characteristics are much influenced by the ambient (weight and num-ber of the ears, weight of grains and prolificity). How-ever, for variations such as height of the plant and weight of 100 grains, Garcia’s method (1989) is better suited as it proposes smaller class intervals.
Molin (2002), appraising relative productivity for corn, soybean and wheat during four harvesting seasons, used as minimum limit a coefficient of variation of 30% to represent the variability between the crops (variability of productivity over time). Above this value the produc-tivity was considered non constant.
The lack of uniformity of density is so great in the cultivation of corn that many studies have sought meth-ods for the correction of productivity due to densities in experimental portions. Even in experimental plots for variety competition, for research purpose, the final den-sities of eight experiments analyzed by Schmidt et al. (2001) obtained coefficients of variation ranging from 3.92% to 12.82%.
Milan and Fernandes (2002) used histograms, con-trol charts and a T test for the statistical concon-trol of the preparation (chisel and grading tillage) of Ultissol soil
in the region of Piracicaba, São Paulo State in two treat-ments, with and without quality control during perfor-mance. For one part of the preparation, the scarifica-tion, quality control provided acceptable levels on the control chart and reduced the variability of the data. On the other hand, grading, quality control likewise reduced the variability of the data but did not allow the achieve-ment of the specified standards as the limits were set on theoretical bases, without a preliminary practical test (field conditions).
Laying down standards of quality control (limits of specification, means and variability) in the assessment of certain quality variables in the growing of winter corn is fundamental for starting up a quality program. The choice of the variables that may be used in the qual-ity control process is not easy. The analysis must take into account the importance and hierarchy among them. Multi-criterion decision analysis is a manner widely used in such cases.
It is the field of study that considers a decision in the presence of two or more conflicting objectives, pro-viding the decision-maker with tools for the choice of the best alternative (Tecle and Duckstein 1994, Pieter-sen 2006).
Many works have used this technique for this pur-pose (Pietersen 2006, Gilliams et al. 2005) with partic-ular emphasis on the work of Baja et al. 2007 who used the Multi-criterion method and the GIS (Geographical Information System) to generate two indices of Earth sustainability. The work shows the importance of the Multi-criterion method in the derivation of quantitative indices for natural phenomena.
The aim of this work was to suggest an operational quality index for the cultivation of winter corn using the Multi-criterion method, taking into consideration hier-archical analysis and Fuzzy Logic by using data from certain items of verification.
MATERIALS AND METHODS
Fig. 1 – Study area showing the Middle Paranapanema Valley.
(mean of the planted strip and coefficient of variation of the strip); interline spacing (cm) (mean of the planted strip and coefficient of variation of the strip); density (number of plantspermeter) (mean of the strip);
num-ber of acceptable spaces greater than 0.10 m and smaller than 0.30 m (plants properly positioned); number of plantspermeter (mean of the planted strip); length of
gaps greater than 0.30 m (mean of the strip) (m m–1), infestation of weeds in the development of the crop and after harvest (proportion of the area covered with weeds) (mean of the strip); loss of crop (total) (mean of the strip) (kg ha–1).
Considering the large number of semivariograms assessed for each variable, a standard of analysis was established to simplify exposition of the results. Ini-tially semivariograms were sought to prove the exis-tence of spatial correlation (Souza Dias 2006). Secondly, through an intensive analysis of the crossed validations, we sought the model with the best cross validation re-sult (Souza Dias 2006). Spatialization of the variables during the development of the crops was done on the basis of 108 planted strips which were sampled, while the variables analyzed after the harvest were performed on 156 sampled strips.
The classification of the quality of the crops was performed through the IDRISI 32 decision-support modules using maps of the quality items of the crops produced by kriging method of the values of the means encountered in the sampled strips.
A careful analysis of the available items of qual-ity verification makes it clear that these items are not sufficiently wide-ranging for the classification and
mapping-out of the overall quality of the crops of win-ter corn. The lack of important control items, such as: productivity, quality of the grains and an analysis of sus-tainability of the production system prevents a broader analysis of quality. As a result we established that the analysis would be of operational quality in the cultiva-tion, being it the maximum that the chosen items of ver-ification would allow.
VERIFICATIONITEMS OFOPERATIONALQUALITY
ESTIMATE OF THEDATE OFSOWING
The estimate of the date of sowing was made by sub-tracting from the date of post-harvest sampling the num-ber of days necessary to accumulate 1661 daily thermal units (DTU’s), and subtracting another two days (con-sidering the average time between the harvest and the sampling) (IAC 2001, Fornasieri Filho 1992).
CROPMULCH
The proportion of the soil covered by vegetable wastes, known as crop mulch, was established during the de-velopment of the corn growth and immediately after its harvest, making a visual estimation of the area covered with harvested waste in the first five spaces among the lines, counting from the top downwards (Fig. 2). Re-markably, at the fifth sampling point of the strip, af-ter the visual assessment, an assessment was made of crop mulch by the string method (Laflen et al. 1981). It was done to verify the accuracy of the visual assessment. The crop mulch was expressed as a percentage (%).
Fig. 2 – Scheme of a sample and location of the sub-samples.
SPACINGAMONG THELINES
sample with a tape measure. This variable was expressed in centimeters (cm) (Fig. 2).
DENSITY ANDPOPULATION OFPLANTS
The density, or number of plantsperlinear meter (pl/m),
was determined by counting the number of plants in five linear meters in the first five lines of planting of the sample, from the top downwards (Fig. 2).
SPACINGAMONGPLANTS
On the 4th line, with a view to assessing the distribution of plants along 5 meters of line, we counted the number of plants in each space of 0.10 m. The assessment of spacing among plants was indirect. The counting and calculation of the number and size of the spaces among plants and the assessment of the uniformity of distri-bution of plants were performed using a computer pro-gram developed in Visual Basic. The criteria employed were adapted from those recommended by Kurachi et al. (1989). An assessment was made of the acceptable spaces,permeter of line (no. m–1), greater than 0.10 m
and smaller than 0.30m.
Based on the number of acceptable spaces and the average length of the spaces among plants, we estimated the length of acceptable spaces greater than 0.10 m and smaller than 0.30 m. These variables were expressed in meters of acceptable spacespermeter of line (m m–1).
The number of multiple spaces was also assessed (agglomerated plants), which means the number of spaces smaller than 0.20 m with two or more plants. This variable was expressed in numbers of multiple spacespermeter of line (no. m–1).
Two sizes of gaps were counted: the number of spaces without plants greater than 0.30 m and the num-ber of spaces without plants greater than 0.50 m. These variables were expressed in numbers of gapspermeter
of line (no. m–1).
Based on the number of gaps and the mean length of the gaps (Dambrós et al. 1998), we estimated the length of gaps greater than 0.30 m, expressed in meters of gappermeter of line (m m–1).
INFESTATION OFWEEDS
The infestation of weeds (proportion, in % of area, of the surface of soil occupied by weeds) was assessed
visually by an estimate of the percentage of area occu-pied by weeds within a square of 25 cm2, asper the scale proposed by Braun-Blanquet (1932), quoted by Blanco (1977).
LOSS OFCROP
The methodology applied was adapted from the sys-tem proposed by Finch et al. (1980), Mantovani (1989) and Fornasieri Filho (1992). Loss of crop was assessed through the manual collection of loose grains in a rect-angle of five meters in length by one meter in width (5 m2) in such a way that the longer side ran perpen-dicular to the planted lines. The structures (ear, cobs) with grains were collected manually over a whole square (sample) of 5 meters along the side (25 m2). All grains found on the surface of the soil were collected, identi-fied, classiidenti-fied, husked, cleaned, dried and weighed. They were classified into: loose grains on the ground (grains that normally pass through the track of the har-vester, but which are thrown away); grains fixed to pieces of cob (structures that pass through the harves-ter’s track system); ears, normally whole (that have not passed through the harvester’s track system); and, fi-nally, technical loss of crop (total sum of the previous three). This variable was expressed in kilograms of material lostperhectare (km ha–1).
CRITERIA OFHIERARCHICALTREE
For the development of the multi-criterion analysis, it is fundamental to make a careful definition of the ob-jectives, as this guides the process of decision or choice (Forman and Selly 2001). We establish the weightings for the criteria based on these objectives.
A clear definition of the criteria allows one to set the degree of relative importance among them which will be used in the construction of the dual-comparison matrix. This matrix will calculate the relative weigh-tings of the criteria that will be used in the multi-cri-terion analysis.
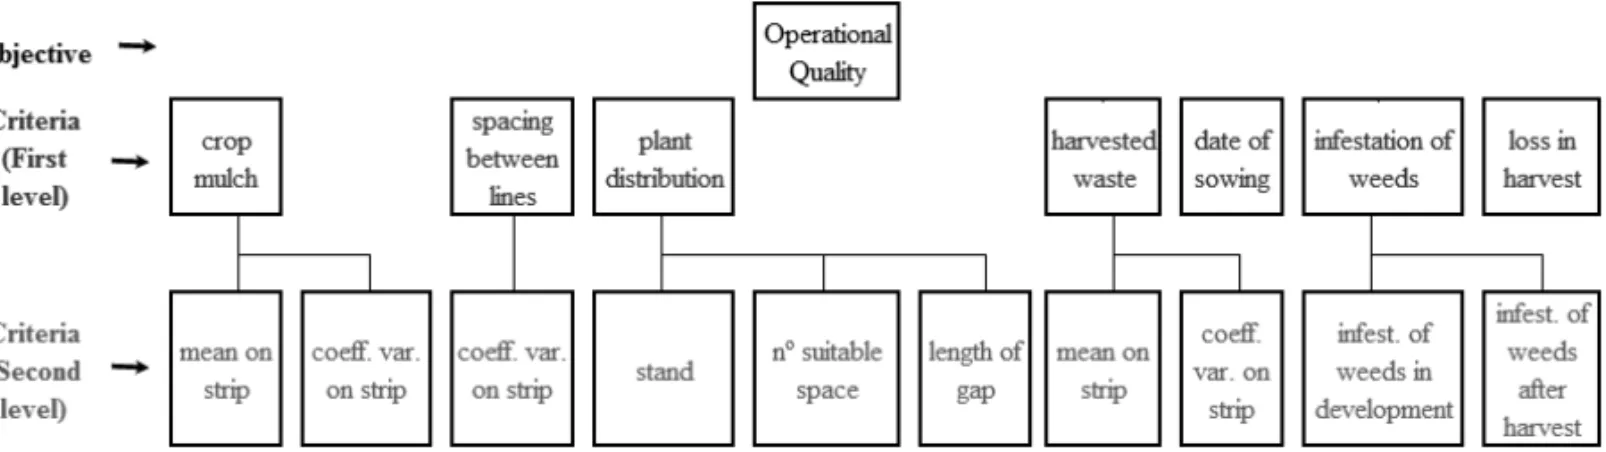
Fig. 3 – Tree of criteria hierarchy.
assessment of the factor that directly influenced the operational quality of the cultivation (crop mulch). At the Second level there were the criteria that influ-enced directly the First level criteria, such as the mean of crop mulch on the strip and the variability of crop mulch on it.
The hierarchy of criteria was established during the assembly of the tree of criteria, grouping together all the sub-criteria that concern to one same criterion at a higher level. In this way, an attempt was made to avoid overlapping in the assessment. Once the criteria are on one selfsame hierarchical level, they can be compared and their weighting can be set.
The Second level criteria break down each First level criterion into components or aspects that are fun-damental to it. The criterion of crop mulch (First level) was created considering that crop mulch requires two criteria to be assessed: – the mean of crop mulch on the strip and its variability (coefficient of variation of coverage of the strip) (Second level criteria). Similarly, the First level criterion of harvested waste was created considering that the crop mulch after the harvest also requires two criteria to be assessed: the mean and the variability of crop mulch (Second level criteria).
Spacing between lines was also assessed by two Second level criteria: – mean and variability of the spac-ing (coefficient of variation of the spacspac-ing on the strip).
In assessment of the plant distribution criterion (First level), three Second level criteria were used: prop-erly spaced plants and their density, number of spaces between plants greater than 0.10 m and smaller than 0.30 m, and length of gaps (length of gaps greater than 0.30 m).
The infestation of weeds (First level criterion) was assessed considering infestation during the development phase and after the harvest.
For the criteria of date of sowing and loss of crop, no sub-criteria were created and their means were used directly as First level criteria.
Forman and Selly (2001) consider that the AHP (Analytic Hierarchy Process) is based on three funda-mental principles: decomposition, comparative judge-ment and hierarchical composition. With the criteria arranged into a hierarchy, the comparative judgment among the criteria of one same level is done through the construction of a square matrix with the values of the important rates to be compared among the criteria. The rate of importance among the criteria is established according to a scale of values ranging from 1/9 to 9.
Once the matrix is constructed, the weightings of each criterion were extracted by the Weight model of IDRISI 32, which calculates the principal autovector by producing weightings that added together are equal to One (1), as required by the procedure of weight linear combination (WLC).
OPERATIONALQUALITY
TABLE I
Importance of Second level criteria for the First level.
F i r s t l e v e l c r i t e r i a
Dead Spacing Plant Infest. Date Harvested Loss
cover between lines distrib. of weeds of sowing waste in harvest Operational quality Very high High Extremely high Very high High High Very high
with the previously established matrix, the table was re-scaled in order to represent correctly the relative impor-tance of the criteria. The foundation of the process was the development of coherent argumentation that would allow a determination of the value of relative importance for the criteria.
The relative importance given to the Second level criteria and the information reliability on criterion as-sessment were both taken into account regarding the establishment of the matrix rates of importance for esti-mating these criteria.
FIRSTLEVELCRITERIA FOROPERATIONALQUALITY
The First level criteria chosen for the determination of operational quality were Crop mulch, Spacing among lines, Distribution of plants in the line of sowing, In-festation of weeds, Date of sowing, Harvested waste, Loss of crop.
– Crop mulch was considered a highly important cri-terion for the development of the plants in the as-sessment of operational quality, as it is influenced by many operations, mainly by the harvest, prepa-ration of the soil and sowing. This index is con-sidered by the agronomic community an excellent means of assessment of operational quality. The method of determining this variable was consid-ered highly reliable.
– Spacing among lines was considered a very impor-tant criterion in the assessment of operational qual-ity of the crops, since it assesses directly the qualqual-ity of the sowing operation. In this case, variability is far more important than the mean spacing. Whereas variability is linked to operational failures, mean spacing is more a function of the farmer’s choice. Its lack of uniformity (variability) may mean the loss of plants due to crushing during care of the crop, with an increase of losses in the harvest.
– The distribution of plants in the line of sowing was considered a highly important criterion in assess-ment of the operational quality of the crops, as it as-sesses directly the quality of the sowing, which is the most complex and delicate operation in setting up a corn plantation. The method of determination was established by the integration of three sub-criteria (density, number of proper spaces, length of gaps).
– The infestation of weeds in the crop is a very im-portant criterion in assessment of operational qual-ity, as it assesses the operations of control and han-dling of the weeds. The infestation of weeds was assessed at two points, namely: during crop devel-opment and post harvest. Each point was consid-ered as a Second level criterion. Reliability of the information is good.
– The date of sowing is a highly important criterion in the indirect measurement of operational quality. Being determined on the basis of the date of the after-harvest sampling, it displays poor reliability. However, it is a criterion that assesses the planning and suitability of the time of starting the plantation.
– Harvested waste (crop mulch after the harvest) was considered a highly important criterion in the as-sessment of operational quality, as it assesses the quality of the performed harvest. This variable as-sesses the system of crushing and distribution of straw by the harvester.
SECONDLEVELCRITERIA FOROPERATIONALQUALITY
The mean of crop mulch (Second level criterion) was considered moderately less important than the variabil-ity of crop mulch in the determination of crop mulch during development and in harvested waste (coverage after harvest), which is a First level criterion in the as-sessment of operational quality. We took into account that variability is the most important factor in the de-termination of operational quality, as this is related to the uniformity of the operations that influenced the dis-tribution and uniformity of this coverage, whereas the means are far more dependent on the productivity of previous crops.
The variability of spacing among the lines (Second level criterion) was the only factor considered in deter-mining the spaces among the lines (First level criterion in the assessment of operational quality). The mean of spacing was disregarded as a criterion for assessment of operational quality, since the mean depends only on the spacing option chosen by the farmer.
In the determination of plant distribution (First level criterion), the number of suitable spaces among plants was considered moderately more important than density and the length of gaps. It was considered that, among the assessed criteria, the number of suitable spaces among plants better assesses the quality of sow-ing than density and the length of gaps.
The infestation of weeds after harvest (Second level criterion) was considered moderately less impor-tant than the infestation of weeds during the develop-ment of the crop in determining the infestation of weeds, a First level criterion in the assessment of operational quality. Whereas the infestation of weeds during de-velopment assesses the quality of operations of weed control, the infestation of weeds after harvest influences the quality of the harvest, but does not assess it directly, being rather a function of closing and competition for water, light and nutrients of the crop and the bank of seeds in the soil, and may be the outcome of a late emergence of weeds.
NORMALIZATION OF THEVALUES OF THECRITERIA
To make it possible to compare and combine informa-tion from different criteria, it was necessary to
trans-form the values of the criteria into one selfsame index of assessment. In the case of Boolean criteria, the lev-els of information are transformed into values between 0 and 1, and thus they can be combined. However, con-tinuous factors need to be combined through the sum total of the weightings multiplied by normalized values of the criteria (Eastman 2001).
S= N X
i=1
wixi (1)
in which: S =suitability;wi =weighting of factori; andxi =normalized value of the criterion of factori.
Fuzzy logic was then employed for normalizing the factors using the functions of pertinence. The use of fuzzy logic was performed in Idrisi 32.
DEFINITIONS OFCUT-OFFVALUES FOR
CALCULATING THEVALUES OFPERTINENCE AND ESTABLISHING THEFUZZYSET ON THEBASIS OFSETS OFSUPPORTINGVALUES FOR THECRITERIA
The procedure adopted sought to establish the cut-off values and the interval of values using the statistics of the population studied. In this way, the mean of the population always represents the degree of pertinence 0.5 for monotone functions of pertinence and a value of one (1) for symmetrical functions, and the limits used for determining the inflexion values were established placing the degree of pertinence of the fuzzy set [0.1] amongxvalues that would represent almost the whole
sampled population, preserving a symmetry of function around the mean.
RESULTS AND DISCUSSION
WEIGHTINGS FOR THEFIRST LEVEL CRITERIA IN THE DETERMINATION OF OPERATIONAL QUALITY
Table II presents the matrix of parity comparison of relative importance of the First level criteria, the basis to calculate weightings that settle the operational quality of the crops (objective).
har-TABLE II
Matrix of importance of the Second level criteria in operational quality.
crop spacing plant infestation date harvested loss
mulch between lines distribution of weeds of sowing waste in harvest
crop mulch 1 3 1/3 1 3 3 1
spacing between lines 1/3 1 1/5 1 3 1 1/3
plant distribution 3 5 1 3 5 5 3
infestation of weeds 1 1 1/3 1 3 3 1/3
date of sowing 1/3 1/3 1/5 1/3 1 1 1/5
harvested waste 1/3 1 1/5 1/3 1 1 1/3
loss in harvest 1 3 1/3 3 5 3 1
TABLE III
Matrix of importance of the Second level criteria for distribution of plants in the assessment of operational quality.
Stand No. spaces suitable Length of gap
stand 1 1/3 1
No. spaces suitable 3 1 3
length of gap 1 1/3 1
TABLE IV
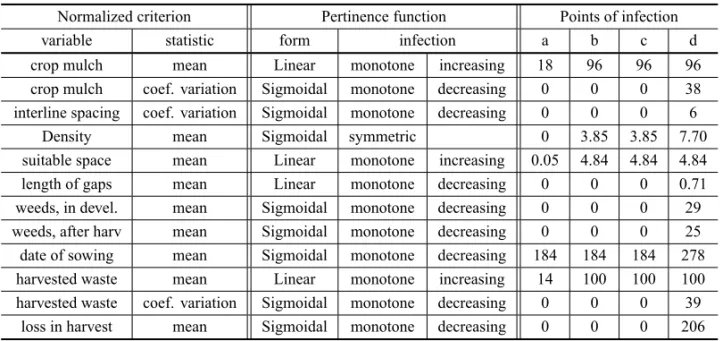
Functions and points of inflection in the normalization of the criteria for operational quality.
Normalized criterion Pertinence function Points of infection
variable statistic form infection a b c d
crop mulch mean Linear monotone increasing 18 96 96 96
crop mulch coef. variation Sigmoidal monotone decreasing 0 0 0 38 interline spacing coef. variation Sigmoidal monotone decreasing 0 0 0 6
Density mean Sigmoidal symmetric 0 3.85 3.85 7.70
suitable space mean Linear monotone increasing 0.05 4.84 4.84 4.84
length of gaps mean Linear monotone decreasing 0 0 0 0.71
weeds, in devel. mean Sigmoidal monotone decreasing 0 0 0 29
weeds, after harv mean Sigmoidal monotone decreasing 0 0 0 25
date of sowing mean Sigmoidal monotone decreasing 184 184 184 278 harvested waste mean Linear monotone increasing 14 100 100 100 harvested waste coef. variation Sigmoidal monotone decreasing 0 0 0 39
loss in harvest mean Sigmoidal monotone decreasing 0 0 0 206
vest, 0.1958. The rate of consistency, 0.04, indicates coherence in the values of the rates of importance that made up the matrix.
The method (Forman and Selly 2001) allowed the establishment of the matrix set out in Table III which, in its turn, allowed calculation of the presented weight-ings. The index of consistency of 0.013 and a rate of consistency of 0.014 indicate coherence in the values of the rates of importance that made up the matrix.
NORMALIZATION OFCRITERIA FORASSESSMENT OFOPERATIONALQUALITY
Table IV presents the chosen functions of pertinence, the forms of these functions and the inflexion values employed in the normalization of each First or Second level criterion in the assessment of operational quality.
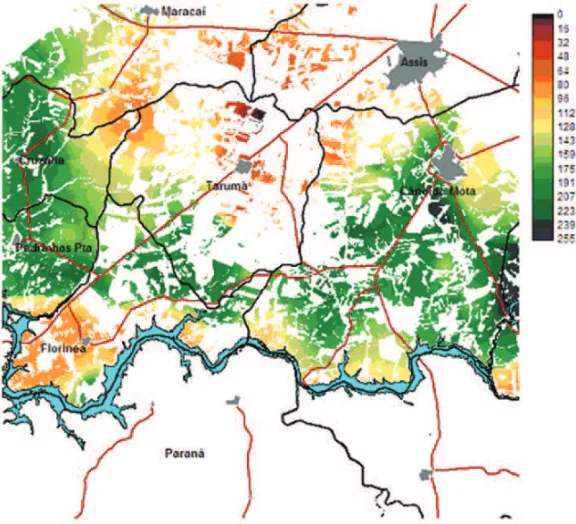
Fig. 4 – Map of operational quality of winter corn crops (zero (0) represents the crop of worst operational quality and 255 the one of best operational quality).
MULTI-CRITERIONANALYSIS OFOPERATIONALQUALITY
Figure 4 presents the spatial distribution of operational quality of the crops on a scale where zero (0) represents the planted strip of worst operational quality and 255 the strip of best operational quality. One finds the exis-tence of a nucleus of poor quality of crops to the North of the Municipality of Tarumã (Southwest of Assis, Southeast of Maracai) which probably reflects the dis-persed and fragmented crops in a region dominated by sugar cane, more sandy soils and the lack of technical assistance from the grain cooperatives settled in Cândi-do Mota (Coopermota) and Pedrinhas Paulista (CAP).
On the other hand, a clear nucleus of quality can be seen to the Southwest of Cândido Mota, a region of medium and large producers, with a good level of capitalization and high technology. These communi-ties called Água do Macuco and lower Pari enjoy con-siderable action from the assistance of Coopermota and sales of agricultural inputs.
A band running East-West contains crops of high
operational quality, and is precisely on the axis of op-erations of the two most important cooperatives in the region; CAP (Pedrinhas Paulista Agricultural Coopera-tive) and Coopermota (Cooperative of Coffee Growers of the Mid Sorocabana Region).
The fall-off in quality close to the Paranapanema River is due to the poor levels of quality of the crops assessed in the North of Paraná State which, while not mapped, influenced values to the North of the river, on the São Paulo side.
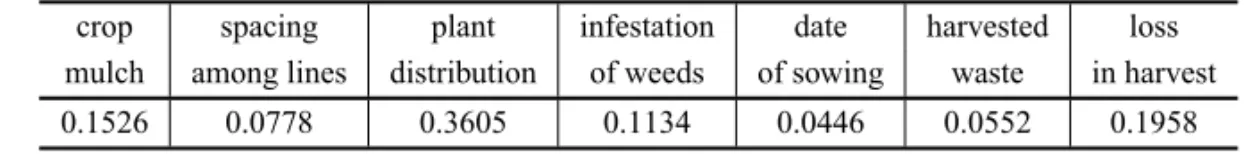
The weightings of the autovector are listed in Ta-ble V, in which the rate of consistency was 0.04.
TABLE V
Autovector weightings.
crop spacing plant infestation date harvested loss mulch among lines distribution of weeds of sowing waste in harvest
0.1526 0.0778 0.3605 0.1134 0.0446 0.0552 0.1958
Graph 1 – Influence of the weightings in the values of operational quality.
CONCLUSIONS
The available items of verification allowed classifica-tion of the operaclassifica-tional quality of the crops and the devel-opment of a method that makes possible, in subsequent works, analysis and mapping of a more general quality of Agricultural Operations.
The strategy of multi-criterion analysis and Fuzzy logic proved to be important tools for the assessment and preparation of a quality index for corn cultivation.
The index was good in representing the quality of agricultural operations when compared with reality.
RESUMO
Um dos maiores problemas na agricultura brasileira refere-se à perda da produção no campo que, devido a vários fatores, não é considerada. Este artigo tem o objetivo de desenvolver uma metodologia para identificar um índice de qualidade que integre algumas variáveis qualitativas da cultura que são ca-pazes de mostrar como está o desenvolvimento em termos de perda no campo. Os resultados mostraram que a análise de multicritério e lógica fuzzy são ferramentas importantes na verificação e confecção de um índice de qualidade de per-das, para a cultura do milho. O índice calculado representou bem a qualidade das operações agrícolas, quando comparado com a realidade.
Palavras-chave: cultura anual, otimização, fuzzy, qualidade
de cultura.
REFERENCES
ANDREWSSSAND CARROLL R. 2001. Designing a soil quality assessment tool for sustainable agro-ecosystem management. Ecol Appl 11: 1573–1585.
BAJAS, CHAPMANDMANDDRAGOVICHD. 2007. Spatial based compromise programming for multiple criteria de-cision making in land use planning. Environ Model Assess 12: 171–184.
BENSON VS, VAN LEEUWEN JA, DOHOOO IR AND SOMERSGH. 2006. Spatial Analysis of Use Impact on Ground Water Nitrate Concentrations. J Environ Qual 35: 421–432.
BIGGS J, WILLIAMS P, WHITFIELD M, NICOLET P, BROWN C, HOLLIS J, ARNOLD DA AND PEPPER T. 2007. The freshwater biota of British agricultural land-scapes and their sensitivity to pesticides. Agric Ecos and Environ 122: 137–148.
BLANCOHG. 1977. Planta daninha e mato competição. In: CURSO DE ATUALIZAÇÃO: HERBICIDAS EM FLORES -TAS. IPEF/ESALQ, Piracicaba, SP, Boletim Informativo Especial 5(15): 1–88.
BONILHAAJ. 1994. Qualidade total na agricultura: funda-mentos e aplicações. Belo Horizonte: Centro de Estudos de Qualidade Total na Agricultura, 344 p.
CONAB. 2007. Séries históricas de área, produtividade e pro-dução do milho 2asafra. http://www.conab.gov.br/conab-web/download/safra/Milho2aSerieHist.xls, Accessed on April 18.
DAMBRÓSRN, RIPOLITCCANDDIASCTS. 1998. Estudo de mecanismos dosadores de semeadoras variando-se a velocidade de deslocamento e a lubrificação das sementes na cultura de milho. Eng Rural 9: 39–49.
EASTMANJR. 2001. Idrisi 32 Release 2: IDRISI Help Sys-tem. Worcester: Clark University.
FINCHEO, COELHOAMANDBRANDINIA. 1980. Colheita de milho. In: Informe Agrop 6: 61–66.
FORMAN EH AND SELLY MA. 2001. Decision by Ob-jectives: How to Convince Others That You Are Right. 402 p. World Scientific Publishing Company. ISBN: 9810241437. http://mdm.gwu.edu/forman/DBO.pdf. Ac-cessed on April 05 2005.
FORNASIERI-FILHOD. 1992. A cultura do milho. Jabotica-bal: FUNEP. 273 p.
GARCIACH. 1989. Tabelas para classificação do coeficiente de variação. Piracicaba: IPEF, Circular Técnica, 171, 11 p.
GILLIAMSS, RAYMAEKERS D, MUYS B AND VAN OR -SHOVEN J. 2005. Comparing multiple criteria methods to extend a geographical information system on afforesta-tion. Comp and elect in agric 49: 142–158.
GRUHN P, GOLETTI F AND YUDELMAN M. 2000. Inte-grated Nutrient Management, Soil Fertility, and Sustain-able Agriculture: Current Issues and Future Challenges. International Food Policy Research Institute. Food, Agri-culture, and the Environment Discussion Paper 32. Sept. 31 p. http://www.ifpri.org/2020/dp/2020dp32.pdf. Ac-cessed on October 09 2007.
HONISHM, HELLMEIERCANDWEISSK. 2002. Response of surface and subsurface water quality to land use changes. Geod 105: 277–298.
IAC – INSTITUTOAGRONÔMICO. 2001. Avaliação Regional de Cultivares de Milho Safrinha no Estado de São Paulo: Resultados 2001. Assis, SP: IAC, Relatório, 62 p. IEA – INSTITUTO DEECONOMIAAGRÍCOLA. 2002. Série
Informações Estatísticas da Agricultura, Anuário IEA, São Paulo, v. 13, n.1.
KURACHISAH, COSTAJAS, BERNARDIJA, COELHOJLD AND SILVEIRA GM. 1989. Avaliação tecnológica de semeadoras e/ou adubadoras: tratamentos de dados de ensaio e regularidade de distribuição longitudinal de se-mentes. Brag 48: 249–262.
LAFLENJM, AMAMIYAMANDHINTZEA. 1981. Measur-ing crop residue cover. J Soil Water Conserv 36: 341–343. MANTOVANI EC. 1989. Colheita mecânica do milho. In: FUNDAÇÃO CARGILL, COLHEITA MECÂNICA, SECA -GEM E ARMAZENAMENTO DO MILHO. Campinas, SP. Fundação Cargill, Série técnica, 2, Cap. 1, p. 1–24. MILANM AND FERNANDES RAT. 2002. Qualidade das
operações de preparo de solo por controle estatístico de processo. Sci Agri 59: 261–266.
MOLINJP. 2002. Definição de unidades de manejo a partir de mapas de produtividade. Eng Agr 22: 83–92. PECHE FILHO A. 1994. Qualidade total na agricultura.
In: SIMPÓSIO: QUALIDADE TOTAL NA AGRICULTURA, Campinas, SP, p. 19–34.
PECHEFILHOA. 1999. Critérios para avaliar a qualidade do plantio direto. O Agron 51: 14–15.
PIETERSEN K. 2006. Multiple criteria decision analysis (MCDA): A tool to support sustainable management of groundwater resources in South Africa. Water SA 32: 119–128.
PIMENTEL-GOMESF. 1978. Curso de estatística Experimen-tal, São Paulo: USP/ESALQ, 8aed., 430 p.
SCAPIMCA, CARVALHOCGPANDCRUZCD. 1995. Uma proposta de classificação dos coeficientes de variação para a cultura do milho. Pesq Agro Bras 30: 683–686. SCHMIDTER, CRUZ CD, ZANUNCIOJC, PEREIRA PRG
ANDFERRÃO RG. 2001. Avaliação de métodos de cor-reção do estande para estimar a produtividade em milho. Pesq Agrop Bras 36: 1011–1018.
SOUZADIASH. 2006. Análise Espacial e Multicriterial da Qualidade das Lavouras de Milho “safrinha” no Médio Paranapanema. Tese de Doutorado. UNICAMP, Campi-nas, SP, Brasil, 329 p.