NEMATODES POPULATION IN SUGARCANE (
)
LEILA LUCI DINARDO-MIRANDA (2*); JULIANO VILELA FRACASSO (3)
ABSTRACT
Nematodes are important pests of sugarcane crop in Brazil. However, no studies have been reported on the spatial and temporal variability of nematodes population in sugarcane fields and such studies are indispensable for the development of sampling plans, aimed at their application in integrated management programs. This work was carried out in two commercial fields of approximately 1 ha, both of them infested by Meloidogyne javanica and
Pratylenchus zeae. In each area, samples represented by about 50 g of roots, were collected every two months, within a grid measuring 10.5 × 10 m (experiment 1) and 9.8 × 10 m (experiment 2). The highest nematodes populations were obtained during the rainy season, when high temperatures and moistures were favorable to root development. For this reason the rainy season was considered the best time to collect samples to identify areas with nematodes problem. Among the 52 calculated semivariograms (28 for M. javanica or P. zeae populations in area 1 and 24 for M. javanica or P. zeae populations in area 2), 22 could not be fitted to any model and presented a pure nugget effect. The spherical model showed the best fit to the semivariograms of data observed in the other 30 conditions. In those cases, values of range in semivariogram varied from 22 to 77 m, with 47 m on average and suggesting that, to obtain a reliable estimate for the population of these plant parasites in a given area, samples should be collected 47 m apart, which is equivalent to 1.5 sampling points per hectare.
Key words: Saccharum, Meloidogyne, Pratylenchus, semivariogram, kriging.
RESUMO
VARIABILIDADE ESPACIAL E TEMPORAL DE POPULAÇÕES DE NEMATÓIDES PARASITOS DE PLANTAS EM CANA-DE-AÇÚCAR
Nematóides são importantes parasitos da cana-de-açúcar no Brasil. Apesar disso, não há estudos sobre a variabilidade espacial e temporal de suas populações em canaviais e tais estudos são indispensáveis para o desenvolvimento de planos de amostragem, visando à aplicação em programas de manejo integrado. Por essa razão, realizou-se este trabalho, em duas áreas comerciais, de cerca de 1 ha cada uma, ambas infestadas por Meloidogyne javanica e Pratylenchus zeae. Em cada área, amostras representadas por cerca de 50 g de raízes foram coletadas aproximadamente a cada dois meses, em grid de 10,5 × 10 m (Ensaio 1) e 9,8 × 10 m (Ensaio 2). As populações de
nematóides mais elevadas foram obtidas na estação chuvosa, quando as altas temperaturas e umidade favorecem o desenvolvimento das raízes das plantas. Assim, esta estação foi considerada a melhor para coleta de amostras visando identificar áreas com problemas nematológicos. Entre os 52 semivariogramas calculados (28 para populações de M. javanica ou P. zeae na área 1 e 24 para populações de M. javanica ou P. zeae na área 2), 22 não foram ajustados a qualquer modelo e tiveram efeito pepita puro. O modelo esférico foi o que mais se ajustou aos semivariogramas dos dados observados nas outras 30 situações. Nesses casos, o alcance variou de 22 a 77 m, sendo em média de 47 m, sugerindo que para uma estimativa confiável da população desses fitoparasitos em determinada área, amostras deveriam ser coletadas à distância de 47 m umas das outras, o que equivale a 1,5 pontos de amostragem por hectare.
Palavras-chave: Saccharum, Meloidogyne, Pratylenchus, semivariograma, krigagem.
(1) Received for publication in July 2, 2008 and accepted in November 3, 2009.
(2) Instituto Agronômico, Centro de Cana-de-Açúcar, Caixa Postal 206, 14001-970 Ribeirão Preto (SP). E-mail: [email protected] (*) Corresponding author.
1. INTRODUCTION
Among several species of nematodes found attacking sugarcane in Brazil, three have been rated
as major economic problems: Meloidogyne javanica,
Meloidogyne incognita and Pratylenchus zeae (Novaretti
and téraN, 1983, Moura et al., 1990). On the average,
these species cause losses productivity in the first
harvest of the highly susceptible varieties that range from 20 to 40%; the productivity and the longevity may also be reduced for the subsequent sugarcane ratoons
(DiNarDo-MiraNDa, 2006).
A number of studies dealing with the efficacy of different nematode control methods in sugarcane fields
were developed in Brazil along the last three decades. In opposition, studies related to the spatial and temporal distribution of nematode parasites of sugarcane are quite uncommon and they are indispensable for the development of sampling plans with the purpose of applying in integrated management programs (taylor, 1984).
CarNeiro et al. (1980) verified that the population
levels of P. zeae, Hoplolaimus galeatus, Helicotylenchus
dihystera and Paratrichodorus porosus occurring in a
sugarcane field at Piracicaba, São Paulo State, increased
progressively from November on, due to frequent rainfall and increased soil moisture, decreasing again by late March or early April. In relation to spatial distribution, DiNarDo-MiraNDa and FraCasso (2009)
used geostatistical techniques to analyze populations data of M. javanica, P. zeae and Pratylenchus brachyurus, occurring in individual or mixed infestations in six sugarcane fields in São Paulo State. The samples were
collected during the rainy season. The nematode aggregation area was estimated in 2,110 m2 but, In several instances, the semivariograms could not be
fitted to any of the tested models and were assumed to
represent pure nugget effects.
The objective of this study was to characterize the spatial and temporal variability distribution of M.
javanica and P. zeae in two Brazilian sugarcane fields
based on statistical analyses of population data and with selected geostatistical procedures.
2. MATERIAL AND METHODS
Two experiments were conducted in areas located
in the northern region of the State of São Paulo. The
experiment 1 was carried out in clay; soil area (62.0% clay,13.1% silt; 16.9% fine sand; 8.0% coarse sand; 24.9%
total sand) planted with the sugar cane variety
SP91-1049 on 2/19/05 and harvested for the first time on 6/13/06. The experiment 2 was carried out in sandy soil area (5.2% clay; 3.3% silt; 46.5% fine sand; 45.0% coarse
sand; 91.5% total sand), planted with the sugar cane
variety RB928064 on 3/29/05 and harvest for the first
time on 11/25/06.
Each experimental area was a field of 1 ha, where
the samples were collected within a rectangular grid
measuring 10.5 × 10 m (experiment 1) and 9.8 × 10 m (experiment 2), totalizing 100 sampling point in each sampling date, in each experiment. The samplings were done every two months, approximately, beginning two
months after planting and ending on August 2007, in
experiment 1 and on June 2007, in experiment 2. Fourteen and twelve samplings were done on experiment 1 and
2, respectively.
In each sampling point, 50 g sugarcane roots were collected to determine the nematode population.
Nematodes were extracted from roots by a combination of sieving and centrifugal flotation methods, in sucrose
solution, according to CooleN and D´HerDe (1972).
Data were initially analyzed by descriptive
statistics and mean, standard deviation, coefficient of variation, maximum value, minimum value, skewness
and kurtosis were obtained using the Statistical Analysis System (sas iNstitute, 1995). In order to decrease the coefficient of variation, the populations data were transformed to log(x+1), and basic statistics (mean, standard deviation, coefficient of variation and others)
were calculated again.
In order to verify the hypothesis of normality of the data, the sHapiro and Wilk (1965) test was carried
out using the Statistical Analysis System (sas iNstitute,
1995).
After this, geostatistical analyses of the transformed data were run using semivariograms and kriging interpolation to construct maps, as described by
vieira et al. (1983). The semivariogram analyses were
conducted using the GEOSTAT software (vieira et al., 2002). Based on the models fitted to the semivariograms, the jack knifing test was used to verify whether the
estimates of semivariogram parameters were adequate and to estimate the number of neighbors that should be used in the kriging interpolation (vieira, 2000). Once
the parameters for the model were validated and the adequate numbers of neighbors was determined, values were interpolated for the locations where they were not measured, by the kriging method, using the GEOSTAT software (vieira et al., 2002). The kriging-estimated
values were used in the Surfer software (GolDeN
soFtWare, 1999) to construct the maps.
3. RESULTS AND DISCUSSION
Among the nematode species important for sugarcane, M.javanica and P.zeae were found in both
Great differences were observed in the
experiments between the maximum and minimum
populations, for both species under study, considering
either the original data or data transformed to log(x+1).
However, when transformed data were considered,
the coefficients of variation, skewness and kurtosis
were smaller as compared to the original data. For this reason, transformed data were used to conduct all the
analysis. The coefficients of variation for P. zeae were
between 8.2 and 28.1 in experiment 1, and between 10.8 and 41.2% in experiment 2. These values are
smaller than the observed for M.javanica, that reached
575.0 and 319.0% in experiments 1 and 2, respectively
(Tables 1 and 2). Higher variability was also observed
by DiNarDo-MiraNDa and FraCasso (2009) in Meloidogyne
populations, as compared to Pratylenchus. This is probably related to the biology of nematodes that belong to that genus. According to Ferris et al. (1990), because
Meloidogyne is a sedentary endoparasite, females lay all
their eggs in the same place, in masses, resulting in a highly-aggregated spatial pattern. On the other hand, nematodes of the genus Pratylenchus are migratory and therefore move through the plant and the soil, laying their eggs individually, resulting in a more uniform distribution in the area.
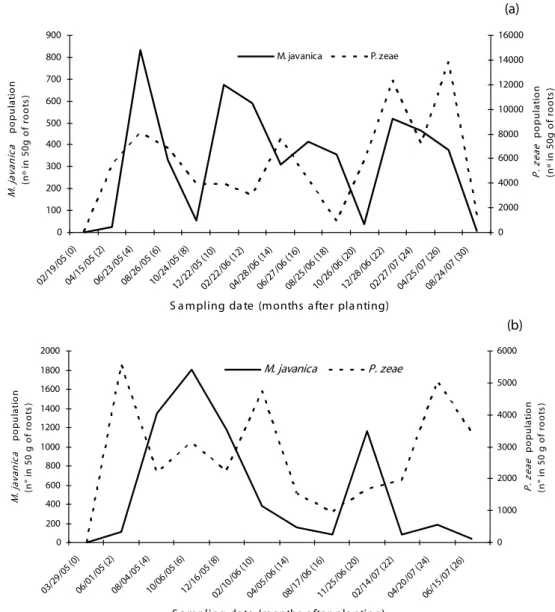
In both experiments, the nematode populations
increased rapidly at the beginning of crop development, with a population peak for both species occurring in June
2005 in experiment 1 and in June 2005 and October 2005,
respectively, for P.zeae and M.javanica in experiment 2
(Figures 1 and 2). Such rapid population growth can be attributed to the high soil moisture conditions as a resulted from rainfall (Figure 3).
For brazilian conditions, soil moisture plays a preponderant role on nematode population dynamics; Many factors may directly affect the spatial and temporal distribution of these parasites, but soil temperature and
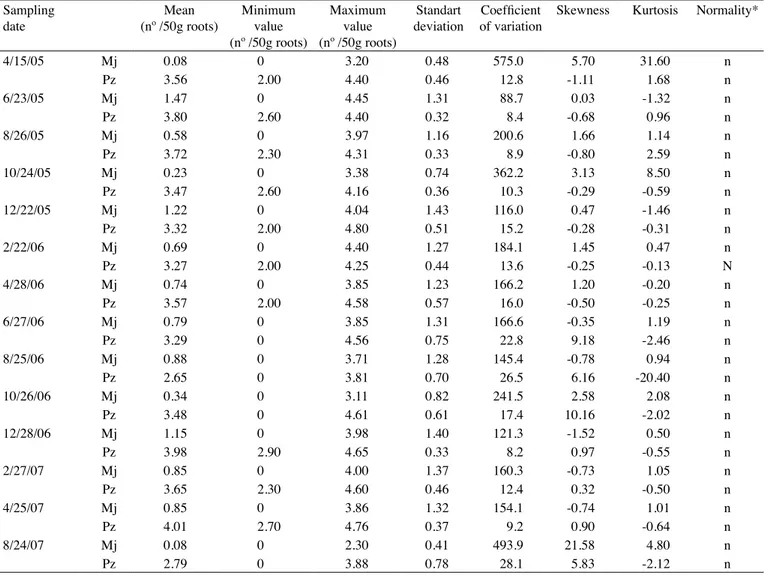
Table 1. Statistical parameters of transformed by log(x+1) data of M. javanica (Mj) and P. zeae (Pz) populations in SP91-1049 sugarcane variety, in experiment 1
Sampling date
Mean (nº /50g roots)
Minimum value (nº /50g roots)
Maximum value (nº /50g roots)
Standart deviation
Coefficient
of variation
Skewness Kurtosis Normality*
4/15/05 Mj 0.08 0 3.20 0.48 575.0 5.70 31.60 n
Pz 3.56 2.00 4.40 0.46 12.8 -1.11 1.68 n
6/23/05 Mj 1.47 0 4.45 1.31 88.7 0.03 -1.32 n
Pz 3.80 2.60 4.40 0.32 8.4 -0.68 0.96 n
8/26/05 Mj 0.58 0 3.97 1.16 200.6 1.66 1.14 n
Pz 3.72 2.30 4.31 0.33 8.9 -0.80 2.59 n
10/24/05 Mj 0.23 0 3.38 0.74 362.2 3.13 8.50 n
Pz 3.47 2.60 4.16 0.36 10.3 -0.29 -0.59 n
12/22/05 Mj 1.22 0 4.04 1.43 116.0 0.47 -1.46 n
Pz 3.32 2.00 4.80 0.51 15.2 -0.28 -0.31 n
2/22/06 Mj 0.69 0 4.40 1.27 184.1 1.45 0.47 n
Pz 3.27 2.00 4.25 0.44 13.6 -0.25 -0.13 N
4/28/06 Mj 0.74 0 3.85 1.23 166.2 1.20 -0.20 n
Pz 3.57 2.00 4.58 0.57 16.0 -0.50 -0.25 n
6/27/06 Mj 0.79 0 3.85 1.31 166.6 -0.35 1.19 n
Pz 3.29 0 4.56 0.75 22.8 9.18 -2.46 n
8/25/06 Mj 0.88 0 3.71 1.28 145.4 -0.78 0.94 n
Pz 2.65 0 3.81 0.70 26.5 6.16 -20.40 n
10/26/06 Mj 0.34 0 3.11 0.82 241.5 2.58 2.08 n
Pz 3.48 0 4.61 0.61 17.4 10.16 -2.02 n
12/28/06 Mj 1.15 0 3.98 1.40 121.3 -1.52 0.50 n
Pz 3.98 2.90 4.65 0.33 8.2 0.97 -0.55 n
2/27/07 Mj 0.85 0 4.00 1.37 160.3 -0.73 1.05 n
Pz 3.65 2.30 4.60 0.46 12.4 0.32 -0.50 n
4/25/07 Mj 0.85 0 3.86 1.32 154.1 -0.74 1.01 n
Pz 4.01 2.70 4.76 0.37 9.2 0.90 -0.64 n
8/24/07 Mj 0.08 0 2.30 0.41 493.9 21.58 4.80 n
Pz 2.79 0 3.88 0.78 28.1 5.83 -2.12 n
moisture are considered the most important abiotic factors (MCsorley, 1998).
Soil temperature interferes with nematode survival, life cycle duration, and reproduction (Noe,
1991). For M. incognita, M. javanica, P. zeae, and P.
brachyurus the optimal range for development is
between 25 and 30 ºC (taylor and sasser, 1978).
Consequently, in Brazilian sugarcane plantations soil
temperature does not have a significant influence on
nematode populations, because it is generally near the ideal range, with little seasonal variation, rarely
reaching extreme values, lower than 15 ºC or higher than
35 ºC, which would be limiting for the development of these parasites.
On the other hand, the effect of soil moisture
is very significant, either directly, on the activity and
mobility of these parasites (sultaN and Ferris, 1991) or
indirectly, by interfering with root development, which is the nematodes feeding site.
According to vasCoNCellos and DiNarDo-MiraNDa
(2006), sugarcane begins to emit roots right after planting, and this process is maintained so long as soil moisture
is available. Under drought conditions, the root system
becomes smaller, with the initial death of superficial roots, followed by deeper roots in extended drought periods.
New roots are emitted only when soil moisture increases as a result of rains or irrigation. Therefore, in the present
experiments, regular and abundant rains in the months
that followed planting favored root growth, the feeding
site of nematodes, indirectly benefiting their populations.
Because in 2005 regular rains occurred throughout
the year, except in August, the nematode populations remained high in both experiment areas during that period. Significant reductions in nematode populations
were observed only in the months ranging from June to October 2006, when the volume of rains was very small. Starting in November 2006, with the beginning of the rainy season, populations again increased, reaching another peak between the months of December and April (Figures 1 to 3).
These data are in agreement with those obtained by
CarNeiro et al. (1980), who also observed that nematode
populations increased beginning in November with the rains and soil moisture, and decreased starting in
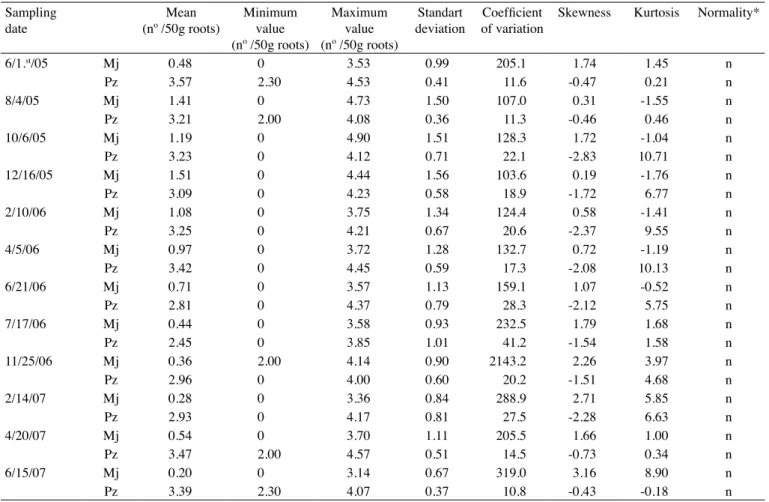
Table 2. Statistical parameters of transformed by log(x+1) data of M. javanica (Mj) and P. zeae (Pz) populations in RB928064 sugarcane variety, in experiment 2
Sampling date
Mean (nº /50g roots)
Minimum value (nº /50g roots)
Maximum value (nº /50g roots)
Standart deviation
Coefficient
of variation
Skewness Kurtosis Normality*
6/1.st/05 Mj 0.48 0 3.53 0.99 205.1 1.74 1.45 n
Pz 3.57 2.30 4.53 0.41 11.6 -0.47 0.21 n
8/4/05 Mj 1.41 0 4.73 1.50 107.0 0.31 -1.55 n
Pz 3.21 2.00 4.08 0.36 11.3 -0.46 0.46 n
10/6/05 Mj 1.19 0 4.90 1.51 128.3 1.72 -1.04 n
Pz 3.23 0 4.12 0.71 22.1 -2.83 10.71 n
12/16/05 Mj 1.51 0 4.44 1.56 103.6 0.19 -1.76 n
Pz 3.09 0 4.23 0.58 18.9 -1.72 6.77 n
2/10/06 Mj 1.08 0 3.75 1.34 124.4 0.58 -1.41 n
Pz 3.25 0 4.21 0.67 20.6 -2.37 9.55 n
4/5/06 Mj 0.97 0 3.72 1.28 132.7 0.72 -1.19 n
Pz 3.42 0 4.45 0.59 17.3 -2.08 10.13 n
6/21/06 Mj 0.71 0 3.57 1.13 159.1 1.07 -0.52 n
Pz 2.81 0 4.37 0.79 28.3 -2.12 5.75 n
7/17/06 Mj 0.44 0 3.58 0.93 232.5 1.79 1.68 n
Pz 2.45 0 3.85 1.01 41.2 -1.54 1.58 n
11/25/06 Mj 0.36 2.00 4.14 0.90 2143.2 2.26 3.97 n
Pz 2.96 0 4.00 0.60 20.2 -1.51 4.68 n
2/14/07 Mj 0.28 0 3.36 0.84 288.9 2.71 5.85 n
Pz 2.93 0 4.17 0.81 27.5 -2.28 6.63 n
4/20/07 Mj 0.54 0 3.70 1.11 205.5 1.66 1.00 n
Pz 3.47 2.00 4.57 0.51 14.5 -0.73 0.34 n
6/15/07 Mj 0.20 0 3.14 0.67 319.0 3.16 8.90 n
Pz 3.39 2.30 4.07 0.37 10.8 -0.43 -0.18 n
Figure 1. Population dynamics of M. javanica and P. zeae in roots of SP91-1049 (a, Experiment 1) and RB928054 (b, Experiment 2) sugarcane varieties. 0 100 200 300 400 500 600 700 800 900 02/1 9/05 (0) 04/1 5/05 (2) 06/2 3/05 (4) 08/2 6/05 (6) 10/2 4/05 (8) 12/2 2/05 (10) 02/2 2/06 (12) 04/2 8/06 (14) 06/2 7/06 (16) 08/2 5/06 (18) 10/2 6/06 (20) 12/2 8/06 (22) 02/2 7/07 (24) 04/2 5/07 (26) 08/2 4/07 (30)
S a mpling da te (months a fte r pla nting)
M . ja v a n ic a p o p u la ti o n (n º in 5 0 g o f ro o ts ) 0 2000 4000 6000 8000 10000 12000 14000 16000 P . z e a e p o p u la ti o n (n º in 5 0 g o f ro o ts )
M. javanica P. zeae
(a) 0 200 400 600 800 1000 1200 1400 1600 1800 2000 03/2 9/05 (0) 06/0 1/05 (2) 08/0 4/05 (4) 10/0 6/05 (6) 12/1 6/05 (8) 02/1 0/06 (10) 04/0 5/06 (14) 08/1 7/06 (16) 11/2 5/06 (20) 02/1 4/07 (22) 04/2 0/07 (24) 06/1 5/07 (26)
S a mpling da te (months a fte r pla nting)
M . ja v a n ic a p o p u la ti o n (n ° in 5 0 g o f ro o ts ) 0 1000 2000 3000 4000 5000 6000 P . z e a e p o p u la ti o n (n ° in 5 0 g o f ro o ts )
M. javanica P. zeae
(b)
Figure 2. Rain fall during experimental period.
0 100 200 300 400 500 600 02.2 005 04.2 005 06.2 005 08.2 005 10.2 005 12.2 005 02.2 006 04.2 006 06.2 006 08.2 006 10.2 006 12.2 006 02.2 007 04.2 007 06.2 007 08.2 007
Date (month.ye ar)
R a in ( m m )
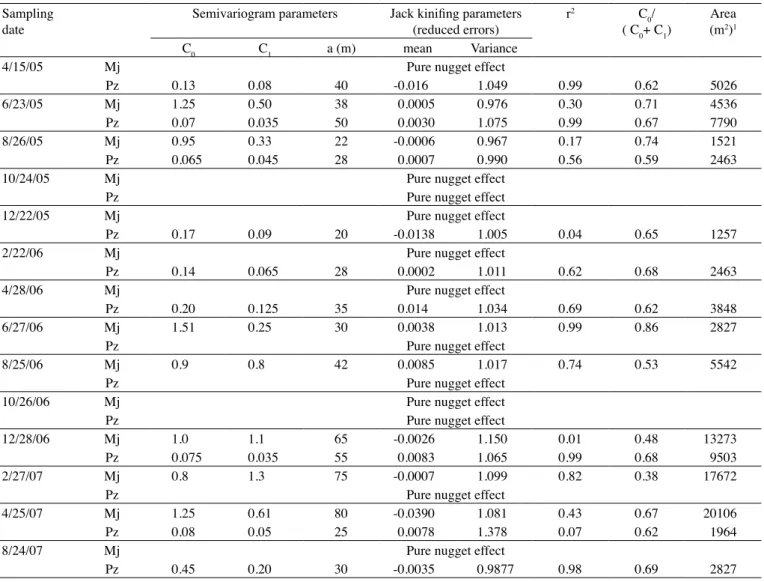
Table 3. Parameters of fitted semivariogram and jack kinifing, coefficient of determination (r2), C
0/(C0+C1) of M. javanica (Mj) and P. zeae (Pz) populations, in experiment 1
Sampling date
Semivariogram parameters Jack kinifing parameters
(reduced errors) r
2 C
0/
( C0+ C1)
Area (m2)1
C0 C1 a (m) mean Variance
4/15/05 Mj Pure nugget effect
Pz 0.13 0.08 40 -0.016 1.049 0.99 0.62 5026
6/23/05 Mj 1.25 0.50 38 0.0005 0.976 0.30 0.71 4536
Pz 0.07 0.035 50 0.0030 1.075 0.99 0.67 7790
8/26/05 Mj 0.95 0.33 22 -0.0006 0.967 0.17 0.74 1521
Pz 0.065 0.045 28 0.0007 0.990 0.56 0.59 2463
10/24/05 Mj Pure nugget effect
Pz Pure nugget effect
12/22/05 Mj Pure nugget effect
Pz 0.17 0.09 20 -0.0138 1.005 0.04 0.65 1257
2/22/06 Mj Pure nugget effect
Pz 0.14 0.065 28 0.0002 1.011 0.62 0.68 2463
4/28/06 Mj Pure nugget effect
Pz 0.20 0.125 35 0.014 1.034 0.69 0.62 3848
6/27/06 Mj 1.51 0.25 30 0.0038 1.013 0.99 0.86 2827
Pz Pure nugget effect
8/25/06 Mj 0.9 0.8 42 0.0085 1.017 0.74 0.53 5542
Pz Pure nugget effect
10/26/06 Mj Pure nugget effect
Pz Pure nugget effect
12/28/06 Mj 1.0 1.1 65 -0.0026 1.150 0.01 0.48 13273
Pz 0.075 0.035 55 0.0083 1.065 0.99 0.68 9503
2/27/07 Mj 0.8 1.3 75 -0.0007 1.099 0.82 0.38 17672
Pz Pure nugget effect
4/25/07 Mj 1.25 0.61 80 -0.0390 1.081 0.43 0.67 20106
Pz 0.08 0.05 25 0.0078 1.378 0.07 0.62 1964
8/24/07 Mj Pure nugget effect
Pz 0.45 0.20 30 -0.0035 0.9877 0.98 0.69 2827
(1)Area calculated by ∏r2, where ∏=3.1416 and r = a.
April, when the rains and consequently soil moisture decreasing.
Although soil moisture significantly interfered
with M. javanica and P. zeae population dynamics, the competition between both species also played an
important role on population fluctuation, in certain
seasons making one population of one species to increase while the population of the other decreased. This fact
occurred in experiment 2 and between December and
April 2006 in experiment 1. According to eiseNbaCk
(1985), this illustrates the complexity of the relations
between the various species of nematodes.
According to Shapiro and Wilk´s test (sHapiro and
Wilk, 1965), only the P.zeae population in the sampling made on 2/22/06 in experiment 1 had normal distribution
(Tables 1 and 2). Despite the lack of normality in most data series, the analysis of transformed data showed that skewness and kurtosis values were near zero,
indicating they are nearly normal, and for this reason were considered adequate for geostatistical analysis. According to Cressie (1991), normality of data is not a
requirement in geostatistics; it is simply convenient that distribution will not have very long tails, which could compromise the analyses.
Among the 52 calculated semivariograms, those corresponding to the M. javanica populations
on 4/15/05, 10/24/05, 12/22/05, 2/22/06, 4/28/06, 8/24/06 and 10/26/06 in experiment 1, on 4/5/06, 6/21/06, 8/17/06, 11/25/06, 4/20/07, and 6/15/07
in experiment 2, and to the P. zeae populations on
10/24/05, 6/27/06, 8/25/06, 10/26/06, 2/27/07, and 8/24/07 in experiment 1, and 8/4/05, 10/6/05, 6/21/06, and 8/17/06 in experiment 2 did not fit any
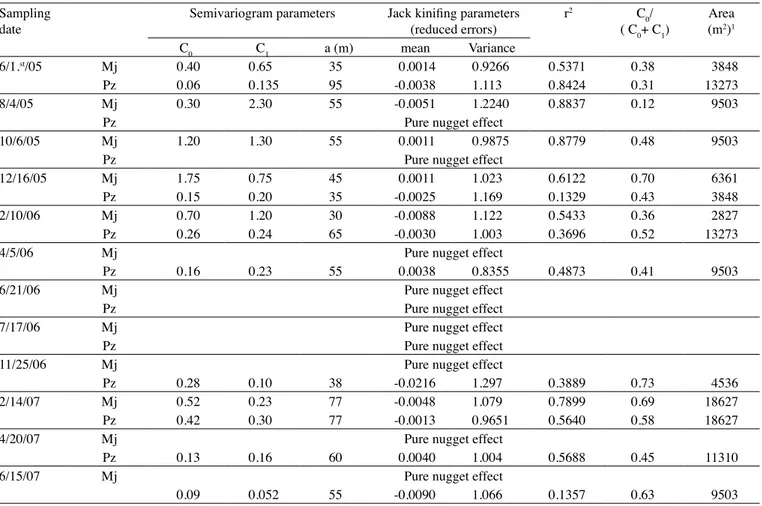
Table 4. Parameters of fitted semivariogram and jack kinifing, coefficient of determination (r2), C
0/(C0+C1) of M. javanica (Mj) and P. zeae (Pz) populations, in experiment 2
Sampling date
Semivariogram parameters Jack kinifing parameters
(reduced errors) r
2 C
0/
( C0+ C1)
Area (m2)1
C0 C1 a (m) mean Variance
6/1.st/05 Mj 0.40 0.65 35 0.0014 0.9266 0.5371 0.38 3848
Pz 0.06 0.135 95 -0.0038 1.113 0.8424 0.31 13273
8/4/05 Mj 0.30 2.30 55 -0.0051 1.2240 0.8837 0.12 9503
Pz Pure nugget effect
10/6/05 Mj 1.20 1.30 55 0.0011 0.9875 0.8779 0.48 9503
Pz Pure nugget effect
12/16/05 Mj 1.75 0.75 45 0.0011 1.023 0.6122 0.70 6361
Pz 0.15 0.20 35 -0.0025 1.169 0.1329 0.43 3848
2/10/06 Mj 0.70 1.20 30 -0.0088 1.122 0.5433 0.36 2827
Pz 0.26 0.24 65 -0.0030 1.003 0.3696 0.52 13273
4/5/06 Mj Pure nugget effect
Pz 0.16 0.23 55 0.0038 0.8355 0.4873 0.41 9503
6/21/06 Mj Pure nugget effect
Pz Pure nugget effect
7/17/06 Mj Pure nugget effect
Pz Pure nugget effect
11/25/06 Mj Pure nugget effect
Pz 0.28 0.10 38 -0.0216 1.297 0.3889 0.73 4536
2/14/07 Mj 0.52 0.23 77 -0.0048 1.079 0.7899 0.69 18627
Pz 0.42 0.30 77 -0.0013 0.9651 0.5640 0.58 18627
4/20/07 Mj Pure nugget effect
Pz 0.13 0.16 60 0.0040 1.004 0.5688 0.45 11310
6/15/07 Mj Pure nugget effect
0.09 0.052 55 -0.0090 1.066 0.1357 0.63 9503
(1)Area calculated by ∏r2, where ∏=3.1416 and r = a.
is, the distance between sampling points was too large to allow the detection of spatial dependence between them.
DiNarDo-MiraNDa and FraCasso (2009) also
calculated semivariograms for ten nematode populations
in sugarcane and were not able to fit four of them to any
model.
For the other populations the spherical model
provided the best fit to the semivariograms of the
observed data (Tables 3 and 4, Figures 3 and 4). Although observed r2 values were low, the parameters estimated for the spherical model (C0, C1, a) were endorsed by the
jack knifing test, since the mean values for the reduced
errors were near zero and the values for the variance of reduced errors were near 1 (Tables 3 and 4).
The portion of variability attributed to spatial dependence, given by the C0/(C0+ C1) ratio, varied from
0.39 to 0.86 in experiment 1 (Table 3) and from 0.12 to 0.73
in experiment 2 (Table 4). According to CaMbarDella et
al. (1994), values below 0.25, between 0.25 and 0.75, and above 0.75 indicate strong, moderate, and weak spatial dependence between data, respectively. Consequently,
all variables showed moderate spatial dependence,
except M. javanica on 8/4/05 in experiment 2, which
showed strong spatial dependence, and M.javanica on
6/27/06 in experiment 1, with weak spatial dependence.
The moderate degree of spatial dependence, found in most situations, indicates that the nematode distribution
in these fields is aggregated and it is in agreement with
results from other studies on the spatial distribution of nematodes, conducted in Brazil, such as those by Farias
et al. (2002), who worked with Rotylenchulusreniformis in cotton and found a C0/(C0+ C1) ratio value of 0.27, and
Torres et al. (2006), who observed ratio ranging from 0.05
to 0.67, working with R. reniformis and Dorylaimidae and Aphelenchidae nematodes in melon. DiNarDo-MiraNDa
and FraCasso (2009), who worked with M.javanica, P.
zeae, and mixed populations of P.zeae and P.brachyurus
in sugarcane, determined values for that ratio ranging
from 0.29 to 0.68.
The range (a), which represents the distance up to which there is spatial dependence between samples,
varied from 20 to 75 m in experiment 1 and from 30 to 95 m in experiment 2 (Tables 3 and 4), indicating that
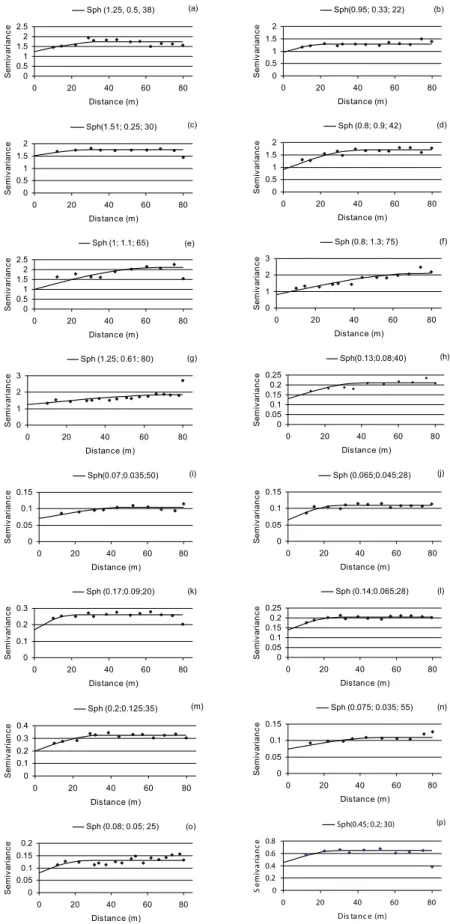
Figure 3. Semivariogram for populations of M. javanica (a, on 6/23/05; b, on 8/26/05; c, on 6/27/06; d, on 8/25/06; e, on 12/28/06;
f, on 2/27/07 and g, on 4/25/07) and P. zeae (h, on 4/15/05; I, on 6/23/05; j, on 8/26/05; k, on 12/22/05; l, on 2/22/06; m, on 4/28/06; n, on 12/28/06; o, on 4/25/07 and p, on 8/24/07), in experiment 1. Numbers in parenthesis are nugget effect value (C0), C1 and range (a) of spherical model (Sph).
0 0.5 1 1.5 2 2.5
0 20 40 60 80
Distance (m) S e m iv a ri a n c e
Sph (1.25, 0.5, 38) (a)
0 0.5 1 1.5 2
0 20 40 60 80
Distance (m) S e m iv a ri a n c e
Sph(0.95; 0.33; 22) (b)
0 0.5 1 1.5 2
0 20 40 60 80
Distance (m) S e m iv a ri a n c e
Sph(1.51; 0.25; 30) (c)
0 0.5 1 1.5 2
0 20 40 60 80
Distance (m) S e m iv a ri a n c e
Sph (0.8; 0.9; 42) (d)
0 0.5 1 1.5 2 2.5
0 20 40 60 80
Distance (m) S e m iv a ri a n c e
Sph (1; 1.1; 65) (e)
0 1 2 3
0 20 40 60 80
Distance (m) S e m iv a ri a n c e
Sph (0.8; 1.3; 75) (f)
0 1 2 3
0 20 40 60 80
Distance (m) S e m iv a ri a n c e
Sph (1.25; 0.61; 80) (g)
0 0.05 0.1 0.15 0.2 0.25
0 20 40 60 80
Distance (m) S e m iv a ri a n c e Sph(0.13;0.08;40) (h) 0 0.05 0.1 0.15
0 20 40 60 80
Distance (m) S e m iv a ri a n c e Sph(0.07;0.035;50) (i) 0 0.05 0.1 0.15
0 20 40 60 80
Distance (m) S e m iv a ri a n c e
Sph (0.065;0.045;28) (j)
0 0.1 0.2 0.3
0 20 40 60 80
Distance (m) S e m iv a ri a n c e
Sph (0.17;0.09;20) (k)
0 0.05 0.1 0.15 0.2 0.25
0 20 40 60 80
Distance (m) S e m iv a ri a n c e
Sph (0.14;0.065;28) (l)
0 0.1 0.2 0.3 0.4
0 20 40 60 80
Distance (m) S e m iv a ri a n c e
Sph (0.2;0.125;35) (m)
0 0.05 0.1 0.15
0 20 40 60 80
Distance (m) S e m iv a ri a n c e
Sph (0.075; 0.035; 55) (n)
0 0.05 0.1 0.15 0.2
0 20 40 60 80
Distance (m) S e m iv a ri a n c e
Sph (0.08; 0.05; 25) (o)
0 0.2 0.4 0.6 0.8
0 20 40 60 80
Dis ta nc e (m)
S e m iv a ri a n c e
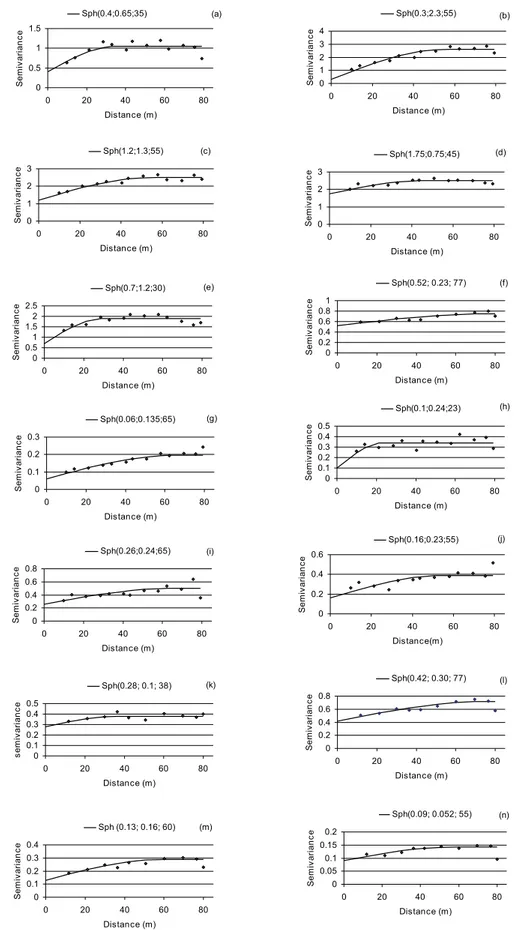
Figure 4. Semivariogram for populations of M. javanica (a, on 6/1.st/05; b, on 8/4/05; c, on 10/6/05; d, on 12/16/05; e, on 2/10/06 and f, on 2/14/07) and P. zeae (g, on 6/1.st/05; h, on 12/16/05; i, on 2/10/06; j, on 4/5/06; k, on 11/25/06; l, on 2/14/07; m, on 4/20/07 and n, on 6/15/07), in experiment 2. Numbers in parenthesis are nugget effect value (C0), C1 and range (a) of spherical model (Sph).
0 0.5 1 1.5
0 20 40 60 80
Distance (m) S e m iv a ri a n c e Sph(0.4;0.65;35) (a) 0 1 2 3 4
0 20 40 60 80
Distance (m) S e m iv a ri a n c e Sph(0.3;2.3;55) (b) 0 1 2 3
0 20 40 60 80
Distance (m) S e m iv a ri a n c e Sph(1.2;1.3;55) (c) 0 1 2 3
0 20 40 60 80
Distance (m) S e m iv a ri a n c e Sph(1.75;0.75;45) (d) 0 0.5 1 1.5 2 2.5
0 20 40 60 80
Distance (m) S e m iv a ri a n c e Sph(0.7;1.2;30) (e) 0 0.2 0.4 0.6 0.8 1
0 20 40 60 80
Distance (m) S e m iv a ri a n c e
Sph(0.52; 0.23; 77) (f)
0 0.1 0.2 0.3
0 20 40 60 80
Distance (m) S e m iv a ri a n c e Sph(0.06;0.135;65) (g) 0 0.1 0.2 0.3 0.4 0.5
0 20 40 60 80
Distance (m) S e m iv a ri a n c e Sph(0.1;0.24;23) (h) 0 0.2 0.4 0.6 0.8
0 20 40 60 80
Distance (m) S e m iv a ri a n c e Sph(0.26;0.24;65) (i) 0 0.2 0.4 0.6
0 20 40 60 80
Distance(m) S e m iv a ri a n c e Sph(0.16;0.23;55) (j) 0 0.1 0.2 0.3 0.4 0.5
0 20 40 60 80
Distance (m) s e m iv a ri a n c e
Sph(0.28; 0.1; 38) (k)
0 0.2 0.4 0.6 0.8
0 20 40 60 80
Distance (m) S e m iv a ri a n c e
Sph(0.42; 0.30; 77) (l)
0 0.1 0.2 0.3 0.4
0 20 40 60 80
Distance (m) S e m iv a ri a n c e
Sph (0.13; 0.16; 60) (m)
0 0.05 0.1 0.15 0.2
0 20 40 60 80
Distance (m) S e m iv a ri a n c e
1 are smaller than those in experiment 2. The soil texture could be contributed to this result; According
to vaN GuNDy (1985), nematodes migration decreases
when the clay and silt fractions in the soil increase.
However, further studies are needed to confirm this
phenomenon.
Just like in the present study, other studies have also revealed that the spherical model best describes the spatial distribution of plant-parasite nematodes, with similar range values as those herein determined. In Brazil, Fariaset al. (2002) worked with R.reniformis
in cotton and determined a mean range of 15 m, and
DiNarDo-MiraNDa and FraCasso (2008), in a study
involving M.javanica, P. zeae, and a mixture of P. zeae
and P.brachyurus in sugarcane, verified that range varied
from 18 to 35 m. Working with sugarcane in Martinica,
rossiet al. (1996) found range of 66.9 m to P. zeae, but exponential model was used to fit the semivariogram of
this specie.
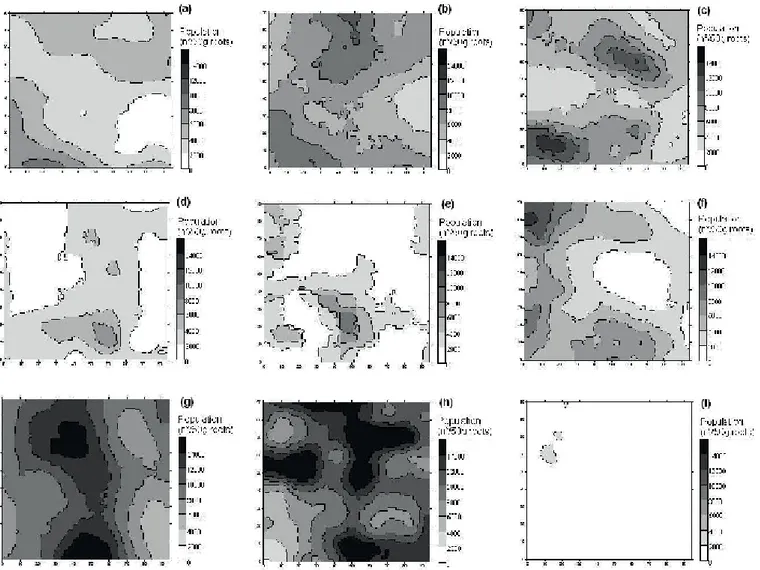
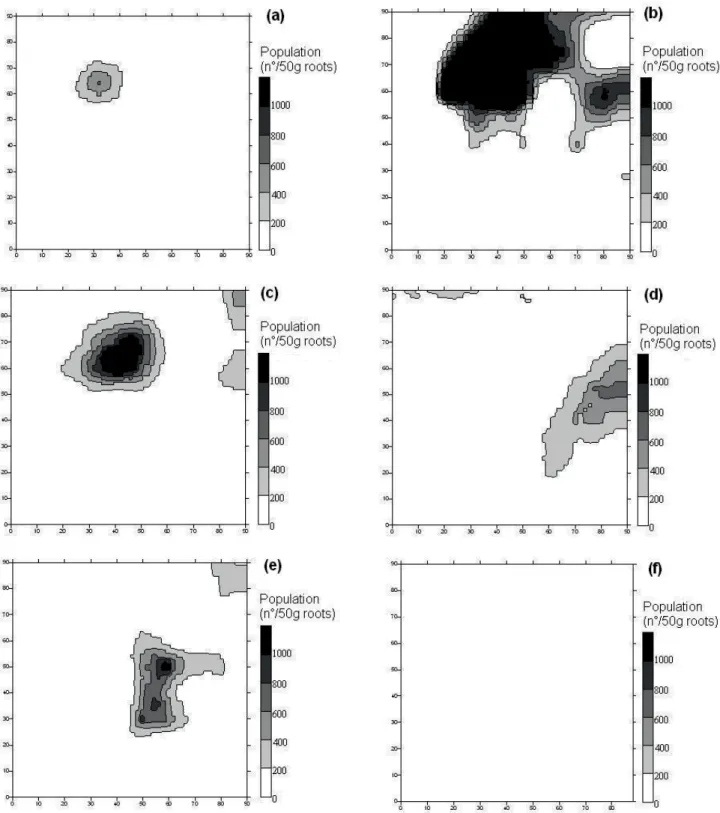
The maps constructed based on the data are
presented in Figures 5 to 8. In experiment 1, high values
of P. zeae population were found in several regions
in the field, except in a small part on the right side of experimental area, where the highest populations of
M. javanica were registered, indicating that competition
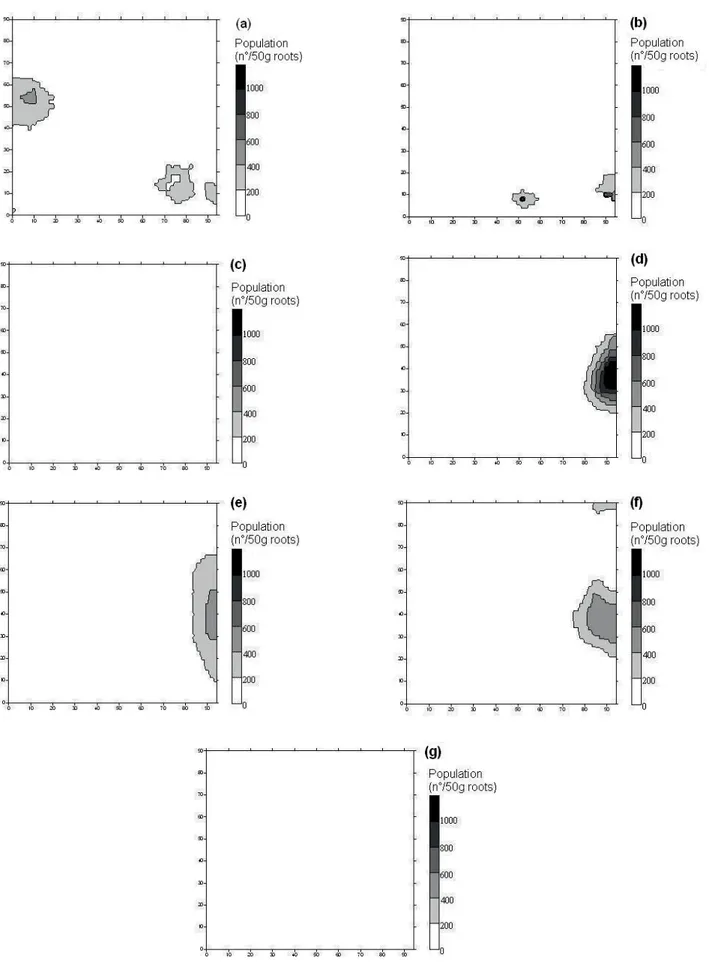
between the species could be occurred. In experiment 2,
the highest populations of M. javanica were in the upper
side of the field, whereas the highest populations of P.
zeae were registered in the left side of the field. It is also
possible to note that, in experiment 2, the maps for April 2006 (first year cane) and in April 2007 (ratoon) are very
similar, indicating that few changes occurred in the area in relation to P. zeae population, during the considered period.
Since population surveys in an integrated management program are intended to identify areas with nematode problems, the surveys should be carried out when populations are higher, that is, during the
Figure 7. Maps of spatial distribution of M. javanica (a, on 6/1.st/05; b, on 8/4/05; c, on 10/6/05; d, on 12/16/05; e, on 2/10/06 and f, on 2/14/07), in experiment 2.
rainy period of the year. Therefore, in the conditions of
our experiments, the best periods to perform samplings
were between February 2005 and April 2006 and between October 2006 and April 2007. In those periods, the mean range for both nematode species in both
experiments was 47 m, therefore revealing that samples
separated from one another by smaller distances would
Figure 8. Maps of spatial distribution of P. zeae (a, on 6/1.st/05; b on 12/16/05; c, on 2/10/06; d, on 4/5/06; e, on 11/25/06; f, on 2/14/07; g, on 4/20/07 and h, on 6/15/07), in experiment 2.
determined that sampling points should be adopted 27 m apart, on average, to estimate nematode populations,
in a study in which six areas were sampled. It must be pointed out, however, that the commercial fields of
sugarcane in Brazil involve a great number of varieties, grown in a wide variety of production environments; all these factors interfere with the spatial distribution
of nematodes and explain the differences observed in
the present work when compared with the study of
DiNarDo-MiraNDaand FraCasso (2009).
Hence, the data in the present work suggest that in order to obtain a reliable estimate of nematode populations, samplings should be taken in the rainy period of the year and should be collected 47 m apart, meaning at least 1.5 sample collection points per hectare.
REFERENCES
CAMBARDELLA, C.A.; MOORMAN, T.B.; NOVAK, J.M.; PARKIN, T.B.; KARLEN, D.L.; TURCO, R.F.; KONOPKA, A.E. Field-scale variability of soil properties in central Iowa soils.
Soil Science Society of America Journal, v.58, p.1501-1511,
1994.
CARNEIRO, R.M.D.G.; LORDELLO, L.G.E.; CARNEIRO, R.G.; MONTEIRO, A.R. Flutuação populacional de quatro espécies de nematóides parasitos da cana-de-açúcar (Saccharum officinarum L.) em relação à pluviosidade e umidade do solo. In: REUNIÃO BRASILEIRA DE NEMATOLOGIA4. São Paulo.
Trabalhos apresentados…São Paulo: Sociedade Brasileira de
Nematologia/Instituto Biológico, 1980 p.127-158.
COOLEN, W.A.; D’HERDE, C.J. A method for the quantitative extraction of nematodes from plant tissue. Grent: State
CRESSIE, N. Statistics for spatial data. New York: John Wiley,
1991. 900p.
DINARDO-MIRANDA, L.L. Manejo de nematóides e pragas de solo em cana-de-açúcar. In: CAMPOS, A.P.; VALE, D.W.; ARAÚJO, E.S.; CORRADI, M.M.; YAMAUTI, M.S.; FERNANDES, O.A.; FREITAS. S. Manejo integrado de pragas.
Jaboticabal: FUNEP, 2006. p.59-80.
DINARDO-MIRANDA, L.L.; FRACASSO, J.V. Spatial distribution of plant-parasitic nematodes in sugarcane.
Scientia Agricola, v.66, p.188-194, 2009.
EISENBACK, J.D. Interactions among concomitant populations of nematodes. In: SASSER, J.N.; CARTER, C.C. An advanced treatise on Meloidogyne. Raleigh: North Caroline State University, 1985. v.1, p.193-213.
FERRIS, H.; MULLENS, T.A. Stability and characteristics of spatial description parameters for nematode population.
Journal of Nematology, v.22, p.427-439, 1990.
FARIAS, P.R.S.; BARBOSA, J.C.; VIEIRA, S.R.; SÁNCHEZ-VILA, X.; FERRAZ, F.C.C.B. Geostatistical analysis of the spatial distribution of Rotylenchus reniformis on cotton cultivated under crop rotation. Russian Journal of Nematology, v.10, p.1-9, 2002.
GOLDEN SOFTWARE INC. Surfer for windows. Surfer. Surfer 7.0. Contouring and 3D surface mapping for scientist´s engineers. User´s Guide. New York: Golden Software, Golden,
CO, 1999. 619p.
McSORLEY, R. Population dynamics. In: BARKER, K.R.; PEDERSON, G.A.; WINDHAN, G.L. Plant and nematode interaction. Madison: ASA,CSSA and SSSA, 1998. p.109-133.
(Agronomy Monograph n.36)
MOURA, R.M.; RÉGIS, E.M.O.; MOURA, A.M. Espécies e raças de Meloidogyne assinaladas em cana-de-açúcar no Estado do Rio Grande do Norte, Brasil. Nematologia Brasileira, v.14, p.33-38, 1990.
NOE, J.P. Development of Meloidogyne arenariaon peanut and soybean under two temperature cycles. Journal of Nematology, v.23, p.468-476, 1991.
NOVARETTI, W.R.T.; TÉRAN, F.O. Controle de nematóides parasitos da cana-de-açúcar. In: REUNIÃO TÉCNICA AGRONÔMICA, 1., 1983, Piracicaba, Anais... São Paulo:
Copersucar, 1983. p.16-24.
ROSSI, J.P.; DELAVILLE, L.; QUÉNÉHERVÉ, P. Microspatial structure of plant-parasitic nematode community in sugar-cane field in Martinique. Applied Soil Ecology, v.3, p.17-36, 1996.
SAS INSTITUTE. Statistical analysis system for Windows:
computer program manual. Cary: SAS Institute, 1995. 705p.
SHAPIRO, S.S.; WILK, M.B. An analysis of variance test for normality: complete samples. Biometrika, v.52, p.591-611, 1965.
SULTAN, S.A.; FERRIS, H. the effect of soil moisture and soil particle size on the survival and population invrease of Xiphinema index. Revue of Nematology, v.13, p.345-351, 1991.
TAYLOR, L.R. Assessing and interpreting the spatial distribution of insects populations. Annual Review of Entomology, v.29, p.321-357, 1984.
TAYLOR, L.R.; SASSER, J.N. Biology, identification and
control of root-knot nematodes (Meloidogyne species).
Raleigh: North Caroline State University, 1978. 111p.
TORRES, G.R.C.; PEDROSA, E.M.R.; MONTENEGRO, A.A.A.; MICHEREFF, S.J.; MOURA, R.M. Aspectos ecológicos de comunidade de nematóides associada a cultivo de Cucumis melo no Rio grande do Norte. Nematologia Brasileira, v.30, p.1-9, 2006.
VAN GUNDY, S.D. Ecology of Meloidogyne spp. – Emphasis on environmental factors affecting survival and pathogenicity. In: SASSER, J.N.; CARTER, C.C. An advanced treatise on
Meloidogyne. Raleigh: North Caroline State University, 1985.
v.1, p.177-192.
VASCONCELOS, A.C.M.; DINARDO-MIRANDA, L.L.
Dinâmica do desenvolvimento radicular da cana-de-açúcar e implicações no controle de nematóides. Americana: Adônis,
2006. 54p.
VIEIRA, S.R. Uso de geoestatística em estudos de variabilidade espacial de propriedades do solo. In: NOVAIS, R.F. (Ed.).
Tópicos em Ciência do Solo. Viçosa: Sociedade Brasileira de
Ciência do Solo, 2000. p.1-54.
VIEIRA, S.R.; HATFIELD, J.L.; NIELSEN, D.R.; BIGGAR, J.W. Geostatistical theory and application to variability of some agronomical properties. Hilgardia, v.51, p.1-75, 1983.