Comparison of spatial interpolators for
variability analysis of soil chemical properties in
Cuamba (Mozambique)
Article in African journal of agricultural research · June 2017 DOI: 10.5897/AJAR2016.12415
CITATIONS
0
READS
82
2 authors:
Some of the authors of this publication are also working on these related projects:
GSIMCLIView project
Agricultural land susceptible to devastation by floods at the Limpopo River Basin based on the
reconstitution of past events of 2000 and 2013.View project José Bofana
Chinese Academy of Sciences
1PUBLICATION 0CITATIONS
SEE PROFILE
Ana Cristina Costa New University of Lisbon
54PUBLICATIONS 471CITATIONS
SEE PROFILE
All content following this page was uploaded by José Bofana on 24 June 2017.
Vol. 12(25), pp. 2153-2162, 22 June, 2017 DOI: 10.5897/AJAR2016.12415
Article Number: 32E487964920 ISSN 1991-637X
Copyright ©2017
Author(s) retain the copyright of this article http://www.academicjournals.org/AJAR
African Journal of Agricultural
Research
Full Length Research Paper
Comparison of spatial interpolators for variability
analysis of soil chemical properties in Cuamba
(Mozambique)
José do Rosário Bofana
1* and Ana Cristina Costa
21
School of Agriculture, Catholic University of Mozambique, Mozambique. 2
NOVA Information Management School (NOVA IMS), Universidade Nova de Lisboa, Portugal.
Received 28 April, 2017; Accepted 6 June, 2017
The knowledge of spatial distribution of soil attributes, particularly chemical ones, which is very relevant for agricultural planning. Several studies have focused on spatial interpolation of soil properties, but only a few of them have been undertaken in sub-Saharan Africa. This study aims to analyse the spatial variability of hydrogen potential (pH) and electric conductivity (EC) within an agricultural region in Cuamba district of Mozambique. Efficiency of a deterministic and a stochastic interpolator were compared, namely Inverse Distance Weighting (IDW) and Ordinary kriging, respectively. Soil samples were collected at random locations scattered through the study region, and were later analyzed in water and soil laboratory. These point data were then used to produce interpolated surfaces of soil chemical properties. Efficiency of spatial interpolation methods was assessed based on prediction errors’ statistics derived from cross-validation. Results show that ordinary kriging was less biased and more accurate than IDW at samples’ locations. Hence, maps produced using the former method are a valuable contribution for the spatial characterization of soil quality, according to its chemical properties. Considering the spatial patterns of pH, southeast area is characterized by clayey soils, which has a high fertility potential for food crops.
Key words: Geostatistics, inverse distance weighting , kriging, electric conductivity, pH.
INTRODUCTION
Obtaining a correct spatial distribution, various soil attributes is very relevant in agricultural planning (Kravchenko, 2003; Mueller et al., 2001), particularly for planting and maintenance of crops. Spatial distribution of soil attributes may affect various elements such as
hydrologic responses and yield potential. Moreover, if there is detailed knowledge about spatial variability of different attributes, local application of nutrients and fertilizers, or even lime, can be optimized and more effective, thereby improving production system (Behera
*Corresponding author.E-mail: jose.bofana@outlook.com.
and Shukla, 2015; Souza et al., 2010).
High cost and amount of time required for soil samples collection has motivated researchers to develop methods for creating soil maps from sparse soil data (Bishop and McBratney, 2001). Geostatistics techniques have been increasingly applied in the assessment of spatial variability of parameters of interest for agrarian sciences, thus allowing for mapping, quantification and modeling of continuous phenomena through interpolation of sampled points in space (Goovaerts, 1999). However, challenges still exist in determining the best method of interpolation for that purpose (de Moura Guerreiro et al., 2017; Piccini et al., 2014; Reza et al., 2010).
There are only a few studies characterizing the spatial variability of soil characteristics in Mozambique, particularly in northern provinces which are among the most fertile country areas (e.g., Nankani et al., 2006). Some of available studies are reported by Maria and Yost (2006) and Maria (2004) regarding the study of soil nutrient status, spatial variability of soil chemical properties and fertilization requirements in Cabo Delgado, Nampula and Manica provinces of Mozambique, and a survey of soil fertility status of four agroecological zones of Mozambique, respectively. Moreover, to best of our knowledge, little or no documentation exists on the comparison of spatial interpolators for soil properties in Mozambique.
The main objective of this study was to characterize the spatial variability of hydrogen potential (pH) and electric conductivity (EC) in Administrative Post of Cuamba in Mozambique. In order to obtain suitable interpolated surfaces of these soil properties, we assessed the efficiency of Inverse Distance Weighting (IDW) and Ordinary Kriging (OK). Spatial patterns of pH and electric conductivity may provide valuable information for assessing soil condition for plant growth.
Study region
Republic of Mozambique lies on the eastern coast of Southern Africa. Country region was grouped into ten agroecological zones and four zonal research centers (Walker et al., 2006), but it can be broadly divided into three geographical regions (Batidzirai et al., 2006; Nankani et al., 2006): North (Niassa, Cabo Delgado, and Nampula), Center (Zambézia, Tete, Manica, and Sofala) and South (Inhambane, Gaza, and Maputo province). Agroecological zones differ from each other in terms of physiographic, climatic and soil characteristics. The northern region covers approximately 50% of the total land area, corresponding to agroecological zones R7, R8, R9, and R10, and supports about 33% of the country’s population.
This region is characterized by high population growth and land use pressure. Low natural forest productivity
associated with wide unproductive land abandoned by
farmers have encouraged Mozambique’s government to
promote exotic forest plantation for companies, that plant large-scale monoculture (Mbanze et al., 2013). This study was carried out at Administrative Post of Cuamba (Figure 1), which is situated in District of Cuamba, south of Niassa Province, and classified as agroecological zone R7. Administrative Post of Cuamba shares borders with Administrative Post of Lúrio in the east, Administrative Post of Etarara in the southeast, and with Administrative Posts of Mitande and Metarica in the north. The study region has an area of 216 215 ha, where altitudes vary from 200 to 500 m above sea level. It has a wavy relief that is sometimes interrupted by rocky formations. This region is physiographically characterized by a low plateau area that gradually passes to a more dissected relief with steeper slopes, starting from sub-planaltic zone of transition to lateral zone.
In Cuamba region, as in most of northern country part, arid and dry weather and sub-humid dry, where average annual rainfall can vary from 800 to 1500 mm. As for mean temperature during plants growing period, there are some areas that exceed 25°C, although this may vary annually between 20 and 25°C on average (Marques et al., 2001).
Physiography of region is dominated by alternation of inter-rivers valleys that may alternate with dambos (complex shallow wetlands) due to their width, depth and position in relation to rivers. River’s valleys are dominated by alluvial dark soils that are characterized by a dense to moderate texture, which are moderately or poorly drained and subject to regular flooding (MAE, 2005). Hydrogeomorphic soils of varying texture can be found in dambos. On slopes of intermediate interfluves, soils are moderately well drained, varying in color from brown to yellowish, and have a clayey texture (Marques et al., 2001). In Cuamba district, total cultivated area is approximately 49 000 ha and number of agricultural explorations is almost 31 000 (INE, 2012), thus average land size under cultivation is about 1.58 ha per farmer. According to Lukanu et al. (2004), besides cropping, farmers also obtain their food and income through livestock such as goats, chickens, ducks, pigs, sheep and doves.
MATERIALS AND METHODS
Data
Bofana and Costa 2155
Figure 1. Map of Administrative Post of Cuamba, District of Cuamba, Niassa Province in Mozambique.
Figure 3. Flow chart of methodological framework.
Hence, only 33 soil samples were collected. Soil samples were collected using a hand probe of 18 cm. Values of pH and EC, were obtained through laboratory analyses of those soil samples using a pHmeter and a Conductometer, respectively.
Spatial interpolators
A flow chart summary of all procedures undertaken is shown in Figure 3. Data of pH and EC were organized and processed in order to evaluate interpolation efficiency of two methods. Values of IDW and OK were obtained using the geostatistical analyst extension of ArcGIS© 10.2. Before implementing spatial interpolation, an exploratory data analysis was undertaken aiming to uncover underlying patterns of soil attributes, as well as to detect possible outliers and anomalies, that could influence spatial analysis efficiency.
IDW is a deterministic spatial interpolator that accounts for distance relationships only. A predicted value of the attribute is computed as a weighted sum of data points located within a given search neighborhood, centered at the location of the point being predicted. Weight values are computed based on the inverse of distance (raised to some power) between data points and location being predicted.
Smoothness of the predicted surface increases as the power parameter value increases. Hence, we considered a power of two, which is the most common value of this parameter. In this case, the method is sometimes named Inverse Square Distance (ISD). Kriging methods are a family of stochastic spatial interpolators used to predict values of a random field at an unobserved location, using a set of samples from neighboring locations. Kriging estimators vary
depending on the adopted model for trend, given by the expression ( ) in the general linear regression estimator ( ) of Z attribute, defined as (Goovaerts, 1999):
(1)
where is the predicted location and are samples’ locations; ( ) is the weight assigned to datum ( ); ( ) and ( ) are expected values of the random variables ( ) and ( ); ( ) is the number of samples closest to location being predicted. OK accounts for local variations of mean ( ) by limiting its domain of stationarity to a local neighborhood.
Unlike deterministic interpolators, kriging assigns optimal weights to each sample point considering not only the distance between the samples and the unknown point, but also the spatial autocorrelation of the attribute. Kriging weights are obtained by solving the kriging system. When developing the system’s equations, the semivariogram model is assumed known. The semivariogram evaluates the dispersion of values as a function of distance and, under stationarity hypotheses, it is the inverse function of spatial covariances.
Considering Tobler's first law of geography, nearby points in space tend to have values more similar than points farther away, thus it is expected that the variability (dispersion) of values increases with increasing distance between points’ locations. While spatial autocorrelation decreases with increasing distance between
(
0) − (
0)
=
𝛼
(
0) (
𝛼) − (
𝛼)
( 0)
𝛼=1
Bofana and Costa 2157
Figure 4. Semivariogram of pH.
Figure 5. Semivariogram of electric conductivity (EC).
points, semivariogram increases with increasing distance between points. The semivariogram model used in the kriging process must guarantee that kriging equations are solvable (non-singular). Therefore, a mathematical semivariogram model is usually selected from a set of authorized ones and it is fitted to experimental semivariogram values calculated from data for given angular and distance classes.
Most common models are spherical, exponential and gaussian (da Silva Gualberto et al., 2016; de Moura Guerreiro et al., 2017; Hooshm et al., 2011; Robinson and Metternicht, 2006). A nugget effect model, which is a constant structure (C0), can also be added
to create a linear model of regionalization. The nugget effect model, represents a discontinuity at origin due to small-scale variation. On its own it would represent a purely random variable, with no spatial correlation. Data posting maps did not show evidence of anisotropy in attributes, thus omnidirectional experimental semivariograms were modeled. This means that spatial autocorrelation of both attributes was assumed identical in all directions (i.e isotropic). Theoretical semivariograms adjusted for pH (Figure 4) and EC (Figure 5) were spherical models:
(2)
where ̂( ) is the estimated semivariance for h distance between observations; a is the range parameter that takes values 7 and 9 km for pH and EC, respectively; C1 is the sill parameter that takes
values 0.390 and 2900 for pH and EC, respectively. The spherical model shows a progressive decrease of spatial dependence of the attribute until a distance (a) at which there is no spatial dependence. In both cases, we chose not to include a nugget effect model (C0), because there was no reason to believe that there is a
high variability of attributes over short distances.
Prediction errors’ statistics
IDW and OK are local interpolators, which means that these
̂( )
=
𝐶
13
2
𝑎 −
1
2
𝑎
3
, 0 <
≤ 𝑎
Table 1. Modelling parameters of the local neighborhoods used in the spatial interpolation of pH and electric conductivity (EC).
Interpolation method Soil
attribute
Minimum number of samples in each sector
Maximum number of
samples in each sector Neighborhood type
Inverse Distance Weighting (IDW)
pH 3 17 Circle with four sectors and
45°offset
EC 2 20 Circle with one sector
Ordinary kriging (OK) pH 1 3
Circle with four sectors and 45° offset
EC 2 3 Circle with one sector
methods only use samples’ values surrounding prediction location. Therefore, during modelling stage, it is necessary to set a local neighborhood of the point being predicted. The search neighborhood was defined as a circle covering the whole study domain. Then, a fixed number of minimum and maximum sample points were established.
This strategy guaranteed that the circle’s radius was small in areas where there was a high density of sample points, but larger where there was a lower density of points. Different combinations of minimum and maximum number of samples were evaluated considering prediction errors’ statistics obtained through cross -validation (Falivene et al., 2010), namely the Mean Error (ME) and the Root Mean Square Error (RMSE):
(3)
(4)
where z*(xα) and z(xα) are predicted and measured values at samples’ locations , respectively.
To reduce data clusters’ influence, the circle was also divided into equal angle sectors and different combinations of minimum and maximum number of samples were then evaluated. Best modelling parameters of local neighborhoods (Table 1) were those that provided a ME value closest to zero and a smallest RMSE value.
Those prediction errors’ statistics were also used to compare the performance of the interpolation methods considered (e.g Hooshm et al., 2011; Robinson and Metternicht, 2006). ME allows checking if prediction is biased, while RMSE assesses prediction accuracy.
RESULTS AND DISCUSSION
Exploratory data analysis
A statistical summary of pH and EC properties is presented in Table 2. Considering the classification used by Maria and Yost (2006), soil samples of Administrative Post of Cuamba vary between acid and slightly alkaline, since pH values range from 5.40 to 7.89. Only 14.7%
of samples have pH values smaller than six (acid), while approximately 20% have pH values greater than 7.4 (slightly alkaline). Electric conductivity has an average value of 295.55 µS/cm.
The coefficient of variation of both soil attributes was smaller than 20%, thus their measurements have moderate variability in the study domain. However, since EC is more heterogeneous than pH, its interpolated surface might be less precise. Exploratory data analysis did not suggest the existence of potential outliers, which could mislead the spatial analysis. Although normality is neither an hypothesis nor an assumption of interpolation methods considered (e.g Goovaerts, 1997), normality of
attributes’ data was investigated using the Shapiro-Wilk
test (Shapiro and Wilk, 1965). Considering its results (Table 2), there is evidence that both attributes are normally distributed at 5% significance level, since p-values of the test statistic are greater than 0.05.
Strongly acidic soils are likely to have high conductivity, because soils with low pH might have high soluble salt content and therefore high electrical conductivity. Even though pH measurements did not reveal strongly acidic soils in the study region, we investigated the possible existence of a linear relationship between pH and EC using the t-test of Pearson’s correlation coefficient, which was equal to 0.24. As expected, results show that there is no evidence to reject the null hypothesis of independence between the two soil properties at 5% significance level (p-value = 0.1874). This indicates that pH and EC have distinct spatial patterns.
Efficiency of interpolation methods
Interpolated surfaces of pH and EC were produced using IDW and OK (Figure 6 and 7, respectively). IDW maps exhibit more homogeneous surfaces than those of OK, thus they are less informative. This result is caused by a greater smoothing effect of the IDW method.
In areas where there is little or no data, the interpolator moves towards the overall mean, thus smoothing the prediction surface. This is not only controlled by the number of averaged neighbors, but also by the method
𝑀𝐸
=
1
𝛼
(
𝛼) −
(
𝛼)
=1
𝑅𝑀𝑆𝐸
=
1
𝛼
(
𝛼) −
(
𝛼)
2Bofana and Costa 2159
Table 2. Summary statistics of soil attributes measured at 33 sampling locations.
Statistic pH Electric conductivity (EC) in mS/m
Minimum 5.40 137
Maximum 7.89 435
Mean 6.77 295.55
Median 6.80 289
Standard deviation 0.69 55.37
Coefficient of variation (%) 10.19 18.73
Kurtosis –0.95 2.27
Asymmetry –0.31 0.16
Shapiro-Wilk 0.96 (p-value: 0.218) 0.94 (p-value: 0.051)
Table 3. Prediction errors’ statistics of methods used in spatial interpolation of pH and
EC.
Soil attribute Interpolation method Mean error Root mean square error
pH IDW 0.0526 0.7709
OK 0.0442 0.7218
EC IDW 5.9650 66.8086
OK –0.3373 65.3358
itself and other method parameters (e.g. semivariogram in kriging) (Falivene et al., 2010). Results of prediction
errors’ statistics obtained by cross-validation show that
OK was more efficient than IDW in the interpolation of both soil properties (Table 3), particularly in the case of EC. Both methods have a ME close to zero in pH interpolation, thus providing evidence of unbiased predictions at samples’ locations. However, IDW was much more biased than kriging in the interpolation of EC, most likely because the OK estimator is the Best Linear Unbiased Estimator (BLUE) if its assumptions hold, and EC has more heterogeneous sample values than pH.
Furthermore, RMSE values of OK predictions were smaller than those of IDW for both soil properties. Hence, kriging produced more accurate predictions at samples’ locations than IDW. Similar conclusions were reported by Reza et al. (2010) when comparing the efficiency of those two methods in the interpolation of soil properties in Dhalai district of Tripma, India. OK also performed better than IDW for pH and EC in topsoil of a dry land sheep and cropping farm, located in Shire of Wickepin, in southwest of Western Australia (Robinson and Metternicht, 2006).
Spatial variability of soil properties
Considering the interpolation methods’ efficiency results, the analysis of spatial patterns of soil properties will be
based on OK maps of pH (Figure 6b), EC (Figure 7b) and Land cover (Figure 8).
As expected from exploratory data analysis, most of Administrative Post of Cuamba has slightly acidic (6.1<pH<6.5) and neutral (6.6<pH<7.3) soils, where the former are mainly located in the northwest and southwest (Figure 6b). These areas are covered by closed broadleaved deciduous forests and closed to open shrub land, respectively.
Additionally, patterns of acidic soils (pH < 6) are mainly located in the southwest of the study region. This area is mainly characterized by closed to open shrub land and crop lands (Figure 8). However, cropland area is very small compared to other classes of land cover, implying that a large area with favorable pH conditions for agricultural production was unexplored. Five slightly alkaline areas (pH > 7.4) were scattered in the center of the study region, with open broadleaved deciduous forest as major land cover.
Figure 6. Surfaces of pH interpolated by (a) IDW and (b) OK.
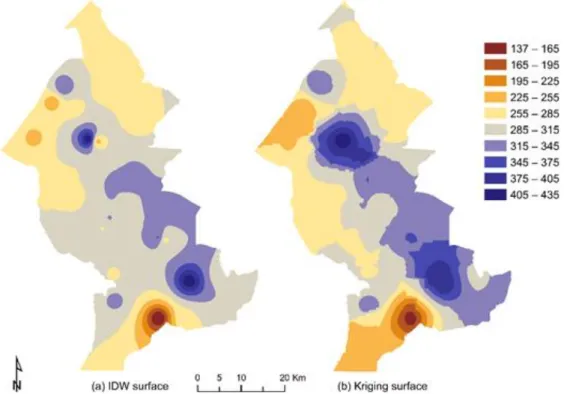
Figure 7. Surfaces of EC (mS/m) interpolated by (a) IDW and (b) OK.
level of tolerance to acidity and alkalinity. However, 5.8 to 7.2 pH levels contributes for normal yield for most vegetables such as lettuce, tomato, cucumber, cabbage,
Bofana and Costa 2161
Figure 8. Map of land cover of Administrative Post of Cuamba (GLCN, 2009).
permits optimum availability of nutrients in soil. Lake (2000) mentioned that, in general, a soil pH of 5.2 to 8.0 provides optimum conditions for most agricultural plants.
EC of soils varies depending on moisture amount held by soil particles, and it can be measured in a scale of 0 to 1000 ms/ m. It has been used at field scales to evaluate different anthropogenic properties (Corwin and Lesch, 2005). For example, Corwin et al. (2003) reported that crop yield inconsistently correlates to EC because of influence of soil properties (salinity, water, texture, among others). Wiatrack et al. (2009) mentioned that EC is an important characteristic used for mapping spatial variability of soils within a production field, and that showed a correlation with other soil properties such as organic carbon, cation exchange capacity (CEC) and depth of topsoil.
High values of EC of soils are commonly found in clayey soils. Highest values (Figure 7b) were found in northcentral and southeast regions. According to the land cover map (Figure 8), these areas are characterized by closed broadleaved deciduous forest, closed to open shrub land and mosaic vegetation (croplands). Type of soil (clay), which is representative at Administrative Post of Cuamba (Marques et al., 2001), has the advantage of nutrient retention by using slow–realize mineral fertilizers and this type of soil is good for growing vegetables like beans, potato, cabbage, pea.
In summary, the southeast region of the study area has
favorable pH, which is good for growing most food crops. Moreover, this area is characterized by clayey soils and high EC, which are favorable for nutrient retention. Therefore, the southeast region has a high fertility potential for food crops.
Conclusions
This study aimed at analyzing the spatial variability of pH and EC in Administrative Post of Cuamba, Mozambique. Interpolated surfaces of these soil properties were produced using IDW and OK. The latter was less biased
and more accurate at samples’ locations, thus exhibiting
a better performance than IDW. Therefore, the spatial variability analysis of soil properties was based on OK maps.
Administrative Post of Cuamba is characterized by clayeysoils,andhighvaluesofECthroughoutmostregion. Clay soils are relatively fertile because of their capacity to retain nutrients, thus indicating a favorable production of different types of food crops. There are only a few studies onthevariabilityofsoilattributesinMozambique.Therefore, further studies providing maps of different soil attributes in Mozambique are required, particularly in the north.
Further research on this topic is extremely important, because this will provide scientific information to support precise recommendations and decision making on which of the better crops to grow at specific locations in order to increase area’s production and productivity, thus contributing to nation’s food security.
CONFLICT OF INTERESTS
The authors have not declared any conflict of interests.
ACKNOWLEDGEMENT
The authors gratefully acknowledge the financial support of ACP-EU Cooperation Programme in Higher Education (EDULINK) thought the project AgIM-Agriculture Information Management and Precision Farming (FED/2013/320-079).
REFERENCES
Behera SK, Shukla AK (2015). Spatial distribution of surface soil acidity, electrical conductivity, soil organic carbon content and exchangeable potassium, calcium and magnesium in some cropped acid soils of India. Land Degrad. Dev. 26(1):71-79.
Batidzirai B, Faaij AP, Smeets E (2006). Biomass and bioenergy supply from Mozambique. Energy Sustain. Dev. 10(1):54-81.
Bishop TFA, McBratney AB (2001). A comparison of prediction methods for the creation of field exten soil property maps. Geoderma 103(2):149-160.
Corwin DL, Lesch SM (2005). Apparent soil electrical conductivity measurements in agriculture. Comput. Electron Agric. 46(1):11-43.
Corwin DL, Lesch SM, Shouse PJ, Soppe R, Ayars JE (2003). Identifying soil properties that influence cotton yield using soil sampling directed by apparent soil electrical conductivity. Agron. J. 95(2):352-364.
da Silva Gualberto AA, Nanni MR, da Silva Junior CA, Cezar E, Crusiol LGT, Silva GFC, de Carvalho Gasparotto A (2016). Spatial distribution of soil chemicals attributes in sugar cane crop area. Afr. J. Agric. Res. 11(48):4886-4893.
de Moura Guerreiro QL, de Oliveira Júnior RC, Santos GR, Ruivo MLP, Beldini TP, Carvalho EJM, Silva KE, Guedes MC, Santos PRB (2017). Spatial variability of soil physical and chemical aspects in a Brazil nut tree stand in the Brazilian Amazon. Afr. J. Agric. Res. 12(4):237-250.
Falivene O, Cabrera L, Tolosana-Delgado R, Sáez A (2010). Interpolation algorithm ranking using cross-validation and the role of smoothing effect. A coal zone example. Comput. Geosci. 36(4):512-519.
GLCN (2009). Land cover of Mozambique - Globcover Regional. Global Land Cover Network (GLCN), Food and Agriculture Organization of the United Nations (FAO), United Nations Environment Programme (UNEP), digital map available from http://www.glcn.org (accessed: April 2017).
Goovaerts P (1997). Geostatistics for Natural Resources Evaluation. Applied Geostatistics Series, Oxford University Press, New York. Goovaerts P (1999). Geostatistics in soil science: state-of-the-art and
perspectives. Geoderma 89(1):1-45.
Hooshm A, Delgh M, Izadi A, Aali KA (2011). Application of kriging and cokriging in spatial estimation of groundwater quality parameters. Afr. J. Agric. Res. 6(14):3402-3408.
INE (2012). Estatísticas do Distrito de Cuamba. Instituto Nacional de Estatística (INE), Estatísticas Distritais, Moçambique, Novembro 2012.
Kravchenko AN (2003). Influence of spatial structure on accuracy of interpolation methods. Soil Sci. Soc. Am. J. 67(5):1564-1571. Lake B (2000). Understanding soil pH. Acid Soil Management, New
South Wales Acid Soil Action Program, Leaflet No. 2.
Lukanu G, Green M, Greenfield P, Worth S (2004). Farmers' cash crop cultivation decisions in Southern Niassa province, Mozambique. Dev S. Afr. 21(3):531-554.
MAE (2005). Perfil do Distrito de Cuamba. Provincia de Niassa. [Profile of the Cuamba District. Niassa Province: in Portuguese]. Ministério da Administração Estatal (MAE), Moçambique.
Maria RM (2004). Soil nutrient status, spatial variability of soil chemical properties and fertilization requirements in Cabo Delgado, Nampula and Manica provinces of Mozambique. Master thesis in Tropical Plant and Soil Sciences, University of Hawai'i. http://hdl.handle.net/10125/10550
Maria RM, Yost R (2006). A survey of soil fertility status of four agroecological zones of Mozambique. Soil Sci. 171(11):902-914. Marques M, Vilanculos M, Mafalacusser J, Ussivane A (2001).
Levantamento dos Regadios Existentes no País – Fase III (Niassa, Cabo Delgado e Nampula). [National Irrigation Survey –Phase III (Niassa, Cabo Delgado and Nampula): in Portuguese]. Ministério da Agricultura e Desenvolvimento Rural, Moçambique, Vol. I & II. Mbanze AA, Romero AM, Batista AC, Ramos-Rodriguez M, Guacha L,
Martinho C, Nube T (2013). Assessment of causes that contribute to the occurrence of plantations forests fires in Niassa Province, North of Mozambique. Afr. J. Agric. Res. 8(45):5685-5692.
Mueller TG, Pierce FJ, Schabenberger O, Warncke DD (2001). Map quality for site-specific fertility management. Soil Sci. Soc. Am. J 65(5):1547-1558.
Nankani G, Baxter M, Scobey R, Perumalpillai-Essex J (2006). Mozambique Agricultural Development Strategy. Stimulating Smallholder Agricultural Growth. World Bank, Technical Report No. 32416-MZ, 143 p.
Piccini C, Marchetti A, Francaviglia R (2014). Estimation of soil organic matter by geostatistical methods: Use of auxiliary information in agricultural and environmental assessment. Ecol. Indic 36:301-314. Reza SK, Sarkar D, Baruah U, Das TH (2010). Evaluation and
comparison of ordinary kriging and inverse distance weighting methods for prediction of spatial variability of some chemical parameters of Dhalai district, Tripura. Agropedology 20(1):38-48. Robinson TP, Metternicht G (2006). Testing the performance of spatial
interpolation techniques for mapping soil properties. Comput. Electron Agric. 50(2):97-108.
Rocha A, Maria R, Waite US, Cassimo UA, Falinski K, Yost R (2017). Improving grain legume yields using local Evate rock phosphate in Gùrué District, Mozambique. Afr. J. Agric. Res. 12(22):1889-1896. Shapiro SS, Wilk MB (1965). An analysis of variance test for normality
(complete samples). Biometrika 52(3-4):591-611.
Souza GS, Lima JSS, Xavier AC, Rocha WSD (2010). Ordinary kriging and inverse-square-distance in espatialization in the chemical attributes of the ultisol. Sci. Agrar. 11(1):73-81.
Walker TS, Pitoro R, Tomo A, Sitoe I, Salencia C, Mahanzule R, Donovan C, Mazuze FM (2006). Priority setting for public-sector agricultural research in Mozambique with the National Agricultural Survey Data. Directorate of Training, Documentation and Technology Transfer, Institute of Agricultural Research (IIAM), Republic of Mozambique, Research Report No. 3E.
Wiatrack P, Khalilian A, Mueller J, Henderson W (2009). Applications of soil electrical conductivity in production agriculture. Better Crops Magazine 93(2):16-17.