F
ACULDADE DEE
NGENHARIA DAU
NIVERSIDADE DOP
ORTOAn Indoor Localization Solution for
Mobile Devices
Francisco Hernani Teixeira Pinto
Master in Informatics and Computing Engineering
Supervisor: António Fernando Vasconcelos Cunha Castro Coelho (Auxiliary Professor) Co-Supervisor: Jorge Alves Silva (Auxiliary Professor)
An Indoor Localization Solution for Mobile Devices
Francisco Hernani Teixeira Pinto
Master in Informatics and Computing Engineering
Approved in oral examination by the committee:
Chair: Name of the President (Auxiliary Professor)External Examiner: Jorge Gustavo Rocha (PhD)
Supervisor: António Fernando Vasconcelos Cunha Castro Coelho (Auxiliary Professor)
Abstract
Currently, the smartphones are gaining a bigger importance in the mobile device market. Along with them, new positioning and navigation technologies are being developed to work in smartphones for location-based services.
The work developed, that led to the present dissertation, had as main objective to develop a solution for indoor localization using a smartphone. The indoor localization rises many problems that were matter of an extensive research and analysis of the possible indoor localization solutions. Although the solution presented is applied and tested at a specific place, is a solution expansible to other indoor locations, given the respective maps.
The state of the art research made on the existing indoor localization options is focused on the inertial navigation systems, since the solution presented relies on methods of this type of systems. The methodology used and implementation of the solution presented will be detailed.
Resumo
Actualmente, os smartphones estão a ganhar cada vez maior importância e acolhimento no mercado das comunicações móveis. Juntamente, novas tecnologias de posicionamento e navegação móveis estão a ser desenvolvidas para smartphones em aplicações dedicadas a serviços baseados em localização. Estes serviços consistem normalmente em serviços informativos acerca de um local.
O trabalho desenvolvido, que conduziu à presente dissertação, tinha como objectivo prinicipal construir um sistema de posicionamento para recintos fechados. A localização em recintos fechados levanta vários problemas e, como tal, o estudo das opções existentes em localização indoor, como navegação inercial, serão alvo de uma revisão e análise. Este sistema de localização será um sistema expansível pelo que nesta dissertação o problema será aplicado a um local espicíco para testes.
Neste documento é feita uma análise das opções de localizaçao indoor existentes, com um aprofundamento na navegação inercial e exemplos de sistemas relacionados existentes que usam diferentes formas de localização.
Acknowledgements
First I just want to thank FEUP, the development of this project was a major step in my life that was greatly accomplished with help and encouragement by everyone. First of all, the teachers for the knowledge I could get and that will help me along my life. I specially want to thank my supervisors Prof. António Coelho e Prof. Jorge Silva for all the assistance and guidance they gave me.
I want to thank nDrive for the knowledge and support they gave me. I also give thanks to my family and friends for the support and encouragement that they always give me.
Contents
1 Introduction 1
1.1 Context and Motivation . . . 1
1.2 Objectives . . . 2
1.3 Structure of the Document . . . 2
2 State of The Art 3 2.1 Indoor Localization . . . 3
2.1.1 Pedestrian Dead Reckoning . . . 4
2.1.2 Map-Aided Positioning Systems . . . 8
2.1.3 Current Indoor Localization Systems . . . 9
2.2 Sensors on Android . . . 11 2.2.1 Accelerometers on Android . . . 12 2.2.2 Orientation on Android . . . 13 3 Methodology 15 3.1 Components . . . 15 3.2 PDR Methods . . . 16
4 A Pedestrian Dead Reckoning Solution for Indoor Localization 19 4.1 Arquitecture . . . 19
4.1.1 Map . . . 20
4.1.2 SensorsManager . . . 23
4.1.3 LocationFinder . . . 24
4.2 PDR Methods . . . 24
4.2.1 Step Detection Method . . . 26
4.2.2 Step Length Estimation Method . . . 27
4.2.3 Orientation . . . 28
4.2.4 Map-Aided Solution . . . 30
5 Tests and Results 33 5.1 Stride Calculation - Double Integral . . . 33
5.1.1 Irregular Walk . . . 33
5.1.2 Results . . . 34
5.2 Stride Calculation - Combination of Double Integral with Stride Estimation 34 5.2.1 Regular Walk . . . 34
5.2.2 Results . . . 34
CONTENTS
5.4 Map-Aided Solution . . . 36
6 Conclusions and Future Work 39
6.1 Achieved Goals . . . 39
6.2 Future Work . . . 40
List of Figures
2.1 Esquema conceptual de um acelerómetro . . . 5
2.2 Step Detection Model . . . 7
2.3 Definition of the floor plan graph in [PP10] . . . 9
2.4 Nokia ILPO system overview . . . 10
2.5 Nokia ILPO . . . 11
2.6 Zoom of Nokia ILPO interface . . . 12
2.7 Demonstration of NAVTEQ Destination Maps on a Nokia N8 . . . 12
2.8 Accelerometer axis [Eve] . . . 13
4.1 Arquitecture - Components . . . 19
4.2 Original CAD file . . . 21
4.3 Google map aligned with the shapefile layers . . . 22
4.4 Screenshot of the map in the Android application . . . 23
4.5 Sensor Test application screenshot . . . 25
4.6 Screenshot of the StepCounter app . . . 25
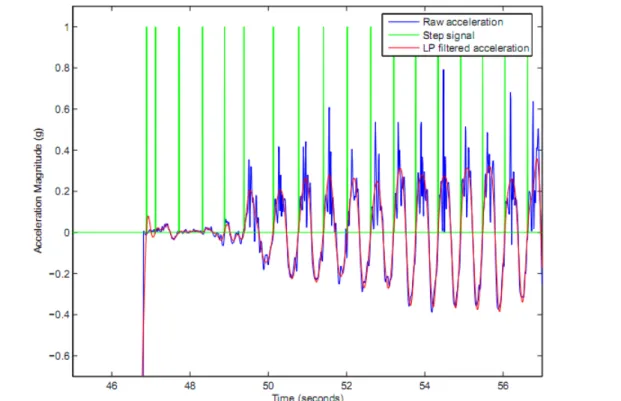
4.7 Acceleration measurements over four sequential steps, red circles repre-sent the instants where footfall recognition is triggered . . . 26
4.8 Foot parts . . . 27
4.9 Dead reckoning position determination from [JCL03] . . . 28
4.10 Magnetic interference in compass sensor . . . 29
4.11 Screenshot of the application . . . 30
4.12 Screenshot of the map-aided solution . . . 32
5.1 Screenshot of the path after the test . . . 36
5.2 Comparison between the real path (red line), PDR estimation path (blue line) and map-aided solution position estimation(blue point) . . . 37
Abbreviations
ADT Abstract Data Type
API Application Programming Interface AR Augmented Reality
CAD Computer-Aided Design
DWG Drawing
FEUP Faculdade de Engenharia da Universidade do Porto HAL Hardware Abstraction Layer
INS Inertial Navigation System OS Operative System
DR Dead Reckoning
PDR Pedestrian Dead Reckoning PNS Pedestrian Navigation System UI User Interface
VM Virtual Machine
WLAN Wireless Local Area Network
Chapter 1
Introduction
This chapter presents the scope, context and motivation of this dissertation. It also con-tains the objectives attached and the structure of the document.
1.1
Context and Motivation
With the popularization of Global Positioning System (GPS), every day the number of people using these systems grows, either with portable navigation systems (PND) or with other type of device, like smartphones. Today these positioning systems almost fully replaced other navigation methods used to find out how to reach a certain location, like maps.
However, GPS has a limitation in order to the system work; the receptor needs to be in range and in line of sight of four GPS satellites. Due to this intrinsic limitation, it’s not possible to use it indoors.
With the continuous urbanization and the rising number of buildings with great di-mensions, the GPS radius of action is becoming every day more and more restrict as the open space areas become more rare. The fact that the modern lifestyle is also becoming more sedentary is also one of the reasons for the need of a positioning system directed to closed spaces. It was estimated that we spend 90% of our time indoor [Age10].
Nevertheless, no low-cost solution is yet implemented at a global scale as the exist-ing outdoor systems. Many alternatives were equated for this problem, although many of them need an extensive installation of antennas, on the top of the building, and through signal repeaters can extend the GPS signal to a closed area. As it is expectable, a gener-alization of this concept would lead to large installation costs.
More realistic alternatives are the use of radio frequency identification (RFID) tags or wireless networks [Sys04]. These alternatives also require equipment installation in every
Introduction
building the system is intended to work. Many of the public buildings, to which this type of system would be highly directed, already have wireless networks, like WLAN, that could be used. Although, the lack of indoor maps has delayed the launch of a navigation system for indoor locations.
1.2
Objectives
The main objective of this thesis is to study the positioning techniques, based on the information provided by the accelerometer and compass which can be found in present smartphones. Through this information, make an estimation, based to dead reckoning techniques, of the current position of a device or user inside an indoor location.
During the first project phase, the study of inertial positioning techniques was mainly directed to the sensors in Android smartphones, which will be the platform for the system that is going to be developed, more precisely the model HTC Legend.
In the end of the implementation phase it was achieved a prototype capable of, through the sensors data, calculate and refresh the device current position inside a particular build-ing. After choosing the test building, another objective was to, through some modelling techniques, attain a 2D map of the place inside the application. In addition, the map was used to implement a funcionality of snapping, in order to reduce some imprecision issues, caused by the dead reckoning techniques.
1.3
Structure of the Document
The next chapter, Chapter 2, presents an overview of the existing personal navigation assistants as well as some projects, of some big brands, being developed. In this chapter is also explained the dead reckoning techniques and an introduced the sensors that will be used.
Chapter4 describes all the implementation details as the dead reckoning techniques used and the inclusion of the test place map. The tests and results of this implementation are presented in Chapter5.
The last chapter, Chapter6is a summary of the complete project, are listed the con-clusions withdrawn from the work done and the guidelines for future work.
Chapter 2
State of The Art
Along this chapter is presented the state of the art of the areas related to the objectives of this dissertation. First it is made an analysis of indoor localization methods and tech-niques, with more focus on the variant that is used in this work. Then, is taken a closer look on the current indoor localization systems, which are being released by some known brands in the mobile industry. Lastly, it is presented some guidelines on Android sensors. Throughout the all chapter, many alternatives are presented but always focusing the ones more adequate and focused the objectives proposed.
2.1
Indoor Localization
Indoor localization systems can determine the position of a user inside an indoor space. Their applicability can extend to many areas such as: location-based services, tourism and even military infantry or a guide for blind people.
Accordingly to the specific needs of indoor localization, the classic approach of GPS used in car navigation is inadequate. A system working exclusively on GPS signal is use-less indoor, since the signal is almost never available in indoor spaces. Ultra Wide Band (UWB) and Radio-Frequency Identification (RFID) are possibilities, but these systems require a dense infrastructure in order to operate.
However, there is a type of indoor localization system called Inertial Navigation Sys-tem (INS), since it uses inertial sensors, such as accelerometers and orientation sensors, to determine the positioning. A very widely used process or methodology of INS is Dead Reckoning. This methodology estimates a device position based on a previous know po-sition and speed and heading readings.
One variant of DR process is Pedestrian Dead Reckoning (PDR), adapted to the very specific nature of human walking. PDR is being used with good results, especially by
State of The Art
particular developers or in academic works, each one with different approaches to be detailed below.
2.1.1 Pedestrian Dead Reckoning
Pedestrian Dead Reckoning (PDR) is one of the techniques with more relevance in indoor localization. It is probably the technique most used in this type of problem, especially in academic works, like this one.
The PDR methodology is a relative navigation technique. Starting from a known position, successive position displacements are added up. The displacement estimates can be in the form of changes in Cartesian coordinates (i.e. x and y coordinates) or, more typically, in heading and speed or distance [HB06]. To do that, the device has integrated sensors, which will be described below.
The precision of this technique depends on many factors. The precision of the sensors used can affect heavily the precision of PDR, but the length of the path, the local of test and the physical characteristics of the user can also have a big impact on precision. Since all the papers reviewed on this subject vary in, at least, one of those aspects, there isn’t an absolute precision of this method, although some papers claim a precision bellow 6% of the distance travelled [HB06], [JCL03]. Altough this is a very good precision, it may not be enough, since the error in this method is cumulative. For many envisioned indoor positioning applications, a maximal positioning error of 5-10m (i.e. room scale) is required [Bea06].
2.1.1.1 Accelerometer
In all models and applicabilities that may come for accelerometers, its function is always the same, measurement of acceleration forces. Accelerometers use the Second Law of Newton that says that the force generated by an object is defined by its mass and accel-eration. According to [Sen10], there are many types of accelerometers, each one using different sensing elements and operation principles. Some of them will be briefly ex-plained bellow to demonstrate the possibilities in this area.
Capacitive accelerometers sense the acceleration through the changes in electrical capacitance. The sensor identifies the capacitance change between a static condition and the dynamic state.
State of The Art
MEMS-Based Accelerometers are based on mechanical devices (micro electro-mechanical systems or MEMS) that include a series of needle-like structures that detect motion, generating the readings are then transmitted to the main circuit. They are the most currently used on smartphones mainly beacause they are very compact and have very inexpensive components, which cost 2 or 3 euros per unit to manufacturers.
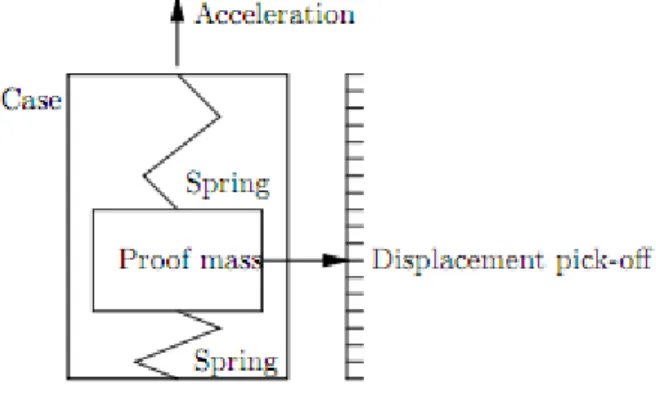
Figure 2.1: Esquema conceptual de um acelerómetro
In Figure 2.1 it is represented the conceptual scheme of the early accelerometers. The proof mass, suspended by springs, is dislocated by acceleration forces and this dis-placement is read by a unit responsible for recording these disdis-placements (disdis-placement pick-off). The gravity force influences the proof mass by an attraction force, so the accel-erations read by the accelerometer will have the opposite direction of this attraction, as we can see in Figure 2.1.
Accelerometers are sensor devices that can measure acceleration, in other words the change rate of the velocity over time, it can be defined by its magnitude and direction. Accelerometers allow to determine the motion of an object, vibrations, tilt and impacts.
The tilt determination is only possible if the accelerometer reads the total accelera-tion, which is the linear acceleraaccelera-tion, acceleration that the device is subjected, plus the gravitational force in each axis. Smartphones use 3 axis, and, more recently, 6 axis ac-celerometers. The tilt determination can have many applications in these devices; one of the more popular is the rotation of the screen between the landscape and the portrait mode, considering the device tilt.
2.1.1.2 Compass
This type of sensor measures the orientation deviation relatively to the Earth Magnetic Pole. The number of smartphones with an integrated compass is increasing.
State of The Art
This sensor is heavily affected by magnetic interferences caused by the proximity of artificial magnetic fields or some types of metals. These interferences cause the orienta-tion value to change dramatically, stabilizing some seconds after the interference is gone.
2.1.1.3 Gyroscope
Gyroscopes measure angular velocity, that can be used to determine orientation changes in a subject or object. The usage of gyroscopes is groing, one example of that, is the integration of this sensor in the new high-cost smartphones, such as iPhone 4. There are, although, some problems with the calibration of these sensors and measurement errors due to temperature dependent drifts.
2.1.1.4 Step Detection
The general methodology of PDR is, in every step occurrence, add a step length distance in the direction that the orientation sensor, like a compass, indicates, starting in a previous determined initial position.
Since the pattern of impact signal depends on type of movement (going up or down stairs, crawling, running etc.) and type of ground over which the person walks (hard or soft surface, sand), the determination of threshold is not so easy for reliable step detection [Sys04].
Another factor that influences the acceleration readings, and consequently, the step detection, is the location of the sensor. Ideally the sensor should be fixed and in a low po-sition, for example in the ankle [Sys04]. In handheld devices, for example smartphones, the impact of the step occurrences is weakened and less precise. Although, because smart-phones are becoming more popular and getting more precise sensors, a lot of research in this area was made since smartphones are a very good platform for indoor localization systems [JK01].
In this thesis, the step detection technique used was based on the one presented in patent 5583776 [TL96]. The algorithm of this patent looks for zero-crossing points (from negative to positive) in the acceleration values, between defined time intervals. These time
State of The Art
Figure 2.2: Step Detection Model
2.1.1.5 Step Length
The step length or step size can be defined as the distance between two sequential heel impacts. The step length is not a constant value. It may be affected by many factors, such as: the speed of the user, also called step frequency in PDR systems; changes in direction; the floor inclination and going up and down the stairs.
Because the stride is not a constant value, this parameter must be determined contin-uously during the walk to increase its precision. From all the research made, each author seems to have a different method for calculating the step length, but one common feature seems to be in almost every method, the average step length of the user is known.
In reference [TL96], the step length is estimated online based on a linear relationship between measured step frequency and step length.
A real-time step calibration algorithm was proposed in [GM99] using Kalman filter with GPS positioning measurement and three estimated parameters: frequency, amplitude and mean.
In the proposal of [HB06], a feed-forward neural network uses GPS estimated step lengths as input training patterns. The network is then optimized using a standard non-linear optimization technique (e.g. scaled conjugated gradients).
State of The Art
In the paper [JK01], the approach proposed is to get an estimate comparable to the current step length by calculating the numeric double integral from one footfall to another over the absolute value of the acceleration magnitude. This approach is very adequate for the problem described in this dissertation, since it doesn’t require extra equipment, like GPS, and can be implemented in the given dissertation deadline, unlike an extensive training of a neural network.
2.1.1.6 Orientation Approaches
The precision of the orientation can affect heavily the performance of a PDR system. To increase the precision of the traditional compass, some methods have been proposed combining this sensor with others.
In [HB06] it is proposed a combination of magnetic compass measurements and the path measured by GPS over ground. These signals were used individually when available and no attempt was made to systematically fuse them. This combination helped with cases where the pedestrian was side stepping, for example, since a compass gives orientation and not necessarily the direction of travel.
Another possible combination is a combination of a magnetic compass with a gy-roscope triad [JK01]. In this research the main source of heading information is the gyroscope. The compass is only used as a reference measurement. The combining of the heading of gyroscope and compass is done through a Kalman filter.
2.1.2 Map-Aided Positioning Systems
Map-aided systems are a variant of indoor localization systems in general. This approach came from the already popular personal navigation assistants (PNA) for car navigation. Currently the majority of public buildings have blueprints in a digital format. After all the research made, no standard format was found when it come to maps of buildings, so the conversion method depends from case to case, depending on the format of the digital blueprint and, of course, the desired map format.
This approach is also highly used in other indoor localization systems that use, for example, Wi-Fi, like Nokia ILPO, that will be detailed later on this chapter as other current systems. In INS systems, the map is used to reduce the precision issues from the sensors and the cumulative errors. This approach has many advantages since it increases the
State of The Art
methods, orientation and the expected error of that PDR system. The map matching is done by eliminating the particles that intersect with lines of walls. It was reported a pre-cision for this approach of 5% of the total walked distance.
Another possible approach is the construction of a connection graph of the map [PP10], like it is made in the road maps of GPS navigation assistants. It was defined a graph where connection lines correspond to a passage, like a corridor; and nodes for the intersection or end of these lines, see Figure 2.3. The use of graphs allowed to calculate with each step, the position of the user inside a certain node area. If at any time, the calculated position is outside the current node area, the system will verify if there is a valid transition to another node in the specified direction.
Figure 2.3: Definition of the floor plan graph in [PP10]
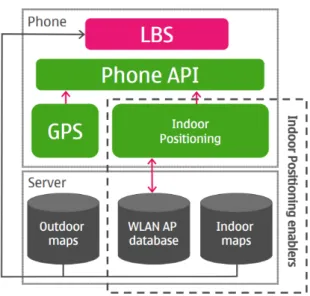
2.1.3 Current Indoor Localization Systems 2.1.3.1 Nokia ILPO - Indoor Location Positioning
Nokia, known to be always in the vanguard of mobile technology, has been developing their indoor navigation system (INS). They noticed that, even though people spend more and more time indoor, there still wasn’t any system or service of indoor positioning es-tablished in the market. A market that, along with the market of location-based services, is growing exponentially.
Their solution for the lack of GPS signal was to use the WLAN technology. This system is designed for locations with WLAN coverage; they say that it is expected to work in any of these places without any additional hardware.
In Nokia ILPO, as the system is called, the device position is calculated through a triangulation with the WLAN access points, at a known location, without being needed any configuration of these access points.
Probably the biggest obstacle for the launch of ILPO is the scalability of this product. It will be necessary a big effort in the collection and modelling of the buildings maps and ways of representing closed areas structures, like airports, which are very complex. To ease this process, Nokia offers the users the possibility of creating and sharing maps based on real buildings. Nokia considers the users’ contributions to be essential to complete this extensive task. This is a win-win situation, as it promotes the divulgation and a better
State of The Art
Figure 2.4: Nokia ILPO system overview
understanding of a new product amongst the target users, but also allows Nokia to add new maps of buildings that should be of the users’ interest, since they are the ones modelling them.
There are some issues concerning the loss of WLAN signal, especially when the build-ing has open spaces areas where there isn’t signal, and the representation of complex buildings. As it is possible to see in Figure 2.6, the map representation is in 2D. This type of representation is very simplistic and doesn’t provide the best user’s experience.
Currently, ILPO already works on over 40 places around the world, the first places to be modelled were malls, airports and colleges. The main functionalities are the indication of the user’s current location, the sharing of locations between users and the information of the location-based services available. ILPO also allows the users to add locations and points of interest (POI’s) to the system, easy integration of new buildings and an API for the creation of location-based services.
2.1.3.2 Navteq Destination Maps - Indoor
orien-State of The Art
Figure 2.5: Nokia ILPO
three-dimensional data model that includes stairs and elevators as well as recognition of different floor levels, called Z-levels.
One of the biggest advantages of this system is the amount of information about the location. It has a list of access restricted areas, important locations and a POI details that enables the search of POI associations like the search store of a certain category.
The location NAVTEQ prioritized on mapping large shopping centres in the U.S., although is planning to extend to other types of buildings. Currently, NAVTEQ Destina-tion Maps covers more than 200 of the largest shopping centres in the U.S. with plans of expansion for destinations in North America, Europe and Asia. Plans of expansion also include new functionalities, for example, seeing in real-time where a friend is or if a restaurant is full.
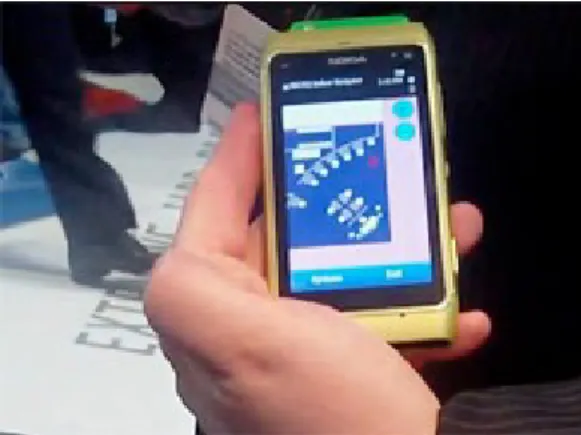
NAVTEQ didn’t yet revealed the technology and methods used to accomplish Desti-nation Maps, neither the mobile platforms that support this product, despite being demoed on a Nokia N8 (Figure 2.7).
2.2
Sensors on Android
In the majority of the current smartphones it is possible to find an acceleration and orien-tation sensor. The orienorien-tation sensor is usually a compass, although some of the high-cost smartphones already bring an integrated gyroscope. Some details, relevant for the usage of these sensors on Android, will be listed below. Most of the description in this section and more details can be found in [RM110].
State of The Art
Figure 2.6: Zoom of Nokia ILPO interface
Figure 2.7: Demonstration of NAVTEQ Destination Maps on a Nokia N8
2.2.1 Accelerometers on Android
Accelerometers, as their name suggests, are used to measure acceleration. It’s impor-tant to note that accelerometers do not measure velocity, so you can’t measure speed di-rectly based on the measurements of a single accelerometer. Instead, you need to measure changes in acceleration over time.
Acceleration is defined as the rate of change of velocity, so these sensors measure how quickly the speed of the device is changing in a given direction. Using an accelerom-eter, you can detect movement and, more usefully, the rate of change of the speed of that movement. Accelerometers are unable to differentiate between acceleration due to movement and gravity. As a result, an accelerometer detecting acceleration on the Z-axis
State of The Art
• Longitudinal: Forward or backward acceleration, where forward acceleration is positive. This represents a device flat on its back, facing up, and in portrait orientation being moved along the desk in the direction of the top of the device.
• Lateral: Sideways (left or right) acceleration, where positive values represent move-ment toward the right of the device, and negative values show movemove-ment toward the left. In the same configuration as described in longitudinal movement, positive lateral move-ment would be created by moving the device along the surface to your right.
The sensitivity and responsiveness of the hardware accelerometers will limit the accu-racy and effectiveness of its usage, but some techniques can be used to atenuate this issue, for example the use of high pass filters [Eve].
Figure 2.8: Accelerometer axis [Eve]
2.2.2 Orientation on Android
The orientation sensors are a combination of a built-in compass that provides the yaw (heading) and the accelerometers that help determine pitch and roll.
The device orientation is reported along all three dimensions:
• The heading (also bearing or yaw) is the direction the device is facing around the Z-axis, where 0/360 degrees is North, 90 degrees is East, 180 degrees is South, and 270 degrees is West.
• Pitch represents the angle of the device around the Y-axis. The tilt angle returned shows 0 degrees when the device is fl at on its back, –90 degrees when standing upright (top of device pointing at the ceiling), 90 degrees when the device is upside down, and 180/–180 degrees when the device is face down.
• The roll represents the device’s sideways tilt between –90 and 90 degrees on the X-axis. The tilt is 0 degrees when the device is flat on its back, –90 degrees when the screen faces left, and 90 degrees when the screen faces right.
Chapter 3
Methodology
This chapter presents the methodology adopted to implement a dead reckoning localiza-tion system in a smartphone Android, although this process may be replicated to another mobile operative system, with the minimal changes. First, the essential components, that this type of system should contain, will be presented. In the second section is explained how to implement the dead reckoning methods chosen in this thesis.
3.1
Components
In this section is described the proposed methodology for this type of systems. The struc-ture of this proposal contains 5 main components: a controller for the sensors, Sensors-Manager; a component that receives the data from SensorsManager and where the PDR methods are implemented; the map; a parser and a draw unit.
The SensorsManager component is responsible for turning on the necessary sensors of the device. In this case, the sensors are the accelerometer and the compass, although more recent devices may contain an integrated gyroscope, which use is highly recommended. The sensors should be switched on only when necessary and switched off when no read-ings are needed, or just when the application is closed. This is not done automatically, and the sensors can be working for a long time in background draining the battery of the device.
This component is also responsible for retrieving the values from the sensors. These values may be in an undesired format, so a study of the API may be necessary to under-stand the meaning of these values. After analysing the format of the values of the sensors, some conversions or calculations may be needed, for example, the acceleration in each axis normally is influenced by the position of the device, due to gravity, so the calculation of the norm of the acceleration is needed. If the only acceleration measured is the linear acceleration, without gravity, this may still happen due to bad callibration, very common in the accelerometers found in smartphones.
Methodology
A good methodology is to implement in this component an event listener, which trig-gers whenever there are relevant changes in the values of the sensors, performing the corresponding PDR action. Android has a class, SensorEventListener, exactly for that, it contains a function named onSensorChange. This function is called whenever the values of the sensors change, the ones that are switched on.
The map, parser and draw unit are better explained as a group of components. Most of the more recent public buildings have a digital blueprint. So, the first thing that needs to be done is to convert the blueprints of the areas where this system will work. If there is the possibility to use a spatial database to contain all the information about the map, then it should be used. For instance, POSTGIS has a set of spatial functions and data types that can help a lot processing all the spatial information, also a very common format of digital blueprints is DWG that is probably the most widely used format for CAD drawings. Also POSTGIS has a snapping function that can be used for the map-aided solution, which methodology will be detailed in the next section.
If there isn’t the possibility of using POSTGIS, like in this thesis, the proposed alter-native is to use the POSTGIS only for converting the CAD data and inserting it in spatial tables, and then copy the entries of these tables to text files. The only imperative informa-tion to be copied to the text files is the coordinates of all the necessary components of the structure of the building, the intersection points, the wall lines and the possible path lines. These text files are then included in the directory of the application and this is where the parser comes in. The information in the text files depends on the use the developer wants to give to the map. The parser should then be implemented regarding the format of the text files, to read the containing data and create the necessary classes like walls and entrance points or POI’s, that basically are a group of lines and points.
The draw unit is the component responsible to draw the map, getting the information from the already created classes. This can be easily done by using a Canvas to draw a 2d map. The Android API has specifically functions to draw lines and points that can be used to achieve the map draw with almost no effort.
3.2
PDR Methods
Methodology
constant; removing the value of this constant we easily obtain the linear acceleration. Ac-tually this value is not constant, due to the noise present in the readings of the sensor. A more correct way, to remove the acceleration caused by gravity from the acceleration measurements, is to apply a high-pass filter [Eve]. More details on how this method was implemented are presented in section 4.2.1.
The step length estimation method is, from the three main phases of PDR systems, the one where are more possibilities, all very different from each other (section 2.1.1.5). The methodology chosen was found in the article [JK01], from all the reviewed method was the only one adequate for a smartphone. The other methods required extra equipment or an extensive calibration phase. This step length method requires the linear acceleration continuous reading, such as the step detection method, and the elapsed time at each step occurrence. The current step length is obtained by the numeric double integral of the acceleration, which is the displacement, through these formulas:
v= a.dT (3.1)
x= v.dT.k (3.2)
The duration of each step (dT) is fairly easy to obtain in every mobile OS from the system clock. This method requires a calibration phase to determine the value of constant k. This can be done by arranging a path of steps of different lengths marked on the floor, recording the values obtained by this method and compare to the real values, in order to change the k value, accordingly. After a new k value is set, begins the calibration process again.
The choice of the method for orientation is based on which sensors are available. Most of the low-medium cost smartphones only have, as an orientation sensor, a digital com-pass. So, methods which require the combination of compass and gyroscope are not an option, as it happens in this thesis. However, if implementing a dead reckoning system on a higher cost smartphone with a gyroscope, the use of it is highly recommended. The combination of these two sensors gives a better precision and helps identify very effi-ciently the magnetic interferences, very common on an indoor location, specially a public one. When using only a compass to get the orientation, the big concern is the magnetic interferences which have a heavy impact in the usability of the compass. In regions where these interferences are strong, the compass becomes useless since the orientation given from this sensor is so far off the real value.
Chapter 4
A Pedestrian Dead Reckoning Solution
for Indoor Localization
4.1
Arquitecture
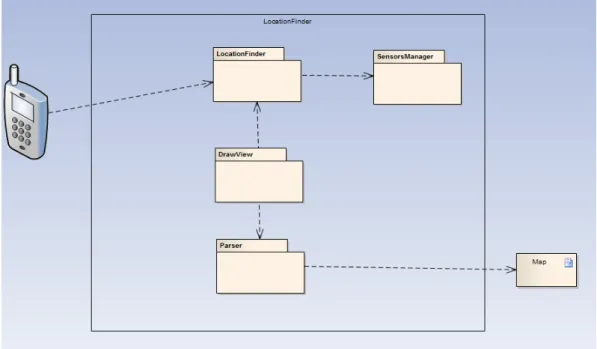
The device used for implementation and testing was the smartphone HTC Legend with the Android 2.1 Eclair OS. The general arquitecture is divided into 5 components: Sensors-Manager, LocationFinder, DrawView, Parser and the Map. In Figure 4.1 are presented the components and their respective dependencies.
A Pedestrian Dead Reckoning Solution for Indoor Localization
The SensorsManager component is responsible for the accessing and controlling all the sensors used to retrieve the sensors data. The LocationFinder component processes all the data received from the SensorsManager; it is where all the PDR methods used to find the user’s location are implemented. The DrawView component processes the information about the location and the map and draws it in a 2D view. The Parser component reads the map files and creates the structures to be drawn. The implementation of each component will be explained in detail bellow.
4.1.1 Map
For testing purposes the map implemented was the B building at FEUP. The B building is known to be the building most intensively crossed by students. It is where all the classrooms are located and the place where the application would be more usefull for most people.
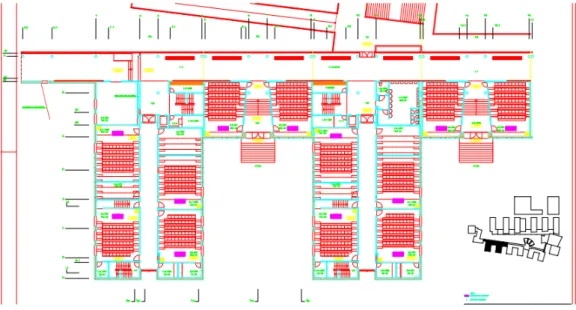
The original map files of FEUP were raw CAD files, in dwg format, each file corre-sponding to one floor. These files contain many arquitectural information but lack any kind of information about the location of the building. The first step was to complete the information about the building. Since the orientation of the user is determined by the compass, it is necessary to know the orientation of the building.
The first intent was to do that by georeferencing the map, but the conversion between a geographic coordinate system and another coordinate system, such as a cartesian one, would lead to precision issues. The device integrated compass, like most compasses in the present smartphones, can’t keep up with the level of precision necessary for this. Also this navigation system is intended to behave exactly the same at any place. Although longitude and latitude can locate exact positions on the surface of the globe, they are not uniform units of measure. Only along the equator does the distance represented by one degree of longitude approximate the distance represented by one degree of latitude [Uni10]. Also, since Earth doesn’t have a uniform shape, a variation of one degree in latitude or longitude corresponds to a distance in meters depending on the place of the Earth that this variation is measured [Sur10].
For the reasons explained above, it was decided to use a cartesian coordinate system in meters since its the most adequate measure unit when working with walking distances. Besides that, the spatial information in the CAD files was in meters. This system is
A Pedestrian Dead Reckoning Solution for Indoor Localization
classroom, that in this case isn’t important. The first step was to "clean" the CAD files and take out all the information unnecessary for the functionality of the system.
Figure 4.2: Original CAD file
The program used to remove the unnecessary information was Autodesk 3ds Max, a powerfull editing tool. Since the system is intended to be used, in this case, to nav-igate between classrooms, the only information necessary is the place and shape of the classrooms, with the corresponding entrance points, the corridors and some other points of interest. A much more cleaner indoor map was obtained after eliminating all of the unnecessary elements from the dwg file.
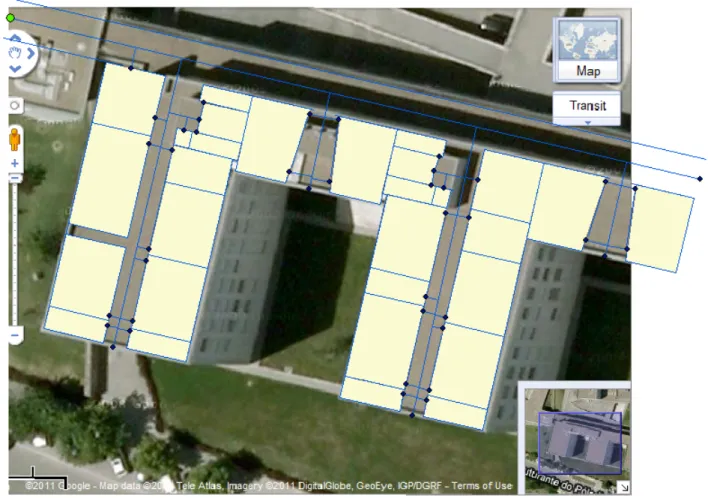
After eliminating that information, it was time to add some missing information needed to the way the system should behave, such as the path lines and the points of interest, namely the entrance points to the classrooms, stairs, elevators and exits. The program used to draw these elements was ESRI ArcMap. This program contains a large number of tools in the ArcToolbox, in this work the relevant tools are Conversion Tools, Georefer-encing Tools and Editing Tools. The Conversion Tools were used to convert the CAD files into shapefiles. Shapefiles spatially describe geometries: points, polylines, and polygons. The classrooms and other areas, like stairs and elevators, were converted into polygons and the walls to polylines. Path lines and points of interest, corresponding respectively to polylines and points, were added with the Editing Tools.
The next step was to align the obtained sketch to the right North deviation angle so that the compass data can be used. This was done using the ArcMap Georeferencing Tools. These tools allow to associate a certain point of the shapefile to the corresponding point of a real map in order to overlap the shapefile on the map. Altough the number
A Pedestrian Dead Reckoning Solution for Indoor Localization
of points necessary for this referenciation is just two, 6 control points were used for a better precision in the overlap process. The map used for this process was obtained from Google Maps. The overlapping was done to the top of the building because it was easier to detect the matching points. This doesn’t affect the final result; only the orientation of the building mattered and a new coordinate system is going to be used.
The final step was to define the coordinate system. The unit chosen was "meters" because all the spatial information was in this unit system, besides all the issues, explained above, that a geographic coordinate system would bring. The final result is shown in Figure 4.3, where the point defined as zero point, P(0,0), represented by a green point, is the entrance.
A Pedestrian Dead Reckoning Solution for Indoor Localization
Each featured class of the shapefiles (polygons, polylines and points) was converted using the shp2pgsql funcionality and copied to the corresponding POSTGIS tables. So now we had tables with all the lines and points information. With a simple SQL query, from the spatial information of each of these tables, the columns relative to the coordinates were selected and copied to a text file for each table.
The text files with these coordinates were placed inside the application directory, in the Rawfolder, in this way if the application is deleted, these files will be deleted too. It was implemented a parser that reads these files and constructs the corresponding structures and was added as well as the DrawView component, a function to draw all the elements of the map, were added. The obtained result can be seen in Figure 4.4.
Figure 4.4: Screenshot of the map in the Android application
4.1.2 SensorsManager
The SensorsManager is the component responsible for controlling all the sensors used, turning them on and off when necessary, in order to save the battery of the device. “Failing to do so can drain the battery in just a few hours” - [Man].
This component also controls the sensors events, the most important of these events being the OnSensorChanged event. This event triggers every time the values read from the sensors change. This unit analyses theses changes to call the corresponding PDR method. For instance, changes on the accelerometer values will trigger step detection and step length estimation methods but changes on the orientation and magnetic field sensors will trigger the orientation method.
A Pedestrian Dead Reckoning Solution for Indoor Localization
Another function of this component is to make sure all the sensors data passed to the LocationFinder component is coherent and in the right format or unit system, making all the conversions needed before passing the data.
4.1.3 LocationFinder
LocationFinder is the central component, the Main Activity, in Android terminology, which is called when the application is opened. It is responsible for making all compo-nents communicate with each other and is where all the PDR methods are implemented, using the data received from the SensorsManager component, and through the PDR meth-ods determine the user’s next position, passing this information to the DrawView unit, in order to constantly refresh the user’s position. All the implemented PDR methods, chosen from the ones studied in 2.1.1will be detailed below.
4.2
PDR Methods
In the beginning of the project, some Android app’s were developed in order to explore the capabilities of the smartphone sensors, to gather their output data for analysis and to perform some experiments always taking into account the objectives of the project. These app’swill be shown and explained, when appropriate, during the rest of the chapter.
The Sensor Test Application (Figure 4.5) was used to find out the available sensors in the provided smartphone, HTC Legend, and the values these sensors provided. The sensor list consisted of: an orientation sensor, which is an electronic compass; an accelerometer; a magnetic field sensor and a light sensor. The first three sensors were used during the implementation and their utility will be explained further during this chapter.
Unfortunately HTC Legend doesn’t have an integrated gyroscope which would be very handy, especially for combining it’s values with the accelerometer data for a more precise movement analysis and for the places where the electronic compass can’t be used due to magnetic interferences. This matter was explained in more detail in the section
2.1.1.2.
Another application focused on gathering the acceleration values on the three axis and testing step counting methodologies. After a quick analysis, it was noticed that these
val-A Pedestrian Dead Reckoning Solution for Indoor Localization
Figure 4.5: Sensor Test application screenshot
Figure 4.6: Screenshot of the StepCounter app
needed to hold the device. The angle how the user holds a mobile device can be very different depending on the user.
It is expected that the acceleration values on the 3 axis change accordingly to the position of the device, but the norm of the vector will be constant as long as the the device
A Pedestrian Dead Reckoning Solution for Indoor Localization
is not being submited to external forces. This value should be constant around the gravity constant value, which is approximately 9,8 m.s2.
The lack of precision and calibration in the sensors leads to values a bit different from what was expectable. What actually happened was the acceleration norm value, between the possible different positions, had deviations up to a maximum of 0,4 which didn’t allow to implement the best step counting methodologies. This matter will be explained further in this chapter.
4.2.1 Step Detection Method
The two main methods used in PDR systems that use accelerometers for step detection are: peak detection and zero crossing detection.
The peak detection method is not appropriate to detect steps because the peak of the accelerometer output is greatly affected by the user’s walking velocity [SHSH10]. This would result in a miscount of steps.
For that reason, the method chosen was the zero crossing method. To use this method, first the contribution of the force of gravity must be eliminated from the acceleration readings. This can be achieved by applying a high-pass filter [Eve].
The first thing to do was to analyze the acceleration values in the walking stance to try finding a pattern. For this, it was used an application called Sensors from the Android Developer Resources [Res], with some modifications, in order to show what was intended.
A Pedestrian Dead Reckoning Solution for Indoor Localization
Figure 4.8) touches the ground followed by a smaller peak when the front sole touches the ground, to take the next step.
Figure 4.8: Foot parts
The implemented step detection algorithm uses, as it was said, the zero crossing method with a modification. We can’t rely on the number of peaks, in each step, to be just the two mentioned above. As it is possible to see in Figure 4.7, in the third step there are three peaks. The irregular number of peaks comes from two factors: the irregular nature of the steps (it is really hard to take two identical consecutive steps) and the noise noticed in the accelerometer.
A simple high-pass filter was applied to the acceleration values to reduce the noise in the readings of the sensor. Also it was defined a time window where a step could occur, in other words, after a step occurrence it has to pass a certain amount of time until another step can be detected. This time window was set after a callibration phase. It was noticed that the test user, even in a hasty pace or running, step frequency was never higher than 2,5 steps per second, leaving minimum time window for each step of 0,4 seconds.
These two modifications to the zero crossing method help to avoid some of the false step detections, although it is impossible to avoid all the false step detections because the device is a handheld device and the user’s behavior, for example unnecessary abrupt movements, can heavily affect the performance of this method.
4.2.2 Step Length Estimation Method
The method chosen for the step length estimation is a combination of two methods. The first one uses a formula to make an estimation of the step length based on the sex and height of the user [EB]. This method is actually very used in the calibration of a pedome-ter to set one’s step length.
The second method uses the double integration of acceleration method from [JK01]. The only information about the user’s walking behavior available is the acceleration val-ues. So it was necessay to get, through these values, the positioning information. By numerically integrating the acceleration we get the speed, and by integrating the speed
A Pedestrian Dead Reckoning Solution for Indoor Localization
the result is the displacement. This is illustrated by the next two equations, where v rep-resents the velocity, a the acceleration, dT the time interval, x the displacement and k a numeric constant. As it was said in section 2.1.1.5, this method gives an estimate com-parable. For example, if x1 is the double of x2, it means that the step 1 was two times longer than the step 2. The k constant is used to adapt the result of x to a realistic step length value interval.
v= a.dT (4.1)
x= v.dT.k (4.2)
For that reason, the k constant needs to be determined. This was done through some tests that can be found in Chapter 5. Since the double integral method calculates the step length using the time spent to take that step, it was set a maximum step length calculated through this method. This was done for the cases when the user makes a pause or stops walking for some reason, in those cases this method returns an unrealistic value for the first step after that pause.
4.2.3 Orientation
This seems the more pretty straight-forward phase: gather the heading value and combine it with the stride distance value to determine the user’s position after a step (Figure 4.9). Even though, the fact that the orientation sensor was a digital compass brought some limitations.
A Pedestrian Dead Reckoning Solution for Indoor Localization
Figure 4.10: Magnetic interference in compass sensor
the right is the same application in the same device with the same orientation but now under the influence of a magnetic field. The application sends out a warning of abnormal magnetic field, when it detect a magnetic field norm value very far from the normal, but even a weak magnetic interference can make the orientation change and pass undetected. The solution implemented to solve this problem is to only update the orientation of the device when no magnetic interference is detected. The Android API has two constants to help with this detection: MAGNETIC_FIELD_EARTH_MIN and MAG-NETIC_FIELD_EARTH_MAX. If the magnetic field values aren’t within this range we are in presence of an abnormal magnetic field.
The magnetic field values, as it’s possible to see in Figure 4.5, are given in three axis. As it happens with the accelerometer, these values vary with the device position. Actually, when we take a closer look at Figure 4.5, we see that the accelerometer and the magnetometer are the same sensor. In smartphones some sensors are projected as more than one logical sensor. This is just software, however, these duplicate logical sensors use the same sensor chip but present the sensor data in different format.
Since the magnetic field values vary with the device position and represent the mag-nitude of the field, the magnetic interference is detected through the magnetic field norm calculation. The presence of an abnormal magnetic field is presented to the user by a circle on the top left corner, this circle is green turning to red when a magnetic inter-ference is felt (Figure 4.11). As said before, when under influence of a magnetic field interference, the application ignores the values from the compass. This is the only option with the available hardware in low/medium cost smartphones. More recent smartphones come with a 3 or 6 axis gyroscope that can be used alone to determine the orientation, with much better results when under magnetic perturbations, or in combination with the compass [JK01].
A Pedestrian Dead Reckoning Solution for Indoor Localization
Figure 4.11: Screenshot of the application
4.2.4 Map-Aided Solution
As was seen in section 4.1.1, the map was converted to text files, one containing all the points of the shapefile and one with all the lines, including the added lines of the path lines. This information has the following format:
• Line: P/W, StartXCoordinate, StartYCoordinate, EndXCoordinate, EndYCoordi-nate;
• Point: XCoordinate, YCoordinate;
The P/W tag, in the beginning of each line in the text file of the lines, is to indicate if the current line is a path line (P) or just a wall (W). The wall lines were only used to draw the map, while the path lines and the points were used also to construct the connection graph of the floor. In Figure 4.12 is the visual representation of the map, the gray lines
A Pedestrian Dead Reckoning Solution for Indoor Localization
( )
private class PathLine { float startX; float startY; float endX; float endY; float orientation; Point startPoint; Point endpoint; ( )
The intersection points of the path lines do not appear in the representation, to keep it as simple as possible. Although these points are present in the connection graph as in the connection method presented in 2.1.2.
The connection graph allowed reducing immensely the possibilities of the user’s posi-tion, and consequently positioning errors, restricting it only to the path lines or points of the graph, like it is made in GPS assistants where the possible positions are inside the road graph. This eliminated the cases where the path of the user crossed walls and helped with the already known magnetic interferences. Even though the zones of interferences were detected, it was noticed that sometimes the orientation was affected right before entering a detected interference zone. This happened because these weak interferences didn’t come off the range of the Earth magnetic field values.
In each step occurrence the position of the user was updated inside the path lines. To do this, in each step detection, the respective step length is added or subtracted to the current position, depending if the user’s orientation is the same of the line or the opposite. Near the intersection points, the algorithm compares the user’s orientation with the orientation of the lines adjacent to that point. If there is an adjacent path line with the same orientation as the user’s, the next position update will be made in that line. The maximum difference allowed was defined to 30o, 15o to the left and 15o to the right. If there is no valid transition, the system searches the position inside the path lines that is closer to the position calculated with PDR methods and sets that position as the current one.
A Pedestrian Dead Reckoning Solution for Indoor Localization
Chapter 5
Tests and Results
5.1
Stride Calculation - Double Integral
5.1.1 Irregular Walk
As was explained in Section4.2.2the double integration follows the equations:
v= a.dT (5.1)
x= v.dT.k (5.2)
This test was done to determine the k constant. Since the displacement (step length) is affected by each step dT, the test consisted in a irregular walk, of 4 steps (0,5m, 1m, 0,5m and 1m) that should take a noticeable diferent dT, with distances marked on the floor. By knowing the real step distances and since this method provides a estimate comparable, this test allowed to determine the best value for the k constant.
During this test was noticed that is very hard for the test subject to replicate steps, in other words, he couldn’t take two steps with the exactly same length and in the same time, even in a controlled environment. The time and step impact (norm of the acceleration value) differences in steps with the same length results, with the double integral alone, in big differences in the estimated step length. Even though, this test allowed to establish a value of 0,21 with very satisfactory results for the precision of the device, with a error of 0,105%. This value means that the estimate comparable was approximately five times bigger than the real value.
Tests and Results
5.1.2 Results
1st step 2nd step 3rd step 4th step
Real step length(m) 0,5 1 0,5 1
k = 0,25 1,15 3,16 0,63 2,72 k = 0,2 0,56 0,95 0,51 0,88 k = 0,2 0,54 0,91 0,25 0,94 k = 0,2 0,53 0,93 0,51 0,73 k = 0,2 0,57 0,94 0,51 0,74 k = 0,22 0,62 1,05 0,54 0,98 k = 0,22 0,63 0,98 0,55 0,61 k = 0,22 0,59 0,99 0,57 0,79 k = 0,21 0,58 0,99 0,57 0,99 k = 0,21 0,63 0,95 0,57 1,06 k = 0,21 0,58 0,99 0,56 0,86
5.2
Stride Calculation - Combination of Double Integral with Stride
Estimation
5.2.1 Regular Walk
This test was done after the determination of the k constant. Since the user doesn’t always take the same time to take two steps with the same length, a combination of this method with the estimation based on sex and height method was tested. The combination was made by giving different relative weights to each method.
For this test, with a user’s height of 1,70m, the estimation based on sex and height method returned a step length of 0,7055 m. In every test round, the user was asked to take 4 steps in a normal walk. At the end of each test the distance travelled was measured, since this distance is not constant.
Tests and Results
Double Integral – Pedometer Average distance Average distance % error calibration Combination measured (m) calculated (m)
Only Pedometer Calibration method 3,015 2,82 0,0652
Only Double Integral 3,025 2,35 0,223
50 – 50 3,017 3,237 0,0792
60 – 40 3,021 3,206 0,0667
70 – 30 3,033 2,966 0,0219
5.3
Orientation under Interference
As it was already discussed, one of the main threats was the digital compass being highly influenced by the magnetic interferences. In the main corridor of building B of FEUP, these interferences were very noticeable, caused specially by some pillars, spread uni-formly throughout the all corridor, due to, probably, containing some type of metal or wiring.
Although the detection of abnormal magnetic field values was successful, by a con-tinuous reading of the magnitude of the magnetic field it was impossible to know if this magnitude was inside the Earth magnetic field range, if an orientation change was caused by a movement of the user or by a disturbance. For that reason, some disturbances are detected later, after changing the orientation value, when the magnitude of the magnetic field caused by this disturbance is outside the Earth’s normal range.
The test shown in Figure 5.1was performed to test the orientation changes caused by magnetic interferences. The path taken was a straight line along all the corridor, repre-sented in the figure by a red line. The path estimated by the PDR system is reprerepre-sented by a blue line. As it is possible to see, in some points, the estimated path deviates from the real path and goes on a straight line for a while before correcting the orientation. This happens because, inside an interference area, the last orientation value that was read in a non-interference area is kept and becomes the reference value, ignoring new readings.
Besides the big deviations from the real path caused by the magnetic interferences, well noticeable in Figure 5.1, some other small deviations were identified. This happens because the sensor isn’t fixed on the user, instead is integrated in a handheld device and therefore is subjected to some rotations that result from just walking.
Despite all the deviations, the test was successful since from the tests made during the implementation (section 4.2.3) the disturbances caused by magnetic field interfer-ences could lead to deviations of more than 100o and completely ruin the PDR position estimation.
Tests and Results
Figure 5.1: Screenshot of the path after the test
5.4
Map-Aided Solution
This test was made to compare the precision between the simple PDR method and the map-aided solution, and see if there were any improvements (Figure 5.2). During this test it was noticed that the simple PDR method had a better estimation of the current position than the map-aided solution, in the first part of the test. This happened because in the map-aided solution, the position of the user moves inside the path lines which made the path longer, not allowing cutting the corners. But as the distance walked became longer the restricted path of the map-aided solution paid off and at the end of the test, the
Tests and Results
and the distance walked. After all the testing, the precision increase with the map-aided solution was approximately 15%.
Figure 5.2: Comparison between the real path (red line), PDR estimation path (blue line) and map-aided solution position estimation(blue point)
Chapter 6
Conclusions and Future Work
6.1
Achieved Goals
The number of places where indoor localization can be applied is increasing. Universities and airports are example of public locations where navigation systems and location-based services can have a great utility. The PDR methodology applied on smartphones can be a great contribute in that area, since it doesn’t require an environment change or any other technology. Even though the requirements for the proposed system to work reliably are strict, currently PDR mechanization appears to be the only choice for indoor positioning when RF-based methods are unavailable.
The precision of a PDR system depends mostly on the precision of the sensors used. The current sensors on the majority of smartphones still have precision issues and are affected by external factors. Still, as it is shown in this dissertation, an indoor localization system can be implemented in the current smartphones with satisfactory results.
Although all the objectives proposed for this project were completed successfully, it wasn’t possible to develop a system with higher precision. To do this, a combination of a gyroscope and the compass values was needed, since the biggest precision issue was the orientation of the user under a big number of interferences. Furthermore, this approach does not need external sensors, avoiding the restriction of the user’s natural movements when using a mobile device and walking indoors.
The inclusion of the map to increase the precision of the system was also success-ful. One of the biggest issue of indoor localization system is the lack of indoor maps. The presented methodology shows how new maps can be easily integrated after a simple conversion also detailed.
Conclusions and Future Work
6.2
Future Work
Tests with the PDR system that provides accurate heading showed that a high level of accuracy can be achieved. Future improvements in gyro technology may permit effective PDR use indoor. Future improvements includes augmentation with 3D map-matching algorithms with maps of different levels and with that, more accurate snapping techniques to eliminate the cumulative error.
The research has shown that a neural-network-based step-length estimation technique can have very accurate results and even though it requires an extensive training process can be very beneficial [Bea06].
This type of localization system requires extensive user experiments. These experi-ments will, not only, allowing to precisely assess how accurate the obtained position of the users is, but also, most importantly, obtain valuable data about the differences in the step patterns originated from a diverse set of users. This knowledge can give the insight on what are the best default step detection parameter values, and can be used to implement an automatic calibration method.
A particularly important parameter, which can cause a high accumulated error, and should thus be automatically adjusted, is the step size, since it varies not only between different users, but also depends on the speed and way the user is moving. A possible solution for this is to perform the calibration previously, outdoor, with the aid of GPS readings.
References
[Age10] US Environemental Protection Agency. The inside story: A guide to indoor air quality. Technical report, US Environemental Protection Agency, May 2010.
[Bea06] Stéphane Beauregard. A helmet-mounted pedestrian dead reckoning system. Technical report, TZI Technologie-Zentrum Informatik Universitat Bremen, Bremen, Germany, 2006.
[EB] Hellie T. Elizabeth Brennan. How to measure your step or stride. Bel-laOnline’s Walking Editor, http://www.bellaonline.com/articles/art39548.asp, 2011.
[Eve] Android Developers Sensor Event. http://developer.android.com/reference/ android/hardware/sensorevent.html.
[GM99] V. Gabaglio and B. Merminod. Real-time calibration of length of steps wih gps and accelerometer. Technical report, GNSS99, 1999.
[HB06] Harald Haas and Stéphane Beauregard. Pedestrian dead reckoning: A basis for personal positioning. Technical report, School of Engineering and Science International University Bremen, Germany, 2006.
[JCL03] Oleg Mezentsev Jussi Collin and Gérard Lachapelle. Indoor positioning sys-tem using accelerometry and high accuracy heading sensors. Technical report, Institute of Digital and Computer Systems, Tampere University of Technol-ogy, Finland; Department of Geomatics Engineering, University of Calgary, Canada, 2003.
[JK01] Jukka Saarinen Jani Kappi, Jari Syrjarinne. Mems-imu based pedestrian nav-igator for handheld devices. Technical report, Salt Lake City University of Technology, 2001.
[Man] Android Developers Sensor Manager. http://developer.android.com/reference/ android/hardware/sensormanager.html.
[MK10] Yoshinari Kameda Jun Ishikawa Kyota Aoki Takeshi Kurata Masakatsu Kourogi, Tomoya Ishikawa. Pedestrian dead reckoning and its applications. Technical report, University of Tsukuba, Tsukuba, Japan, 2010.
REFERENCES
[PP10] Maria Beatriz Carmo Paulo Pombinho, Ana Paula Afonso. Indoor positioning using a mobile phone with an integrated accelerometer and digital compass. Technical report, DI-FCUL, 2010.
[Res] Android Developers Resources. http://developer.android.com/resources. [RM110] Professional Android Application Development. Wiley Publishing, 2010. [Sen10] Sensr. Pratical guide to accelerometers. Technical report, Sensr, 2010. [SHSH10] C. G. Park S. H. Shin, M. S. Lee and Hyun Su Hong. Pedestrian dead
reckon-ing system with phone location awareness algorithm. Technical report, Sam-sung Electronics Co. Ltd and Seoul National University, South Korea, 2010. [Sur10] Ordnance Survey. A guide to coordinate systems in great britain. Technical
report, Ordnance Survey, 2010.
[Sys04] Journal Of Global Positioning Systems. A step, stride and heading determina-tion for the pedestrian navigadetermina-tion system. Technical report, Journal Of Global Positioning Systems, 2004.
[TL96] Judd Thomas and Robert W. Levi. Dead reckoning navigational system using accelerometer to measure foot impacts - patent nr: 5583776. Technical report, Fountain Valley CA and Anaheim CA, 1996.
[Uni10] East Caroline University. Geographic coordinate systems. Technical report, East Caroline University, 2010.
[Won11] Kevin Wong. Navteq’s destination maps provide mobile guidance through malls, outer reaches of your mind. IDG News (PCWorld), Mar 22nd 2011.
![Figure 2.3: Definition of the floor plan graph in [PP10]](https://thumb-eu.123doks.com/thumbv2/123dok_br/19175791.943121/25.892.271.656.419.520/figure-definition-floor-plan-graph-pp.webp)

![Figure 2.8: Accelerometer axis [Eve]](https://thumb-eu.123doks.com/thumbv2/123dok_br/19175791.943121/29.892.367.570.416.658/figure-accelerometer-axis-eve.webp)