The determinants of corporate cash holdings: evidence from the portuguese listed firms
74
0
0
Texto
(2) UNIVERSITY OF ALGARVE SCHOOL OF ECONOMICS. THE DETERMINANTS OF CORPORATE CASH HOLDINGS: EVIDENCE FROM THE PORTUGUESE LISTED FIRMS. FILIPA ALEXANDRA DA SILVA FERNANDES. MASTERS IN BUSINESS FINANCE. Supervisors: Luís Miguel Serra Coelho, Ph.D., School of Economics, University of Algarve Rúben Miguel Torcato Peixinho, Ph.D., School of Economics, University of Algarve November/2011.
(3) To my parents, Fernando e Julieta.
(4) CONTENTS CONTENTS ...........................................................................................................iv LIST OF TABLES .................................................................................................vi ACKNOWLEDGEMENTS ................................................................................. vii ABSTRACT ...........................................................................................................ix RESUMO ................................................................................................................x CHAPTER 1 - INTRODUCTION ..........................................................................1 CHAPTER 2 – LITERATURE REVIEW .............................................................4 2.1. Theoretical and empirical background ...........................................................4 2.1.1. Theoretical contributions ...................................................................4 2.1.1.1 The trade-off theory ..................................................................5 2.1.1.2 The pecking order theory ..........................................................5 2.1.1.3 The free cash-flow theory .........................................................6 2.1.1.4 Other theoretical aspects ...........................................................6 2.2 Empirical studies ............................................................................................8 2.3 Why study the cash holdings decisions’ of Portuguese firms? ....................... 18 CHAPTER 3 – RESEARCH DESIGN ................................................................. 21 3.1 Sample selection process .............................................................................. 21 3.2 Measuring cash holdings............................................................................... 22 3.3 Determinants of cash holdings ...................................................................... 22 3.4 The econometric model ................................................................................ 27 3.5 Estimation .................................................................................................... 28 3.5.1 Method ............................................................................................. 29 3.5.2 Panel regression ................................................................................ 29 3.5.2.1 Estimation approach................................................................ 30 3.5.2.2 General specification tests ....................................................... 31 3.5.2.3 Heteroskedasticity and autocorrelation .................................... 32 iv.
(5) 3.5.2.3.1 Heteroskedasticity.............................................................. 32 3.5.2.3.2 Autocorrelation .................................................................. 33 3.5.2.4 The Driscoll and Kraay estimator ............................................ 34 CHAPTER 4 - RESULTS ..................................................................................... 36 4.1 Descriptive statistics ..................................................................................... 36 4.2 Univariate analysis ....................................................................................... 41 4.3 Multivariate results ....................................................................................... 42 4.4 Main results .................................................................................................. 48 CHAPTER 5 – CONCLUSION, LIMITATIONS AND FURTHER WORK ..... 52 5.1 Introduction .................................................................................................. 52 5.2 Summary and implications............................................................................ 53 5.3 Limitations ................................................................................................... 56 5.4 Further work ................................................................................................. 56 REFERENCES ..................................................................................................... 58 APPENDIX ........................................................................................................... 63. v.
(6) LIST OF TABLES Table 2.1 - Determinants of firms’ cash holdings: previous empirical studies ....... 17 Table 3.1 - Sample selection process .................................................................... 21 Table 3.2 – Summary measures of the variables ................................................... 27 Table 3.3 - Number of observations per firm ........................................................ 28 Table 4.1 - Descriptive statistics ........................................................................... 38 Table 4.2 - Correlation matrix .............................................................................. 40 Table 4.3 – Firms’ characteristics by cash quartiles .............................................. 42 Table 4.4 - Model specification test...................................................................... 44 Table 4.5 - Logarithmic transformations .............................................................. 44 Table 4.6 - Model specification test after logarithmic transformation ................... 45 Table 4.7 - Multicollinearity................................................................................. 45 Table 4.8 - Poolability test ................................................................................... 46 Table 4.9 - Hausman test ..................................................................................... 46 Table 4.10 - Heteroskedasticity and autocorrelation ............................................. 47 Table 4.11 - Determinants of Portuguese cash holdings ........................................ 48. vi.
(7) ACKNOWLEDGEMENTS The present dissertation represents the end of a long adventure in my life that started seven years ago when I decided to ingress in the School of Economics of University of Algarve. Throughout this challenging journey, I have received the help and support of many people who had made this possible. First of all I would like to express my sincere gratitude to my supervisor, Professor Luís Coelho, for his expertise, unwavering support, constant guidance and inspiring discussions. I have been extremely lucky to have a supervisor who cared so much about my work, and who responded to my questions and queries so promptly. I also would like to thank my supervisor, Professor Rúben Peixinho for his constructive suggestions, which were determinant for the accomplishment of the work presented in this thesis. I would like to acknowledge all my colleagues and friends in graduate school for their support and for the fun we had during the last two years. Thank you Rute for putting me on the right path. Without you, I probably would not have met such interesting world that is Corporate Finance. Thank you Mateja, for all your valuable comments and friendship. I have enjoyed the time we spent together and I am looking forward for many more experiences in the near future. I will always be grateful to my friends and family for their support and patience throughout these years. Thank you Fábio, for your pep talks and for reminded me that there is life outside school. To my cousin, Ricardo, for sticking with me when I was grumpy and an unbearable company. To my aunt, Adelina, a special word for her incredible amount of support. The last lines are for my parents. This achievement is principally due to their sacrifice, endless encouragement and undeterred support. It is not only their support through this vii.
(8) thesis but their guidance all through my life which has brought me to this point and made me who I am today. For that, I will be forever grateful.. viii.
(9) ABSTRACT Cash plays an important role in corporations and its increase level in firms’ balance sheet has been gaining interest of financial researchers. In fact, researchers have explored the pros and cons of holding cash based on capital structure theories (The trade-off theory, the pecking order theory and the free cash-flow theory) since firms may hold cash for a diversity of reasons. My thesis contributes to this ongoing debate by exploring the determinants of Portuguese listed firms’ cash holdings. In effect, the specific characteristics of Portuguese market (economic, legal, institutional and cultural aspects) make such analysis interesting to explore. Hence, based on the abovementioned theoretical foundations and previous empirical studies, I use a sample of 75 firm-year observations in order to create an unbalanced panel model with fixed effects. After applying specific econometric tests, my results suggest that Portuguese listed firms hold less cash reserves when compared to the European and the U.S. firms. In particular, I find that dividend payout, cash-flow and size are not important to explain firms’ cash holdings decisions. Conversely, the results show that cash holdings increase with leverage and decreases with liquidity, level of financial distress and growth opportunities. Hence, such results indicate that not only, the existence of substitutes for cash reduces firms’ cash level, but also that Portuguese listed firms have a higher proportion to long-term debt. Overall, the findings in this study support mainly the trade-off and pecking order theories.. Key Words: Cash Holdings, Capital Structure Theories, Panel Data, Portuguese Listed Firms. ix.
(10) RESUMO. O presente estudo explora os determinantes dos cash holdings das empresas Portuguesas cotadas em bolsa. Os resultados sugerem que as empresas Portuguesas cotadas em bolsa detêm menos dinheiro no seu balanço do que empresas comparáveis da União Europeia e dos Estados Unidos da América.. Os resultados revelam que ainda os cash holdings aumentam com a alavancagem e diminuem com a liquidez, probabilidade de entrar em incumprimento e oportunidades de crescimento.. Por outro lado, o pagamento de dividendos, cash-flow e o tamanho não parecem ser determinantes nas decisões de cash holdings das empresas. Em geral, os resultados obtidos neste estudo encontram fundamento teórico no postulado pela trade-off e pecking-order theory.. Palavras-Chave: Cash holdings, Teorias da estrutura de capital, Dados de painel, Empresas Portuguesas cotadas em bolsa. x.
(11) CHAPTER 1 INTRODUCTION Why do firms have different propensities to hold cash? The significant increase in the level of cash in firms’ balance sheet has led financial economists to pay particular attention to this question. Dittmar and Mahrt-Smith (2005) claim that cash holdings among U.S. corporations have been steadily increasing in the recent past. According to this study, the sum of cash and marketable securities represents more than 13.0% of the total assets of the publicly traded U.S. firms. Perhaps more interestingly, Dittmar and Mahrt-Smith (2005) also note that, in the same year, the aggregate value of cash held by such firms represented approximately 10% of the annual U.S. Gross Domestic Product (GDP). A number of recent empirical studies investigate the factors influencing the level of firms’ cash holdings. Kim, Mauer and Sherman (1998) show that the percentage of cash held by U.S. firms increases with cash-flow volatility, growth opportunities and decreases with profitability. Opler, Pinkowitz, Stulz and Williamson (1999) find that firms with riskier cash-flows and strong growth opportunities hold larger amounts of cash. Ozkan and Ozkan (2004) obtain similar results when examining a sample of U.K. firms. In addition, they find a non-monotonic relation between managerial ownership and cash reserves and report a significant impact of liquid assets on cash holdings. A number of international studies (Dittmar, Marth-Smith and Servaes, 2003; Guney, Ozkan and Ozkan, 2003; Pinkowitz, Stulz and Williamson, 2003 and Ferreira and Vilela, 2004) find that a country’s legal structure influences firms’ cash holdings decisions.. 1.
(12) The previous literature mainly focuses on the U.S. or U.K. markets or, alternatively, considers international samples that include a multitude of countries. In this study, I follow a different path and examine the cash holdings’ determinants of Portuguese publicly traded firms. This allows me to add to the literature in two ways. First, I provide original evidence on the determinants of cash holdings of such firms, which are traded in a peculiar market, characterised by its small size and lack of development even by European standards. Second, I focus my attention on a country that offers a peculiar legal environment as Portugal offers investors one of the weakest levels of protection in the developed world (La Porta, Lopez-de-Silanes, Shleifer and Vishny, 1997). I investigate my key research question using an unbalanced panel of 75 firm-year observations, with data collected from 1989 to 2009. My main results can be summarized as follows. First, I find that the average Portuguese listed company holds relatively less cash than the average firm in the Economic Monetary Union (EMU) and the average U.S. firm. Second, I show that the cash holdings’ decisions of the Portuguese listed firms are significantly affected by liquidity, leverage, growth opportunities, debt maturity structure and financial distress. In particular, in line with the predictions of the trade-off theory, my results suggest that the level of cash holdings decreases as the value invested in liquid assets, which may act as substitutes of cash, increases. Additionally, I find that the percentage of cash in the balance sheet decreases with leverage (and even more so when the firm has access to long-term debt) and growth opportunities, a result in line with the predictions of the pecking order theory. Not surprisingly, I show that firms facing higher levels of financial distress hold less cash. Importantly, I find no evidence to support the view that dividend payments, cashflow and size are important determinants of the cash holdings’ decisions of Portuguese listed firms. 2.
(13) In short, and contrary to the majority of previous studies, which tend to highlight the importance of the trade-off theory, my results suggest that both the trade-off and the pecking order theory play an important role in explaining the determinants of Portuguese firms’ cash holdings. The remainder of this dissertation is as follows. Chapter 2 reviews the relevant theory and some of the extant empirical studies. Chapter 3 summarizes my research design, and discusses the empirical methods. Chapter 4 presents and discusses my results. Finally, Chapter 5 summarizes the main conclusions of this study, discusses its limitations and suggests possible avenues for further research.. 3.
(14) CHAPTER 2 LITERATURE REVIEW This chapter provides the theoretical foundations underlying the empirical work developed in the subsequent chapters. It also surveys a number of empirical studies that already shed light on the determinants of firms’ cash holdings. 2.1 Theoretical and empirical background 2.1.1 Theoretical contributions According to the seminal paper of Modigliani and Miller (1958), under the assumption of perfect capital market, the firms’ financing policy is irrelevant. The same point is emphasized by Stiglitz (1974), who shows that, in a perfect market, the market value of a firm is not influenced by its financial decisions. The key aspect in both of these papers is that, in a perfect market, firms can easily obtain external financing at a fair price. When the assumption of perfect markets is abandoned, financial decisions become important; in such alternative setting, managers can create value for shareholders simply by changing their firms’ financial mix. Several theories have been developed over the years to explain the capital structure decisions of firms, which also provide some theoretical background on what factors may influence firms’ decisions to hold cash. In the next sub-sections, I discuss three of these theories and also a number of papers that identify specific market imperfections that help explain why firms decide to hold cash in their balance sheets.. 4.
(15) 2.1.1.1 The trade-off theory According to the simplest framework of the trade-off theoy, firms have an incentive to increase their debt-to-equity ratio because this allows them to benefit from an interest tax shield, which increases shareholder value (Ogden, Jen and O’Conner, 2003, p. 157). However, financial distress and the probability of bankruptcy increase as the firms’ debt-to-equity ratio increases, suggesting having a debt level in excess of a certain threshold reduces shareholder wealth. This is the basic mechanism behind the trade-off model, which allows us to identify an optimal capital structure for a firm simply by “trading-off” the costs and benefits of debt (Myers, 1984; Shyam-Sunder and Myers, 1999 and Fama and French, 2002). The trade-off theory does not directly explain why firms decide to hold cash. Nevertheless, it seems to suggest that holding cash is important. In fact, cash is by definition the most liquid asset at the firm’s disposal. As debt increases, liquidity drops and the cost of financial distress increase. Hence, firms wishing to increase the tax benefits of debt should also build a pool of cash they can use as a safety buffer if an unexpected operational problem occurs or if macroeconomic conditions change in an adverse way (Levasseur, 1979). 2.1.1.2 The pecking order theory The pecking order theory of Myers and Majluf (1984) suggests that there is no optimum debt level for a firm. As the authors explain, the presence of asymmetric information drives firms to always prefer internal sources of financing over external sources. In such setting, the availability of internal funds allows firms to undertake investments without having to resort to external financing, which is relatively more expensive due to transaction costs, tax issues, costs of financial distress and costs 5.
(16) associated with problems of asymmetric information (Kasseeah, 2008). It follows that firms should only be willing to use external financing when internal cash-flows are insufficient to meet the financial demands of new positive Net Present Value (NPV) projects that might be explored by the firm. Hence, if this theory holds, accumulating cash generated by internal operations is crucial to ensure that firms can implement their investment policy. In fact, firms will firstly use the accumulated cash holdings and, if necessary, issue debt. 2.1.1.3 The free cash-flow theory The free cash-flow model of Jensen (1986) suggests that managers have an incentive to build up cash to increase the amount of assets under their control, which in turn increases their discretionary power over the firm investment decision (Ferreira and Vilela, 2004). This may lead to over-investment problems as managers implement projects that maximize their own utility at the expense of their shareholders’ wealth. For instance, managers may spend money on their “pet projects”, diversify acquisitions or scale expansions which, in some cases, reduce firm value. Hence, firms that have opportunistic managers will tend to have higher levels of cash holding; this allows managers to implement their value-reducing projects without the need to raise additional external funds. 2.1.1.4 Other theoretical aspects Much of the research on firm liquidity is structured around the benefits of holding cash. In fact, maintaining an appropriate level of liquidity within the organisation is fundamental for smooth operations (Opler et al., 1999). To begin with, the asymmetry of information between managers and capital markets increases the cost of external capital (Myers and Majluf, 1984; Almeida, Campello and 6.
(17) Weisbach, 2004). Smith (1986) claims that “Investors discount the value of firms when they attempt to sell risky securities”, which, in simple terms, means that firms usually have to pay a premium for issuing shares or debt. In fact, clever investors know that they are at an informational disadvantage when managers wish to raise additional external financing. Firms may reduce or eventually eliminate such cost if they have a cash pool at hand that minimizes the need to access capital markets whenever positive NPV projects are available. High-growth firms suffer from higher asymmetry of information costs since they require considerably more capital to materialize their investment opportunities (Myers and Majluf, 1984). Hence, whenever possible, such firms should hold larger amounts of cash, in order to minimize the likelihood of having to give up valuable investment opportunities (Ozkan and Ozkan, 2004). Furthermore, Myers (1977) suggests that managers of highly-levered growth firms acting in the interest of shareholders may decide not to pursue positive NPV projects. This is known as the underinvestment problem, which can be minimized or even prevented if managers can build cash reserves within the firm (Myers, 1984). Too much liquidity is also harmful for firms’ value as it can enhance agency problems between managers and shareholders. Managers which have access to excess cash may decide to engage in strategies designed to increase their own utility as the expense of shareholders’ wealth (Jensen, 1986). Corporate liquidity also reduces the likelihood of incurring financial distress costs if the firms’ operations do not generate sufficient cashflow to service obligatory debt payments (Faulkender and Wang, 2006). In fact, the financial distress literature has been focused on finding explanatory variables that have discriminatory power to differentiate financially distressed firms from financially sound companies. In a seminal paper, Altman (1968) develops the Z-score model for. 7.
(18) predicting bankruptcy by combining five different financial ratios. This model has been widely used to measure the level of financial distress in the finance field. Finally, corporate finance literature has long been interested in explaining whether firms that generate cash-flows distribute dividends. In fact, dividend policy is affected by the liquidity of the firm since it is the extra liquidity that is being returned to shareholders that make up a dividend. Firms that pay dividends tend to smooth distributions relative to earnings and when in distress, they reduce dividends rather than omit them (Lintner, 1956; DeAngelo and DeAngelo, 1990; Brav, Graham, Harvey and Michaely, 2005). 2.2 Empirical studies There has been an increase in the number of empirical studies examining the cash holdings decisions of firms in recent years and, in particular, on the firm-specific determinants of such a choice. In the next paragraphs I discuss some of the most important studies in this domain. •. Studies employing U.S. data. Kim et al. (1998) study the determinants of corporate cash holdings of U.S. firms. They view cash holdings as an investment in liquid assets that reduces firms’ dependence on costly external finance. However, such an investment is also costly as liquid assets earn a low rate of return. Using a sample of 452 U.S. firms in the period between 1975 and 1994, they find that firms tend to have an optimal amount of liquidity. In fact, cash holdings increase with the value of the market-to-book ratio and cash-flow volatility. On the other hand, cash holdings decreases with firm size, leverage and the level of financial distress. Opler et al. (1999) examine the trade-off and hierarchy views of corporate liquidity for 1,048 publicly traded U.S. firms over the 1971-1994 period. They find evidence 8.
(19) supportive of the trade-off model. In particular, large firms, which in theory have better access to capital markets, and firms with good credit ratings tend to hold less cash. Moreover, they show that managers tend to accumulate cash whenever possible. Faulkender (2002) investigate the determinants of cash holdings of small and mediumsized U.S. firms. He finds that highly levered firms and firms that foresee future difficulties in raising cash tend to hold more cash. These results are consistent with the evidence from large firms in Kim et al. (1998) and Opler et al. (1999). Notwithstanding these results, Faulkender (2002) refers that firms appear to be operating below their optimal cash position which could be explained by past difficulties in accessing capital. He also show that the cash-to-sales ratio decreases as the ownership percentage of the largest shareholder increases suggesting that agency costs are important in determining cash holdings even in small-sized firms. Drawing on Keynes (1997), who suggests that the importance of balance sheet liquidity is influenced by the financial constraints faced by firms, Almeida et al. (2004) develop a model that allows testing the effects of financial constraints on corporate policies. According to Almeida et al. (2004), liquidity management is likely to be irrelevant for firms that are unconstrained, but not for those that face important restrictions when accessing capital markets. The authors claim that firms expecting future financing constraints can respond by holding more cash. Almeida et al. (2004) investigate this issue in the context of the U.S. market. Using a number of different criteria, this study classifies firms into two groups: those that are financially constrained and those that are unconstrained. The authors report that constrained firms hold substantially more of their assets in liquid form (around 15%) than those that are unconstrained (around 8% to 9%). In addition, Almeida et al. (2004) study whether cash holdings respond to changes in cash-flow and how this related to the degree of financial constraint face by the firm. 9.
(20) They conclude that constrained firms save much more cash than their unconstrained counterparts. Custódio, Ferreira and Raposo (2005) use a panel of publicly traded non-financial U.S. firms between 1971 and 2002 to investigate to what extent business conditions affect the cash holdings decisions of financially constrained and unconstrained firms. They find that constrained firms increase cash holdings when the short-term riskless interest rate decreases but not unconstrained firms. Their results thus suggest that, contrary to unconstrained firms, constrained firms increase their cash levels during recessions. Dittmar and Mahrt-Smith (2005) examine the impact of corporate governance on firm value and whether managerial entrenchment and the lack of shareholder oversight influence both the value and the use of cash resources. Using 1,952 U.S. publicly traded firms from 1990 to 2003, Dittmar and Mahr-Smith (2005) find that holding large cash reserves is problematic only when firms are poorly governed and/or managers are poorly monitored. In effect, firms that have poor governance are more likely to waste cash resources and therefore destroy firm value. In a related study, Harford, Mansi and Maxwell (2006), examine the relation between corporate governance and firms’ cash holdings for a sample of 1,500 U.S. firms for the period from 1996 through 2004. They investigate how agency problems affect firms’ propensity to stockpile cash in the U.S.. Their results show that firms with weak shareholders rights, higher board independence and low insider ownership have smaller cash reserves than those with strong shareholders rights, less independence boards and high ownership. They also conclude that firms with weaker corporate governance have smaller cash reserves. This situation can be explained by the fact that firms with poor. 10.
(21) governance and self-interested managers might choose to spend cash quickly rather than gain flexibility through stockpiling it. Bates, Kahle and Stulz (2008), investigate the reason why U.S. firms increase their cash holdings in recent years. Using data from 1980 to 2006, Bates et al. (2008) find that the average cash ratio of their sample firms has significantly increased within such a period and conclude that this phenomenon is concentrated among firms that do not pay regular dividends. According to the authors, the increase of research and development (R&D) expenditures and cash-flow risk, as well as, a decrease in capital expenditures and fewer inventories explain the motive for such increase in the cash ratio. •. Studies employing U.K. data. Using a sample of publicly trade non-financial U.K. firms over the 1984 to 1999 period, Ozkan and Ozkan (2004) find that liquidity and leverage exercise a negative influence on firms’ cash holdings. In fact, such impact of liquidity on cash holdings decisions may indicate, according to the authors, that U.K. firms use their non-cash liquid assets as a substitute for cash holdings. On the other hand, the more highly levered a firm is, the less cash it holds. However, Ozkan and Ozkan (2004) do not find evidence that firms with more volatile cash-flows hold more cash and they cannot find a significant relation between size and cash holdings. Furthermore, the authors also examine how managerial ownership might influence firms’ cash holdings. This is particularly important in the U.K. since the country’s corporate sector is mainly characterised by insufficient external market discipline and lack of efficient monitoring by financial institutions and company boards (Ozkan and Ozkan, 2004). This provides managers with greater freedom to pursue their own interests that may include holding higher cash balances. Ozkan and Ozkan (2004) find that managerial ownership plays an important. 11.
(22) role in determine corporate cash holdings in the U.K.. In fact, they find evidence that the relation between managerial ownership and cash holdings is non-monotonic and that firms with managerial ownership between 20% and 30% have the lowest cash holdings. This is consistent with the results found by Opler et al. (1999), who find no significant influence of managerial ownership on cash holdings at higher ownership levels. •. Studies based on Japanese datasets:. Nguyen (2005) studies a sample of Japanese firms listed on the Tokyo Stock Exchange over the period of 1992 to 2002 and posits that cash balances have a precautionary motive and thus serve to reduce the volatility of operating earnings, which are used as a proxy for risk. He shows that cash holdings are negatively related to risk and positively correlated with firms’ level of risk but negatively related to industry risk. Overall, these results highlight the precautionary motive for holding cash. According to Nguyen (2005), firms in large industrial groups (Keiretsu) hold less cash and exhibit a low sensitivity to the risk of running short of funds since they can rely their shareholders and other group affiliates to provide the necessary financing. However, unaffiliated firms which cannot depend on the group’s implicit financial support hold more cash and are more sensitive to the likelihood of requiring external funding. Nguyen (2005) also shows that cash holdings decrease with the firms’ size and debt ratio while increase with firms’ profitability, growth prospects and dividend payout ratio. •. Studies employing Spanish data. García-Teruel and Martínez-Solano (2008) investigate the determinants of cash holdings of Spanish small and medium-sized firms (SMEs) for the period 1996-2001.. 12.
(23) They show that such firms’ cash holdings’ target level is higher when firms have more growth opportunities and larger cash-flows. Moreover, such target is much lower when firms have access to bank debt or other substitutes for cash. These aspects are consistent with the results found by Guney et al. (2003) and Ozkan and Ozkan (2004) for large firms. Furthermore, García-Teruel and Martínez-Solano (2008) focus on how Spanish SMEs try to adjust their cash levels. They find that SMEs’ Spanish firms tend to achieve an optimal cash level more quickly than large firms studied by Guney et al. (2003). This can be explained by the relatively higher cost for small firms of being off target, since SMEs suffer more severe information asymmetries than financial constraints and a greater likelihood of suffering financial distress.. •. Studies based on Swiss datasets:. Drobertz and Grüninger (2006) investigate the determinants of corporate cash holdings of 156 non-financial Swiss firms over the period of 1995 to 2004. They find that the median Swiss firm has substantially higher cash reserves when compared to the median of the U.S. and U.K. firms (Dittmar et al., 2003). According to Drobertz and Grüninger (2006), such result can be explained due to firms easily access to bank debt (both short and long-term debt) as a manner of financing with relatively low transaction costs. Moreover, the authors also report a non-linear relation between leverage and cash holdings as well as a negative relation between asset tangibility and cash holdings. Such negative relation can be explained by the fact that firms with assets which can easily be liquidated hold less cash to minimize the opportunity costs of holding cash (Drobertz and Grüninger, 2006). They also find that dividend payments are positively related to cash reserves, which can reflect firms’ reluctance to cut dividend payments.. 13.
(24) •. Other studies. Pinkowitz and Williamsom (2001) observe the relation between bank debt and cash holdings using a sample of Japanese firms for the period 1974-1995, a sample of German firms for the period 1984-1994 and a sample of U.S. firms for the 1971-1994 period. In the Japanese system, a main bank acts as a monitor and firms are members of large industrial groups (Keiretsu) with coordinated cross-holdings. Hence, since Japanese banks have close relations with banks, one should expect that firms would not be required to hold high levels of cash holdings as they can easily have access to bank financing if they experience a shortfall. However, Pinkowitz and Williamson (2001) find that firms in Japan have higher cash holdings than those in the U.S. or Germany. This could be explained by the fact that the banks persuaded firms to hold large amounts of cash. As the banking system weakened and its monopoly power decreased, firms are no longer accountable to banks and therefore, are forced to change their cash holdings behaviour. Put simply, if banks cannot guarantee financing, firms may have to decide to reduce their debt whilst maintaining high levels of cash for precautionary reasons. Hence, firms’ cash holdings did not change much over time but the reasons for holding cash changed over time with the weakening of the financial system. Dittmar et al. (2003) study whether shareholders’ protection rights affect firms’ cash holdings. They use accounting data for a sample of more than 11,000 firms from 45 countries for the year of 1998, and employ the shareholders’ rights index developed by La Porta, Lopez-de-Silanes, Shleifer and Vishny (1998). They find that in countries where shareholders’ protection is low, firms hold up to twice as much cash as similar firms operating in countries with higher levels of shareholder protection. This suggests that, in the case of poor shareholder protection, the factors determining corporate cash holding, such as investment opportunities and asymmetric information, become less 14.
(25) important. Moreover, it validates the free cash-flow theory which refers that holding cash reduces the pressure to perform well allowing managers to invest in projects that best suit their own interests. Guney et al. (2003) analyse firms’ cash holdings behaviour by using a sample of 3,989 firms from France, Germany, Japan and the U.K. over the period of 1983 to 2000. They find that firm specific characteristics as well as institutional and legal characteristics play a significant role in determining firms’ cash holdings. In fact, strong shareholders rights negatively impact the level of cash holdings. This is an expected result, as firms operating in countries with higher shareholder protection should have easier access to external equity and thus should decrease their reliance on internal financing. Still, a legal regime that offers creditor protection and law enforcement has the opposite effect. In addition, Guney et al. (2003) suggest that stronger creditor rights and better law enforcement that increase the likelihood of bankruptcy forces firms to increase their cash holdings. In a related study, Pinkowitz et al. (2003) investigate to what extent firms in countries with poor protection rights hold more cash. They use a sample of 35 countries characterised by poor protection rights for the period between 1988 to 1999 and find that firms in these countries hold more cash than they would if they were stationed in the U.S.. Pinkowitz et al. (2003) conclude that the precautionary motive of holding cash is valuable in explaining why countries with poorer protection rights hold more liquid assets. Ferreira and Vilela (2004) examine the determinants of corporate cash holding using a sample of 400 publicly traded firms from 12 countries for the period of 1987 to 2000. They conclude that on the one hand, cash holdings are positively influenced by the. 15.
(26) investment opportunity set and the firms’ cash-flows. On the other hand, liquidity of assets, leverage, bank debt and firm size exert a negative influence on cash holdings. Low levels of cash are held by firms in countries with superior investor protection and concentrated ownership. Overall, the empirical findings reveal that firms’ specific characteristics concerning cash holdings have a differing relation across different countries and firms’ size. Table 2.1 summarizes the main explanatory factors of the abovementioned empirical studies.. 16.
(27) Table 2.1 Determinants of firms’ cash holdings: previous empirical studies Autor. Size. Kim et al. (1998). Growth Opportunities +. Opler et al. (1999). Liquidity. Relationship with banks. Financial distress. Leverage. -. -. -. -. +. -. +. -. +. Pinkowitz and Williamsom (2001). +. -. -. -. Faulkender (2002). +. +. -. +. Dittmar et al. (2003). +. +/-. Guney et al. (2003). +/-. +/-. -. -. Debt Maturity Structure. Cash-Flow. +/-. -. -. +/-. -. +/+/-. Ferreira and Vilela (2004). +. -. -. Ozkan and Ozkan (2004). +. -. -. Custódio et al. (2005). +. -. +. Dittmar and Mahrt-Smith (2005) +. -. -. +/-. +. -. +. Bates et al. (2008). +. +/-. García-Teruel and Martínez-Solano (2008). +. -. + +. +/-. -. -. + -. -. +/-. -. -. +/-. Drobertz and Grüninger (2006) Harford et al. (2006). -. -. Pinkowitz et al. (2003). Nguyen (2005). Dividends. -. 17. +. -. +. -. +. +. + +. +. +/-. -. +.
(28) 2.3 Why study the cash holdings decisions’ of Portuguese firms? The present study investigates the determinants of cash holdings of Portuguese publicly traded firms. Studying such firms allows me to add to the literature on this topic for several reasons. First, and to the best of my knowledge, no recent study has addressed the cash holdings’ decisions of Portuguese publicly listed firms, with the exception of Dittmar et al. (2003) and Ferreira and Vilela (2004), who consider international samples. Second, Portugal has unique economic, legal, institutional and cultural aspects that are interesting on their own right. For instance, since 2000, Portugal has lost economic ground relative to the rest of the European Union (EU) countries. Eurostat refers that the 2008 Portuguese Gross domestic Product (GDP) per capita stood at 77.3 purchasing power standards (PPS) as compared to the EU-27 average of 100 PPS, leaving the country in last place among its Western European counterparts1. Currently, Portugal is one of the most problematic countries within the EU area, suffering from very low GDP growth, low productivity growth, increasing unemployment and large external and fiscal deficits. The International Monetary Fund (IMF) reports that from 2000 to 2010, Portugal’s nominal GDP grew at an average annual rate of only 3.4%, which is one of the slowest per annum growth rates among the countries in the euro area 2. The current outlook for the Portuguese economy is also not very optimistic. In fact, the projections results disclose by Banco de Portugal indicate a 1.4% contraction of the economy activity in 2011 followed by a GDP growth rate of only 0.3% in 2012 3.. 1. See http://ec.europa.eu/economy_finance/publications/occasional_paper/2010/pdf/ocp74_fiches_en.pdf for details. See http://www.imf.org/external/pubs/ft/weo/2010/01/ for details. 3 See http://www.bportugal.pt/en-US/EstudosEconomicos/Publicacoes/BoletimEconomico/Publications/bol_primavera11_e.pdf for details. 2. 18.
(29) Third, the Portuguese legal system is very inefficiency and is rooted in Roman law, thus providing both shareholders and creditors with the weakest level of protection (La Porta et al., 1997). Consequently, investors are not only ill-protected but also face a legal structure that is largely unable to enforce the (weak) country’s laws. In fact, Tavares (2002) compares the legal performance of Portugal with that of other European and East Asian countries. He shows that, when compared to Spain and Greece (which also have legal systems rooted in Roman law), Portugal has a similar (or even better) performance in dimensions such as rule of Law, corruption and citizen’s access to justice. However, Portugal is well below the EU average levels of performance in all these indicators, with the most visible differences occurring in the indices of efficiency of the judicial system, corruption and contract enforcement. Moreover, Tavares (2002) shows that, in respect to creditor rights, Portugal is very similar to Greece but worse than Spain and the EU average. Fourth, the Portuguese capital market is still relatively underdeveloped. For instance, in 2008 the Euronext Stock Exchange had a total global market capitalisation of €19.8 trillion whilst the Portuguese Stock Index (PSI-20) had a market capitalisation of only €50 billion 4. Countries where capital markets are underdeveloped, the government’s accumulations of reserves may substitute for what would otherwise be private sector capital outflows (Dominguez, 2010). Put simply, in this scenario, the government acts as financial intermediary, transferring domestic savings from local uses into international capital markets. In fact, Caballero and Kirshanmurthy (2004) show that underdeveloped capital markets cause under valuation of international resources by the private sector which promotes firms to pursue excessive external borrowing and other actions that might increase their exposure to potential capital shortfalls. 4. See http://www.cmvm.pt/EN/Estudos/Study%20Reports/Documents/2010consol1807CGRA2009ENGfinalsite.pdf for details.. 19.
(30) Overall, exploring how firms operate in a country with such structural issues should enable me to contribute to the ongoing debate about which factors constraint firms’ cash holdings decisions. The following chapters are designed to investigate this issue in detail.. 20.
(31) CHAPTER 3 RESEARCH DESIGN 3.1 Sample selection process Data for this study is collected from Compustat Global database for the period 19892009. Table 3.1 summarizes my sample construction strategy. After combining the appropriate Compustat data items 5, I identify an initial sample of 726 firm-year observations. Next, drawing on the extant literature (Opler et al., 1999), I remove all financial firms (SIC codes 6000-6999) from the sample. Utility firms (SIC codes 49004999) are, however, not deleted due to sample size concerns 6. Finally, I remove firmyear observations with missing data 7. After applying these filters my final sample includes 75 firm-year observations, which correspond to 24 different firms 8. Table 3.1 Sample selection process This table shows how my final sample of 75 firm-year observations for the period between 1989 and 2009 is derived. The original sample is obtained after defining the variables using Compustat Global database. I then exclude all cases with insufficient data. N expresses the number of observations.. N Firm-year observations (original sample). 726. Firm-year observations with insufficient Compustat Data. -651. Firm-year observations (final sample). 75. 5. Appendix A contains the summarized data items. Small samples yield less accurate estimates than larger samples. According to Anselin (2010), the properties of the estimators and tests for models are based on asymptotic considerations. Hence, small samples are problematic since they lead to considerable lower power in the usual econometric tests. 7 Appendix B summarizes the number of observations dropped by variable. 8 Such firms are as following: Altri- SGPS, S.A.; CIN-Corporação Industrial do Norte, S.A.; Cofina SGPS, S.A.; Corticeira Amorim SGPS, S.A.; EDP-Energias de Portugal, S.A.; Estoril Sol SGPS, S.A.; Galp Energia SGPS, S.A.; Grupo Média Capital SGPS, S.A.; Grupo Soares da Costa SGPS, S.A.; Ibersol SGPS, S.A.; Inapa, S.A.; Jerónimo Martins SGPS, S.A.; Martifer SGPS, S.A.; MotaEngil SGPS, S.A.; Novabase SGPS, S.A.; Portucel, S.A.; Portugal Telecom SGPS, S.A.; REN-Redes Energéticas Nacionais, SGPS, S.A.; SAG Gest SGPS, S.A.; Salvador Caetano SGPS, S.A.; Semapa SGPS, S.A.; Sonae Indústria SGPS, S.A.; Sonae SGPS, S.A. and Teixeira Duarte SGPS, S.A.. 6. 21.
(32) 3.2 Measuring cash holdings The literature suggests two common measures for cash holdings. One is the ratio of cash and short-term investments to total assets (Kim et al., 1998; Ozkan and Ozkan, 2004), defined below as Cash1. The second is the ratio of cash and short-term investments to total assets minus marketable securities (Opler et al., 1999), termed Cash2. To ensure the robustness of my results and comparability with the previous studies I use both approaches to calculate the cash ratio, my key dependent variable. 3.3 Determinants of cash holdings This section summarizes a number of variables that, according to the literature, may affect firms’ cash holdings decisions. These are as follows: •. Leverage (Lev). Most studies (Kim et al., 1998; Opler et al., 1999; Ferreira and Vilela, 2004 and Ozkan and Ozkan, 2004) provide evidence in favour of a negative relation between leverage and firms’ cash holdings. This, in turn, is in line with the predictions of both the pecking order and the free cash-flow theory. The pecking order theory suggests that there is a relation between cash holdings, debt and investment. In fact, such theory indicates that as investment opportunities exceed retained earnings, debt grows. Conversely, debt decrease when investment is less than retained earnings. As such, cash holdings decrease (increase) when investment is more (less) than retained earnings. On the other hand, the free cash-flow theory claims that relatively less levered firms are less subject to monitoring, which in turns allows managers to exert more discretion in their decisions. Hence, managers of such firms have an incentive to build up cash reserves in the balance sheets so that they can pursue their own objectives. In this study, leverage is computed as a firms’ total debt divided by total shareholders’ equity (García-Teruel and 22.
(33) Martínez-Solano, 2008) and I expect to find a negative coefficient associated with such variable. •. Debt maturity structure (Ldebt). García-Teruel and Martínez-Solano (2008) claim that firms with access to long-term debt face lower refinancing risk and, consequently, are expected to be less affected by information asymmetry. Such argument is in line with the predictions of the trade-off theory, which suggests that firms with shorter debt maturities should keep higher cash levels in order to decrease the risk associated with the non-renewal of their short-term debt and to cut the costs arising from the dependence on external finance. Drawing on García-Teruel and Martínez-Solano (2008), debt maturity is proxied by the ratio of long-term debt to total debt and I expect a negative coefficient to be associated with such variable. •. Dividend payout (Divpayout). There is conflicting evidence on the relation between the dividend payout ratio and the level of cash holdings. In fact, previous research by Opler et al. (1999) shows that dividend paying firms tend to hold less cash. This argument is also supported by the trade-off theory, according to which a firm that pays dividends can easily compensate an eventual cash shortfall by reducing its dividend payments (Ferreira and Vilela, 2004). Alternatively, Dittmar et al. (2003) and Ozkan and Ozkan (2004) document a positive relation between the dividend payout and cash holdings. As the authors explain, firms rarely cut back dividends unless they are in deep financial distress. Hence, dividend paying firms may hold more cash in anticipation of the dividends that they will have to pay in the coming periods. I compute the dividend payout ratio as the ratio of total dividends to income before extraordinary items (Opler et al., 1999). 23.
(34) •. Cash-flow (Cflow). There have been conflicting theoretical predictions and empirical evidence on the impact of cash-flow on cash holdings. In general, firms should have a preference for internal over external finance in the presence of asymmetric information and signalling problems associated with external funding (Myers and Majluf, 1984). The pecking order theory supports this idea since it states that firms prefer to resort to funds created internally before routing out on the market. Accordingly, cash-generating firms should tend to accumulate cash over time to reduce their future external capital requirements. However, Kim et al. (1998) argue that cash-flow provides a readily available source of liquidity for investment and maturing liabilities, suggesting that some firms may actually choose to hold less cash if they are able to generate generous amounts of cashflow. This is consistent with the trade-off theory, given that cash-flow provides a source of liquidity that can be seen as a substitute for cash. In this study, cash-flow is computed as the ratio of income before extraordinary items plus dividends minus capital expenditure to total assets. Due to the insufficiency of data in the sample, my cash-flow measure differs from that in Opler et al. (1999), who measure cash-flow as earnings after interests, dividends and taxes plus depreciation. •. Firm size (Size). Brennan and Hughes (1991) and Collins, Rozeff and Dhaliwal (1981) suggest that larger firms are less exposed to problems of asymmetry of information and agency problems than smaller firms. Hence, larger firms should face fewer problems when trying to access external finance. In addition, such firms may keep lower cash holdings due to the existence of economies of scale in cash management (Miller and Orr, 1966). In this study, size is given by the natural logarithm of total assets (Ferreira and Vilela,. 24.
(35) 2004) and I expect to find a negative relation between such variable and the level of cash holdings. •. Liquidity (Liq). In line with previous empirical studies (Opler et al., 1999; Ferreira and Vilela, 2004; Ozkan and Ozkan, 2004 and García-Teruel and Martínez-Solano, 2008), I measure liquidity as the ratio of working capital minus cash and short-term investments to total assets. I expect a negative association between firm liquidity and the level of cash holdings as liquid assets are a natural substitute of cash. •. Level of financial distress (Z-score). I use Altman’s (1993) Z-score model to measure the level of financial distress. Firmspecific Z-scores are computed as follows: Z-score=0.717*X1 +0.847*X2 +3.107*X3 +0.420*X4 +0.998*X5. where, X1= working capital/total assets; X2= retained earnings/total assets; X3= earnings before interest and taxes/total assets; X4= total shareholders’ equity/total debt; X5= total revenue/total assets. Again, the a priori effects of this particular explanatory variable on the level of cash holdings are not clear. The empirical literature (Guney et al., 2003; Ferreira and Vilela, 2004 and Ozkan and Ozkan, 2004) suggests that firms with higher levels of financial distress may be more keen on raising their cash levels to reduce their default risk. However, Kim et al. (1998) argue that firms with a greater likelihood of financial distress have, by definition, lower levels of liquidity.. 25. (3.1).
(36) •. Growth opportunities (Growth). The value of a firm’s growth opportunities is determined as the growth rate in sales over two consecutive years. In effect, I cannot compute the traditional book-to-market ratio as the Compustat Global database does not have information on firms’ market value. I expect to find a positive coefficient associated with this variable since firms with greater growth opportunities are expected to hold more cash (García-Teruel and Martínez-Solano, 2008). This expectation is in line with the pecking order theory, which suggests that external financing should, on average, be more costly for firms with greater growth opportunities. To this point, Myers (1977) argues that growth firms face higher agency costs because firms with risky debt and greater growth opportunities are likely to pass up valuable investment opportunities. Moreover, the cost of external finance should increase as the level of information asymmetry rises. Myers and Majluf (1984) argue that the asymmetry of information between insiders and outside investors tends to be more severe for firms whose values are largely determined by growth options. Hence, in this case, firms should hold relatively more cash to avoid costly external financing and therefore the possibility that they will have to pass up valuable investment opportunities.. Table 3.2 summarizes the measures of the abovementioned dependent variable and the explanatory factors.. 26.
(37) Table 3.2 Summary measures of the variables This table shows the summary measures of the variables employed in this study. Variable. Measure. Cash1. Cash and short-term investments to total assets. Cash2. Cash and short-term investments to total assets minus marketable securities. Leverage (Lev). Total debt to total shareholders’ equity. Debt maturity structure (Ldebt). Long-term debt to total debt. Dividend payout (Divpayout). Total dividends to income before extraordinary items. Cash-flow (Cflow). Income before extraordinary items plus dividends minus capital expenditure to total assets. Firm size (Size). Natural logarithm of total assets. Liquidity (Liq). Working capital minus cash and short-term investments to total assets. Level of financial distress (Z-score). Altman’s(1993) Z-score. Growth Opportunities (Growth). Growth rate in sales over two consecutive years. 3.4 The econometric model In this section, I present my general econometric model. This is given by equation (3.2): Cashit =β1 +β 𝐿𝑒𝑣it +β3 DebtStructureit +β4 Divpayoutit +β Cflowit +β Sizeit +β7 Liqit + 2. 5. 6. +β8 Z-scoreit +β9 Growthit +eit. where, the subscript i represents the firm (cross-sectional unit) and t denotes the time period of observation (i =1,…,24 and t=1,…,20), eit is the residual term, assuming that E[eit]=0 and Var [eit]=σ2i . The dependent and independent variables are defined as above. It should be noted that my final sample is small and firms are not observed at equal frequencies. Table 3.2 clarifies this point by summarizing the number of observations per sample firm. As can be seen, there is an important imbalance in the sample, with some firms having data available for six or seven year and others only having data in. 27. (3.2).
(38) one year. Bali and Demirtas (2009) demonstrate that small sample bias is a serious concern with time-series regressions but the some does not apply to panel data methods. 9 Below I summarize how I use such methods to explore my key research question. Table 3.3 Number of observations per firm This table shows firm-year observations for the period between 1989 and 2009 by each firm. N expresses the number of observations by firm.. N Altri-SGPS, S.A. CIN-Corporação Industrial do Norte,S.A. Cofina SGPS, S.A. Corticeira Amorim SGPS, S.A. EDP-Energias de Portugal, S.A. Estoril Sol SGPS, S.A. Galp Energia SGPS, S.A. Grupo Média Capital SGPS, S.A. Grupo Soares da Costa SGPS, S.A. Ibersol SGPS,S.A. Inapa, S.A. Jerónimo Martins SGPS, S.A. Martifer SGPS, S.A. Mota-Engil SGPS, S.A. Novabase SGPS, S.A. Portucel, S.A. Portugal Telecom SGPS, S.A. REN-Redes Energéticas Nacionais, SGPS, S.A. SAG Gest SGPS, S.A. Salvador Caetano SGPS, S.A. Semapa SGPS, S.A. Sonae Indústria SGPS, S.A. Sonae SGPS, S.A. Teixeira Duarte SGPS, S.A... 2 1 6 3 5 1 7 3 4 2 1 5 2 5 1 1 2 3 6 4 3 1 4 3 75. 3.5 Estimation In the following sub-sections, I discuss the estimation strategy employed to study the cash holdings’ determinants of Portuguese listed firms 10.. 9. Using simulations and stock level data, the authors show that as the number of cross-sections used in the panel data increases, the bias in coefficient estimates becomes negligible. 10 The estimation is carried out using STATA 11.1 version.. 28.
(39) 3.5.1 Method The key modelling technique employed in this study is that of regression using panel data methods. There are several benefits from using panel data. According to Baltagi (2005), such technique allows us to: 1. Control for individual heterogeneity; 2. Use more data, obtain more variability, reduce collinearity among the variables of interest and increase the number of degrees of freedom; 3. Better study the dynamic behaviour of the variables and the relation between them; 4. Identify and measure effects that are not detectable in pure cross-section or time-series data; 5. Construct and test more complicated models than those allowed by employing purely cross-section or time-series data. Some panel datasets, especially those employing individuals or firms, usually suffer from missing data, at least for some combination of cross-sectional unit and time period(s) (Wooldridge, 2008). In my application, and as mentioned in section 3.1 and shown in Table 3.2, information is missing for some of my sample firms in certain years. This leads me to use regression techniques that account for the unbalanced nature of my dataset. 3.5.2 Panel regression Panel regression offers a variety of techniques for estimation. Below, I describe how I choose the appropriate estimation method for my particular application.. 29.
(40) 3.5.2.1 Estimation approach As mentioned by Baltagi (2005), “a panel data regression differs from a regular timeseries or cross-section regression in that it has a double subscript on its variables“. The following equation describes the one-way error component model: yit = a+Xit ×b+uit , i = 1, ..., N; t = 1, …, T. (3.3). where 𝑦𝑖𝑡 is the dependent variable, the subscript i represents the firm and t denotes the time period of observation; a is a constant term, b represents the coefficients of the regression and Xit represents the explanatory variables. A one-way error component model is used for the disturbances, uit =ui +vit. where ui is the firm-specific effect and vit denotes the remainder disturbance. The most frequently used models in panel data are the one-way fixed effects (FE) and random effects (RE) models. These models rely on the hypothesis that differences among cross-sectional units can be captured by means of an intercept term, which is specific for each cross-sectional unit. This specific intercept term is considered as a random disturbance in the RE model and as a fixed parameter in the FE model. The FE model is equivalent to applying Ordinary Least Squares (OLS) to the data transformed by subtracting the firms’ specific means from the original data (Hsiao, 2003). This procedure is called the within transformation and produces the fixed effects estimator (or within estimator). The equivalent transformation for the RE model consists of subtracting only a fraction of the firms’ specific means (Hsiao, 2003).. 30. (3.4).
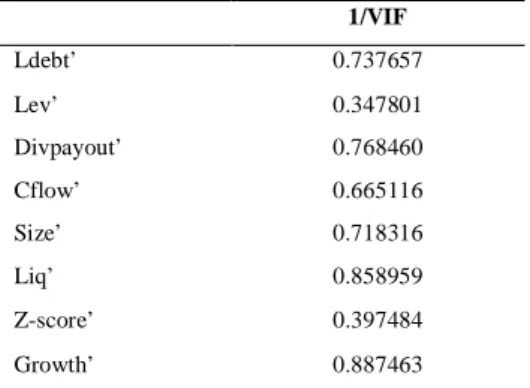
(41) 3.5.2.2 General specification tests A natural concern when using regression models is the possibility that the model is not well specified. This is a serious concern as misspecified models lead to biased estimates for the variables of interest, even when using panel data methods (Hsiao, 2003). The Ramsey Reset test is used to assess the seriousness of this situation in my application. It involves saving the predicted values from the regression function, taking the square of those values and re-estimating the model with this new variable added as an extra explanatory variable 11. A convenient way of carrying out the test is to look at either the t-ratio or the F test for the null hypothesis that the coefficient of the new variable equals zero (note that the t-ratio square equals the F test). If the model is well specified this new test variable should not be significant. My research design also accounts for the hypothetical existence of multicollinearity. When such problem occurs, the explanatory variables are not linearly independent and thus present high levels of linear correlation. This can lead to a biased and inconsistent estimation of the regression model. I formally test for the presence of serious multicollinearity using the variance inflation factor (VIF). This allows me to detect multicollinearity and also measure its effects on the precision of the estimation procedure. A tolerance of less than 0.10 (1/VIF) indicates a multicollinearity problem. I also conduct a test to examine which specification (FE, RE or pooled data) is more appropriate in my particular setting. I start by investigating if the pooled model is preferable than the one-way FE model since the question of whether to pool the data or not naturally arises with panel data. In this case, I test the hypothesis that the constant. 11. The Reset Test in Stata has a default setting based on higher order terms such as the cubed and quartic of the fitted values.. 31.
(42) terms are homogeneous (Hsiao, 2003). In particular, under the null, the constant term is the same for all individuals (all 𝑢𝑖 = 0); if this is the case, the pooled estimators are. efficient. The null hypothesis is simply a set of linear restrictions on coefficients, which can be tested using an F-test. Next, I examine if the appropriate panel model specification is in RE or FE. The RE 𝑢. model assumes that 𝐸(𝑋𝑖𝑡 )=0, which means that there is no correlation between the 𝑖𝑡. included variables and the RE. However, if 𝐸(. 𝑢𝑖𝑡. 𝑋𝑖𝑡. ) ≠ 0, then the RE estimators become. biased and inconsistent (Baltagi, 2005). In order to select the suitable estimator (FE or RE) I perform a Hausman test (Hausman, 1978). Under the null hypothesis, this statistic test follows a 𝜒𝑘2 distribution, where k represents the number of explanatory variables.. Rejection of the null suggests that the individual effects are correlated with other variables in the model. In this case, we should use the FE specification. 3.5.2.3 Heteroskedasticity and autocorrelation A problem that normally arises when estimating panel data is the existence of heteroskedasticity and autocorrelation. This section discusses the background and implications of such problems in the estimation of my panel model. 3.5.2.3.1 Heteroskedasticity The standard error component model given by equations (3.3) and (3.4) assumes that the regression disturbances are homoskedastic, i.e., that the variance is constant across time and individuals. However, this may be a restrictive assumption for panels, where the cross-sectional units may be of varying size and, as a result, may exhibit different variation (Baltagi, 2005). However, if heteroskedasticity is, in fact an issue, the usual. 32.
(43) standard errors of the estimates will be biased and the regression coefficients’ will be inefficient. In order to examine the possible presence of groupwise heteroskedasticity in the residuals of a fixed-effect regression model, I use the modified Wald test proposed by Baum (2001). The null hypothesis is that 𝜎𝑖2 = 𝜎 2 for i = 1,..., Ng, where Ng is the. number of cross-sectional units. The resulting test statistic is distributed chi-squared under the null hypothesis of homoskedasticity. 3.5.2.3.2 Autocorrelation. Ignoring serial correlation can also lead to serious problems. In fact, serial correlation in panel data models biases the standard errors causing the results to be less efficient (Baltagi, 2005). I employ an autocorrelation test, using the method proposed by Wooldridge (2002) in order to test for the presence of serial autocorrelation. Wooldridge’s (2002) procedure uses the residual from a regression in first-differences. According to Drukker (2003), first differencing the data removes the individual level effect, the term based on the time-invariant covariates and the constant, yit -yit-1 = (Xit -Xit-1 )×b+εit -εit-1 ∆yit = ∆Xit ×b+∆εit. where, ∆ is the first-difference operator; yit is the dependent variable, the subscript i represents the firm and t denotes the time period of observation; b represents the coefficients of the regression, Xit represents the explanatory variables εit is the idiosyncratic error. As Drukker (2003) points out, Wooldridge’s method begins by regressing ∆𝑦𝑖𝑡 on ∆𝑋𝑖𝑡. and obtaining the residuals 𝑒̂𝑖𝑡 . However, if the 𝜀𝑖𝑡 is not serially correlated then Corr 33. (3.5). (3.6).
(44) (∆𝜀𝑖𝑡 , ∆𝜀𝑖𝑡−1 ) =-0.5. Hence, the procedure regresses the residuals 𝑒̂𝑖𝑡 from the regression. with the first-differences variables on their lags testing that the coefficient on the lagged. residuals is equal to -0.5. To account for serial correlation in the regression of 𝑒̂𝑖𝑡 on 𝑒̂𝑖𝑡−1 the variance component estimation (VCE) is adjusted for clustering at the panel. level. Since cluster implies robustness, this test is also robust to conditional heteroskdasticity. Thus, I perform Wooldridge (2002) autocorrelation test, using the method proposed by Drukker (2003). Such test uses the residual from the regression in the first-difference, i.e., it assumes the non-existence of first order autocorrelation as the null hypothesis. 3.5.2.4 The Driscoll and Kraay estimator As mentioned in the above sub-section, accounting for cross-sectional dependence is crucial in order to obtain consistent estimates of the standard errors of the regression parameters. Clearly, any statistical inference that does not take this issue into consideration is invalid. Standard estimators such as that of White (1980) or Newey and West (1987) are useful to correct for heteroskedasticity and autocorrelation but fail to account for crosssectional correlation. Fortunately, Driscoll and Kraay (1998) have shown, relying on large T-asymptotics, that the standard nonparametric time series covariance matrix estimator can be modified such that it is robust to very general form of cross-sectional as well as temporal dependence (Hoechle, 2007). In their approach, they adjust the standard errors using a Newey and West (1987) type correction to the sequence of cross-section moment conditions which ensures that the covariance matrix estimator is consistent, independent of cross sectional dimension. In fact, Hoechle (2007) state that,. “Driscoll and Kraay (1998) estimator, eliminates the deficiencies of other large T. 34.
(45) consistent covariance matrix estimators such as the Parks-Kmenta or the panel corrected standard errors (PCSE) approach which typically become inappropriate when the cross-sectional dimension N of a microeconometric panel gets large” 12. This is a desirable property in my particular setting, given the fact that I use only 24 crosssectional units. Moreover, Hoechle (2007) 13 adjusts the Driscoll and Kraay (1998) estimator for the specific case of unbalanced panels. The error structure is assumed to be heteroskedasticity, autocorrelated up to some lag and possibly correlated between the firms. After defining the correct estimation methods and controlling for the presence of possible inconsistency of the standard errors, my final model is given by the following expression: Cashit =β1 +β2 Levit +β3 DebtStructureit +β4 Divpayoutit +β5 Cflowit +β6 Sizeit +β7 Liqit + +β8 Z-scoreit +β9 Growthit +ui +eit. where, the subscript i represents the firm (cross-sectional unit) and t denotes the time period of observation (i=1,…, 24, and t=1,…,20); ui is firm specific effect and, by assumption, eit is a random error, assumed to be E[eit ]=0 and E [e2it ]=σ2e . The dependent and independent variables are defined as in sub-sections 3.2 and 3.3.. 12 According to Hoechle (2007), Parks-Kmenta and other large t-asymptotics become unviable with large N relative to T because obtaining a nonsingular estimate of NxN matrix of cross-sectional covariances when T<N is impossible. 13 The STATA program implemented by Hoechle (2007) estimates a fixed effects (within) regression model with Driscoll and Kraay procedure.. 35. (3.7).
(46) CHAPTER 4 RESULTS 4.1 Descriptive statistics Summary statistics for my two measures of cash holdings and explanatory variables are shown in Table 4.1. I find that the average ratio of cash to assets (Cash1) is 6.3%, whilst for the case of Cash2, the parallel figure is 8.4%. These figures are very similar to those reported by García-Teruel and Martínez-Solano (2004) for Spanish small and mediumsized firms (SMEs) but contradict the findings of Opler et al. (1999), who obtain a mean cash ratio of 17.0% for U.S. firms. Moreover, the value for Cash2 is lower than that reported by Ferreira and Vilela (2004) for European firms 14. To be specific, the authors find that EMU corporations hold, on average, 15.0% of total assets in cash or cash equivalents. Nevertheless, Ferreira and Vilela (2004) do report that the average Portuguese firm has a cash ratio of 5.1% 15. Panel A of Table 4.1 also reports the median values for Cash1 and Cash2: 3.96% and 4.12%, respectively. These are also different from those reported for the median U.S. and U.K. firms: 8.1% and 6.4%, respectively (Dittmar et al. 2003). Clearly, my univariate analysis suggests that Portuguese listed firms tend to hold less cash than comparable firms in other countries. As a robustness check, in panel B of Table 4.1, I summarize the average cash ratio by firm. As can be seen, there is a large variability in the value of cash holdings for Portuguese firms. For instance, Cofina SGPS, S.A. and SAG Gest SGPS, S.A., have an. 14. Ferreira and Vilela (2004) defined cash as in Opler et al. (1999), which correspond to my Cash2 measure. Such difference may be related to sample size differences. Note that Ferreira and Vilela (2004) report a total of 189 firm-year observations.. 15. 36.
(47) average Cash2 of 48.9% and 34.5%, respectively 16. Conversely, Inapa, S.A. and Corticeira Amorim SGPS, S.A. present parallel figures of 0.8% and 1.1%, respectively. Panel A of Table 4.1 also shows that Portuguese firms are highly leveraged, with a debt ratio that exceeds 2.75 times the value of shareholders’ equity. Moreover, most of firms’ debt is long-term, representing 66.0% of the total debt and the payout ratio is relatively high (mean = 57.0%; median = 47.2%). This high propensity to pay dividends and debt structure suggests that our sample firms are generally mature. Panel A of Table 4.1 also show that our sample firms are likely to turn to external sources to fund future investments since the mean cash-flow is negative. Firms’ average liquidity is also negative, suggesting potential problems in meeting firms’ short-term debt and therefore, more likely to experience financial distress. Finally, there is evidence that, on average, Portuguese sample firms are highly distress (Z-score=1.46)17.. 16. Note that Cash2 is computed as in Opler et al. (1999). According to Altman’s (1993) model bankruptcy is not likely when the Z-score value is 3.0 or above; the opposite applies if the Z-score value is 1.8 or less. A “grey” area exists when the Z-score is between 1.8 and 3.0. Note that I apply Altman’s (1993) Z-score to Portuguese firms, although such model was designed explicitly for U.S. firms. 17. 37.
(48) Table 4.1 Descriptive statistics Panel A: Descriptive statistics Panel A reports descriptive statistics for 75 firm year-observations between 1989 and 2009. Cash1 is the ratio of cash and short term investments to total assets; Cash2 is the ratio of cash and short term investments divided by total assets minus marketable securities; Ldebt is debt maturity structure as the ratio of long-term debt to total debt; Lev is leverage measure as total debt divided by total shareholders’ equity; Divpayout is dividend payout define as the ratio of total dividends to income before extraordinary items; Cflow is the cash-flow compute as income before extraordinary items plus common dividends plus dividends minus capital expenditures over total assets; Size is computed as the total assets’ natural logarithm; Liq is the liquidity structure, defined as the ratio of working capital minus cash and short term investments divided by total assets; Z-score measures financial distress, computed as in Altman’s (1993); Growth is growth opportunities, compute as the ratio between Sales1 and Sales0 minus one. Variable. Obs.. Median. Perc10. Perc90. Std. Dev.. Cash1. 75. 0.063. Mean. 0.039. 0.013. 0.110. 0.087. Cash2. 75. 0.084. 0.041. 0.013. 0.124. 0.190. Ldebt. 75. 0.656. 0.706. 0.413. 0.892. 0.226. Lev. 75. 2.746. 1.829. 0.667. 5.625. 3.477. Divpayout. 75. 0.574. 0.472. 0.120. 0.868. 0.681. Cflow. 75. -0.010. 0.003. -0.076. 0.042. 0.057. Size. 75. 7.427. 7.459. 5.801. 8.929. 1.426. Liq. 75. -0.081. -0.073. -0.273. 0.063. 0.149. Z-score. 75. 1.461. 1.182. 0.677. 2.393. 0.957. Growth. 75. 0.075. 0.052. -0.108. 0.280. 0.192. Panel B: Mean values of cash holdings per firm Panel B reports the mean values of cash for the 24 firms between 1989 and 2009. Cash1 is the ratio of cash and short term investments to total assets; Cash2 is the ratio of cash and short term investments divided by total assets minus marketable securities; N is the number of observations per firm. Firms. N. Cash1. Cash2. Altri-SGPS, S.A. CIN-Corporação Industrial do Norte,S.A. Cofina SGPS, S.A. Corticeira Amorim SGPS, S.A. EDP-Energias de Portugal, S.A. Estoril Sol SGPS, S.A. Galp Energia SGPS, S.A. Grupo Média Capital SGPS, S.A. Grupo Soares da Costa SGPS, S.A. Ibersol SGPS,S.A. Inapa, S.A. Jerónimo Martins SGPS, S.A. Martifer SGPS, S.A. Mota-Engil SGPS, S.A. Novabase SGPS, S.A. Portucel, S.A. Portugal Telecom SGPS, S.A. REN-Redes Energéticas Nacionais, SGPS, S.A. SAG Gest SGPS, S.A. Salvador Caetano SGPS, S.A. Semapa SGPS, S.A. Sonae Indústria SGPS, S.A. Sonae SGPS, S.A. Teixeira Duarte SGPS, S.A.. 2 1 6 3 5 1 7 3 4 2 1 5 2 5 1 1 2 3 6 4 3 1 4 3. 0.081 0.096 0.264 0.011 0.035 0.036 0.029 0.025 0.050 0.040 0.008 0.073 0.017 0.046 0.128 0.117 0.089 0.014 0.033 0.046 0.075 0.030 0.056 0.035. 0.091 0.106 0.489 0.011 0.037 0.038 0.030 0.026 0.053 0.042 0.008 0.078 0.018 0.048 0.147 0.133 0.097 0.015 0.345 0.049 0.083 0.031 0.060 0.036. 75. 38.
Imagem


Documentos relacionados
In order to assess the thermo-mechanical behaviour of the hybrid mould, three different sets of moulding runs were performed, varying the core material: steel, Prometal
A referente pesquisa de campo foi realizada com professores e alunos de 6º a 9º ano do ensino fundamental na escola municipal Instituto Educacional “Cônego Nestor de Carvalho
El presente artículo muestra el uso del cine como instrumento didáctico y recuperación de la memoria cultural perdida; en este caso, de las aportaciones de George Meliès al
Na relação com as pessoas significativas que povoam a nossa vida não se pode, na perspectiva existencial, deixar de meditar no livro “Gjentagelse” 2 de Kierkegaard, que nos relata
Se considerássemos que não havia nenhum custo associado às mais-valias geradas no âmbito de uma atividade empresarial, não era possível enquadrá-las no regime
Podem considerar-se no contexto das limitações deste estudo e de possíveis factores de enviesamento, por exemplo: o facto da amostra se restringir a 40 elementos (em função
Por- tanto, com o principal objetivo de configurar a Educação Física também como uma das impor- tantes ciências inseridas na área de linguagens hu- manas, o estudo focaliza a
O artigo terá como base fontes primárias, pois utilizará dados e fatos relatados pela mídia oficial acerca dos acontecimentos ocorridos durante a crise de refugiados, a
