Pattern Recognition Letters
journal homepage: www.elsevier.com
Analysis of Human Tissue Densities: A new approach to extract features from medical
images
Pedro P. Rebouc¸as Filhoa, Elizˆangela de S. Rebouc¸asa, Leandro B. Marinhoa, R´oger M. Sarmentoa, Jo˜ao Manuel R. S. Tavaresb,
Victor Hugo C. de Albuquerquec,∗∗
aInstituto Federal de Educa¸c˜ao, Ciˆencia e Tecnologia do Cear´a, Brazil
bInstituto de Ciˆencia e Inova¸c˜ao em Engenharia Mecˆanica e Engenharia Industrial, Departamento de Engenharia Mecˆanica, Faculdade de Engenharia,
Universidade do Porto, Porto, Portugal
cPrograma de P´os-Gradua¸c˜ao em Inform´atica Aplicada, Laboratrio de Bioinformtica, Universidade de Fortaleza, Fortaleza, Cear´a, Brazil
ABSTRACT
Identification of diseases based on processing and analysis of medical images is of great importance for medical doctors to assist them in their decision making. In this work, a new feature extraction method based on human tissue density patterns, named Analysis of Human Tissue Densities (AHTD) is presented. The proposed method uses radiological densities of human tissues in Hounsfield Units to tackle the extraction of suitable features from medical images. This new method was compared against: the Gray Level Co-occurrence Matrix, Hu’s moments, Statistical moments, Zernike’s mo-ments, Elliptic Fourier features, Tamura’s features and the Statistical Co-occurrence Matrix. Four machine learning classifiers were applied to each feature extractor for two CT image datasets:, one to classify lung disease in CT images of the thorax and the other to classify stroke in CT images of the brain. The attributes were extracted from the lung images in 5.2 milliseconds and obtained an accu-racy of 99.01% for the detection and classification of lung diseases, while the attributes from the brain images were extracted in 3.8 milliseconds and obtained an accuracy of 98.81% for the detection and classification of stroke. These results show that the proposed method can be used to classify diseases in medical images, and can be used in real-time applications due to its fast extraction time of suitable attributes.
c
⃝ 2017 Elsevier Ltd. All rights reserved.
1. Introduction
Identification of diseases using techniques of processing and analysis of medical images is nowadays of great importance to assist medical doctors in making accurate diagnoses. Con-sequently, various studies aiming to extract representative in-formation from medical images in order to identify diseases have been developed. In [1], structural imaging biomarkers were proposed to predict the progression of Alzheimer’s dis-ease; in [2], textural features are extracted from multimodal MRI to compute a Prognostic value for glioblastoma; in [3], 3D lung fissures are identified in Computed Tomography (CT)
∗∗Corresponding author:
e-mail: [email protected] (Victor Hugo C. de
Albuquerque)
images based on texture; in [4], a generalized framework is pro-posed for medical image classification; and in [5], a Spatial In-terdependence Matrix (SIM) is applied to classify pulmonary diseases in CT images.
Computed Tomography (CT) was developed by the engineer Godfrey N. Hounsfield and the physicist Allan M. Comark in 1972. The two scientists were awarded the Nobel Prize for Medicine in 1979 [6]. Hounsfield and Cormack proved that mathematical formulae could be used in the production of im-ages with sufficient detail to aid analyses of the human body. By quantifying an X-ray beam transmitted through the human body, information concerning the body tissues is obtained, thus creating CT [7]. Each slice of the CT aims to determine the composition of a single dry body and is formed by a set of pix-els. The amount and thickness of the cuts are directly related to the pixel sizes, which influence the quality of the final image. Finer cuts produce sharper images.
Statistical moments (SM) are computed using the distribu-tion of the gray levels of an input image, and are therefore usu-ally computed from the image histogram. These characteris-tics provide a statistical description of the relationship between the different image gray levels [9]. According to [10], cen-tral moments are very important in pattern recognition. These moments are obtained from the spatial moments of a structure by referring the spatial moments relative to the centroid of the structure. The main advantage of central moments is their in-variance to translations, and can therefore, in many cases, be used to describe the shape of a structure [11].
Hu [12] proposed a theory of two-dimensional moment in-variants for planar geometric figures. The principle of Hu’s moments (HM), also known as Invariant Moments, is to allow the recognition of structures independently of their position, size and orientation. Despite their invariant properties, HM are highly dependent on the spatial resolution of the image [13]. However, many authors have applied HM as global or local fea-ture descriptors in pattern recognition problems [14].These mo-ments are often used to recognize structures in general, because of their ability to describe the shape of structures eectively [15]. Haralick [16] proposed a methodology to describe textures based on second-order statistics, where features are derived from co-occurrence matrices, which are built by counting the dierent combinations of gray levels of an image according to certain directions [16]. Gray Level Co-occurrence Matrices (GLCMs) are the basis of various statistical measures known as Haralick’s descriptors. This technique is widely used to char-acterize images in many dierent applications of pattern recog-nition [17, 18]. Texture based analysis has also been widely used in dierent image based applications, such as medical age analysis [19], visual interpretation of remote sensing im-ages [20] and image search [21].
In [22], a new set of rotation invariant features was presented. These features are the magnitudes of a set of orthogonal com-plex moments of the image known as Zernike moments (ZM). Scale and translation invariance are obtained by first normaliz-ing the image with respect to these parameters usnormaliz-ing its regular geometrical moments.
Kuhl et al. [23] presented a procedure to obtain the Fourier coecients of a chain-encoded contour. The advantage of the Elliptic Fourier features (EFF) are that they do not require inte-gration or the use of fast Fourier transform techniques, and that bounds on the accuracy of the image contour reconstruction are
provides an ecient and fast way to analyze digital images. In this paper, a new feature extraction method based on hu-man tissue density patterns, named Analysis of Huhu-man Tissue Densities (AHTD), is proposed. AHTD is based on radiological densities of human tissues in Hounsfield Units (HU) following a dedicated approach for medical images. This approach tends to increase the quality of the classification results compared to the current extraction feature methods used. The proposed method is compared against GLCM, IM, SM, ZM, EFF, TF and SCM in pattern recognition experiments using two dierent im-age databases.
The efficiency of the proposed feature extraction method was evaluated using two CT datasets: one related to brain dis-eases and the other to lung disdis-eases. Both datasets presented non-regular patterns, uneven illumination and dierent structural characteristics. These distinct CT image datasets were cho-sen because of their importance to global health. The World Health Organization (WHO) estimates that 300 million people have asthma and this disease causes about 250 thousand deaths per year worldwide [26]; also WHO reported that the number of deaths from chronic obstructive pulmonary disease (COPD) increased by 30% in 2015, and that this disease will be the third major cause of death worldwide in 2030 [27]. While for brain diseases, WHO estimated that 17.5 million people died of cardiovascular disease in 2012, which is 31% of all global deaths. Of these deaths, 6.7 million were estimated to be due to brain stroke [28]. In 2012, heart disease and stroke were among the three top causes of premature mortality in the world [29]. Hence, good results obtained with the proposed method would be a potential to improve medical diagnoses and assist in making more accurate and ecient decisions for these two major health problems.
2. Analysis of Human Tissue Densities
The concept behind the analysis of human tissue densities using the Hounsfield Units (HU) obtained from CT scanners was proposed by Rebouc¸as Filho et al. [30]. In this study, the authors proposed a decision tree based on the analysis of the neighborhood density to find the best position to initialize an active contour model, and also to decide whether objects of interest are inside or outside the lung under segmentation. Rebouc¸as Filho et al. [31] applied the same concept to achieve the same segmentation task by means of an Artificial Neural
(a) (b) (c)
(d) (e) (f) (g) (h) (i)
(j) (k) (l) (m) (n) (o)
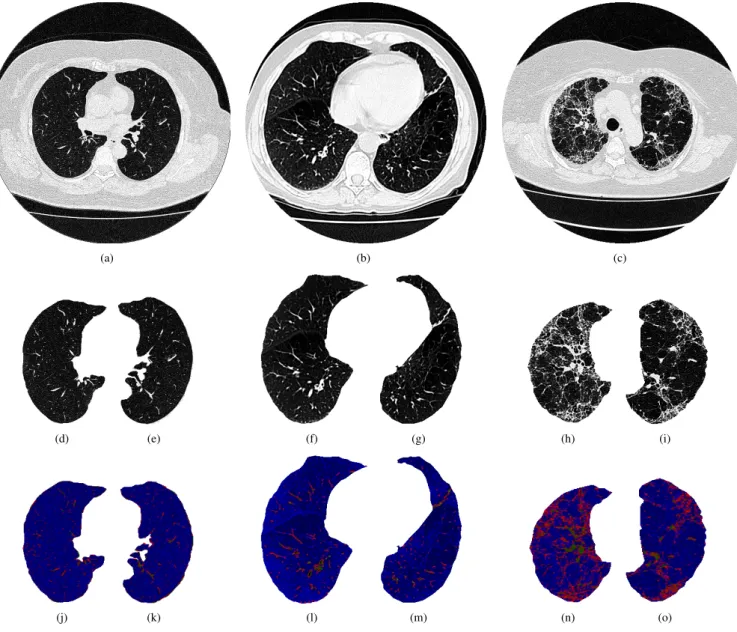
Fig. 1. Examples of the chest CT images used for diagnosing lung diseases: a)-c) original images, d)-e) healthy lungs, f)-g) lungs with emphysema, h)-i) lungs with fibrosis, and j)-o) map of AHTD lung features.
Network. The same concept was also applied to segment the airways [32] and blood vessels [33] inside the lungs in CT im-ages. Here, the same concept was used in the development of a new method to extract features from medical images based on the analysis of human tissue densities in HU, which are par-ticularly interesting for the identification and classification of diseases.
The proposed feature extraction method uses the percentages
Pi of healthy human tissues based on their density analysis in HU, according to:
Pi= f (vi) N∑−1 j=0 f (vi) , (1)
where N is the number of the tissues under analysis.
Considering a region to be analyzed previously segmented, the function that determines the number of points with densities
presented in each class viis defined as:
f (vi)= W ∑ x=0 H ∑ y=0 R(x, y), (2)
where W and H are the dimensions of the image, width and height respectively, and R(x, y) is given by:
R(x, y) =
{
1, limin f(vi)< T(x, y) < limsup(vi),
0, otherwise, (3)
where limin f(vi) and limsup(vi) are the lower and upper limits of the density range in HU for the class vi, and T (x, y) denotes each pixel of the image under analysis.
The proposed feature extraction method was applied to both CT datasets (lung and brain) using five density classes (vi) (with i varying from 0 to 4) classes. The following classes were used
for the lung CT dataset [30]: hyper-inflated air (1000 to 950 HU), normally inflated air (950 to 500 HU), low inflated air
(a) (b) (c)
(d) (e) (f)
(g) (h) (i)
(j) (k) (l)
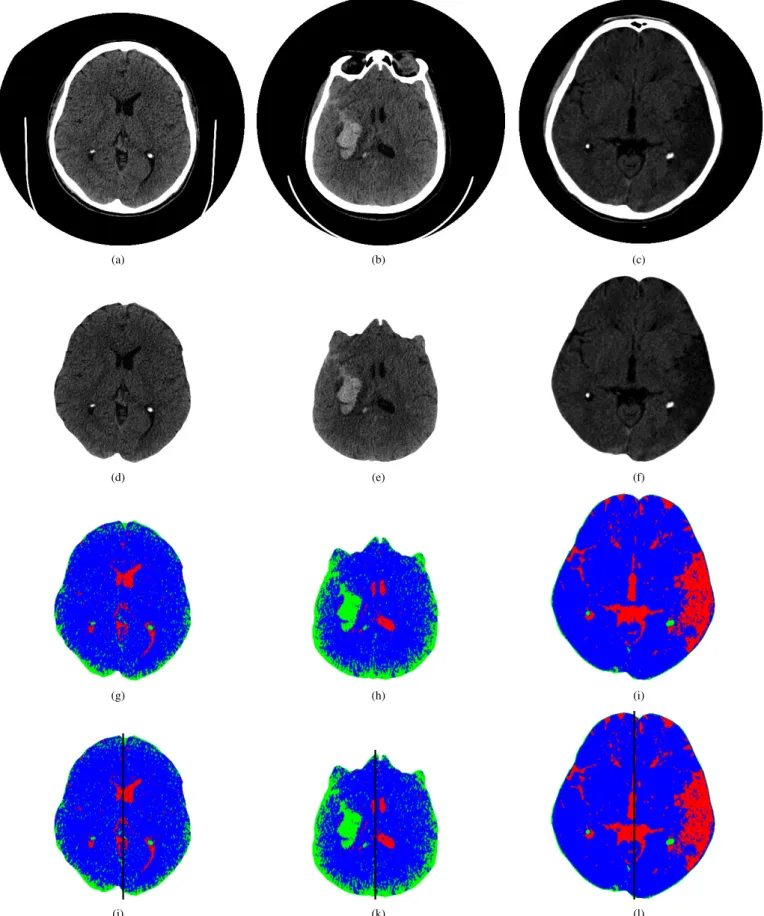
Fig. 2. Examples of the CT brain images used for diagnosing brain diseases: a)-c) original images, d) healthy brain, e) brain with hemorrhagic stroke, f) brain with ischemic stroke, g)-i) maps of AHTD brain features, and j)-l) brains divided into two regions of interest (ROIs).
defined as [34]: blood (56 to 76 HU), bone (200 to 2000 HU), brain spinal fluid (−5 to 5 HU), brain white matter (23 to 34 HU) and brain gray matter (32 to 41 HU).
To introduce the features extracted by the proposed method, the third row in the Figs. 1 and 2 show the lung and brain AHTD distribution maps, respectively. The AHT D maps were built in
RGB according to: AHT DMAP= R(x, y) = P2, G(x, y) = P3+2×P4 3 , B(x, y) = P0+2×P1 3 , (4)
where Piis defined by Eq. 1.
In order to classify the brain diseases, the brain CT image was divided into two regions of interest (ROIs) and the at-tributes, i.e., the features, were extracted from both ROIs, as shown in the fourth row of Fig. 2.
3. Datasets description
CT systems used to acquire image datasets have a resolution of 512× 512 pixels with 16 bits, and the tomographic planes are defined on the basis of the axial plane. The CT chest dataset was obtained from Walter Cantidio University Hospital, Fort-aleza, Brazil; they had been successfully used in previous stud-ies [30, 31, 34]. This dataset consists of 12 images of healthy volunteers and 24 patients: 12 with fibrosis and 12 with pul-monary emphysema. Given that each image presents two lungs, there were 24 examples of each class (healthy volunteers, pa-tients with fibrosis and papa-tients with emphysema). The first row of Fig. 1 shows an example image for each class from the dataset. The second row of Fig. 1 shows examples of the lungs under study, which were segmented from the original im-ages using the method proposed in [35]. The grayscale lung images were obtained from the original chest CT images by us-ing a window with 600 HU of width and centered at 1000 HU [36]. The brain dataset was obtained in partnership with the Hearth Hospital in Fortaleza, Cear, Brazil. This dataset con-tains 100 images of healthy volunteers and 200 patients: 100 hemorrhagic and 100 ischemic stroke images. The first row of Fig. 2 shows an example image for each class included in this dataset. The second row of Fig. 2 shows examples of the brain CT images under study, which were segmented from the original images using the method proposed in [35, 37]. The grayscale brain images were obtained from the original brain CT images by using a window with 100 HU of width and cen-tered at 50 HU [38].
4. Results
In this section, the results of each feature extraction method from the two experimental datasets are presented and discussed in terms of computational cost and classification performance. The tests were performed using a Macbook Pro with an Intel Core i5 2.4 GHz, 8 GB of RAM, and running MAC OS X El Capitan 10.11.2. The proposed feature extraction method was compared against GLCM [39], SM [9], HM [40], ZM [22], EFF
[23] and TF [24]. All of these methods are invariant to rota-tion, including the isotropic GLCM feature space obtained by computing the correlation, contrast, homogeneity and energy texture descriptors in 4 directions.
The pattern recognition experiments were performed using machine learning algorithms with different settings to obtain the overall classification performance for each feature set built. The classifiers used were: Bayesian [41], Optimum-Path Forest (OPF) with Euclidean distance [42, 43], k-Nearest Neighbor (kNN) with k= 1 [44], and Support Vector Machine configured with the radial basis function kernel (SVM) and automatic setup [45]. The classification accuracy was estimated using the 10-fold cross-validation method.
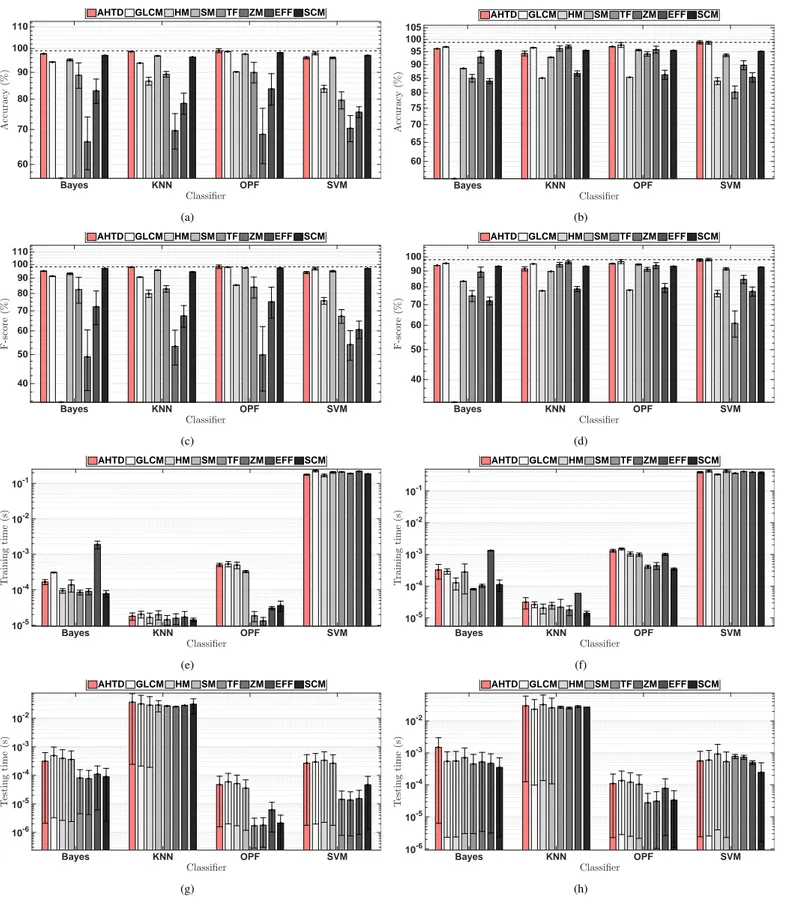
The OpenCV 2.4 library was used for all feature extraction methods, except for the new AHTD based method. Figure 3 shows the results of the classification methods in terms of ac-curacy, f-score, training and test times for the lung and brain CT image datasets. Figure 4 and shows the extraction time re-quired by each feature extraction method under comparison for lung and brain CT images, respectively.
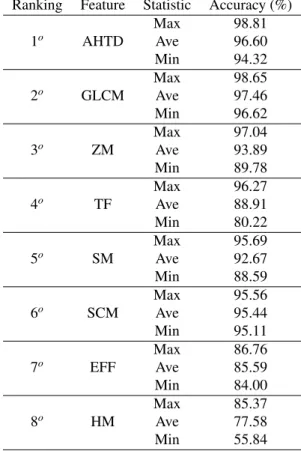
Figure 3 shows that some feature extraction methods get bet-ter results with specific classifiers, such as HM or GLCM when applied together with OPF or SVM in the classification of lung diseases, and SM applied with OPF in the classification of brain diseases. However, it is noteworthy that the proposed AHTD method obtained the best accuracy with Bayes, KNN and OPF for lung disease classification, where the latter has the highest value obtained among all results. When applied on stroke clas-sification, the AHTD method shows the best accuracy with the SVM classifier, and it has the second best result when applied with Bayes, kNN and OPF. For a further analyze, Tables 1 and 2 show the ranking for each feature extractor, classifying each in descending order of accuracy, indicating the best classifier for each feature extractor in each application.
Figure 3 shows that the AHTD based feature extraction method had classification accuracy rates above 95% for both datasets and with all classifiers; it had the highest average clas-sification accuracy in both cases (for the lungs dataset with the OPF, and for the brain dataset with SVM); it led to classification accuracies in the two highest ones for all classifiers in two ap-plication cases, and, finally, the training and testing times were similar to those obtained by the other methods.
Considering the highest accuracy value obtained by each fea-ture extraction method in the lung disease classification shown in Table 1, the AHTD based method had higher values: 0.34% more than GLCM, 0.86% more than SCM, 1.48% more than SM and 9.74% more than HM, which are the top five results. A similar analysis for the brain disease classification is shown in Table 2 where the AHTD based method also had higher val-ues: 0.16% more than GLCM, 1.77% more than ZM, 2.54% more than TF and 3.26% more than SM, which are the top five results.
Considering the average of all the results for the lung disease classification, the AHTD based method achieved the best re-sults; the AHTD was 0.72 higher than SCM and 1.77% higher than GLCM, which are the three top average accuracies. In a similar analysis for the brain disease classification, the AHTD
Classifier Bayes KNN OPF SVM F -s co re (% ) 40 50 60 70 80 90 100 110 (c) Classifier Bayes KNN OPF SVM F -s co re (% ) 40 50 60 70 80 90 100 (d) Classifier Bayes KNN OPF SVM T ra in in g ti m e (s ) 10-5 10-4 10-3 10-2 10-1 AHTD GLCM HM SM TF ZM EFF SCM (e) Classifier Bayes KNN OPF SVM T ra in in g ti m e (s ) 10-5 10-4 10-3 10-2 10-1 AHTD GLCM HM SM TF ZM EFF SCM (f) Classifier Bayes KNN OPF SVM T es ti n g ti m e (s ) 10-6 10-5 10-4 10-3 10-2 AHTD GLCM HM SM TF ZM EFF SCM (g) Classifier Bayes KNN OPF SVM T es ti n g ti m e (s ) 10-6 10-5 10-4 10-3 10-2 AHTD GLCM HM SM TF ZM EFF SCM (h)
Fig. 3. Results obtained by the methods under evaluation: lung disease classifications shown on the left, and brain disease classifications on the right, in terms of: a) and b) classification accuracy, c) and d) f-score, e) and f) training time, and g) and h) testing time.
based method again shows it had a value 2.71% higher than ZM and 3.26% higher than SM, but 0.89% lower than GLCM.
The AHTD, SM, HM and SCM methods, respectively, are considerably faster than the TF, ZM and EFF methods,
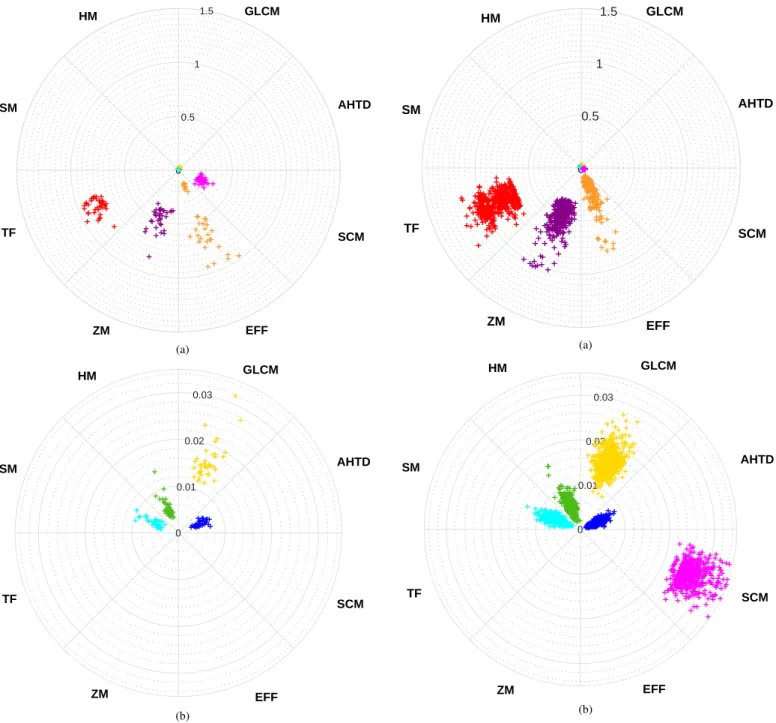
respec-tively. The times of each sample analyzed are shown in Fig-ures 4 and 5 for the classification of lung and brain diseases respectively. For a further analysis, Table 3 presents a ranking of the extractors under evaluation considering the shortest
ex-0 0.5 1 1.5 AHTD GLCM HM SM TF ZM EFF SCM (a) 0 0.01 0.02 0.03 AHTD GLCM HM SM TF ZM EFF SCM (b)
Fig. 4. Time plot of the methods evaluated in the lung disease classification in CT images of the chest: a) time of 0-1.5s and b) with zoom, (a) time of 0-0.032s.
traction time to establish the rank order. The order considering the time is the same for the two applications, in which only the AHTD, SM and HM methods have values close to 5 millisec-onds, demonstrating that the proposed method also has the best rates in terms of extraction time.
4.1. Overall results
Figures 4(b) and 5(b) show the main advantage of the pro-posed method in the detection and classification of diseases in medical images: the lowest extraction time. In the lung CT im-age dataset, the proposed method had the lowest extraction time that was equal to 1.3 ms, and 3.52 times faster than GLCM and
0 0.5 1 1.5 AHTD GLCM HM SM TF ZM EFF SCM (a) 0 0.01 0.02 0.03 AHTD GLCM HM SM TF ZM EFF SCM (b)
Fig. 5. Time plot of the methods evaluated in the stroke classification in CT images of the brain: a) time of 0-1.5s and b) with zoom, (a) time of 0-0.032s.
1.16 faster than HM and SM. In the brain image dataset, the AHTD based method had an extraction time of 1.4 ms, which was 4.34 times faster than GLCM, 1.39 times faster than HM and 1.44 times faster than SM.
Summarizing the findings, the two best extraction feature methods in terms of the classification accuracy were AHTD and GLCM, which can be confirmed by the F-score values obtained. However, the new AHTD based method required less than 30% of the time required by GLCM in the extraction process, thus showing the power of the proposed extraction method (AHTD) to classify diseases using medical images.
3o SCM Ave 97.11 Min 96.30 4o SM Max 97.56 Ave 96.34 Min 95.09 5o HM Max 90.22 Ave 79.24 Min 56.44 6o TF Max 90.00 Ave 86.94 Min 79.63 7o EFF Max 83.70 Ave 80.18 Min 75.56 8o ZM Max 70.37 Ave 68.70 Min 66.30 5. Conclusions
In this work, a novel method for feature extraction from med-ical images was proposed based on radiologmed-ical densities of human tissues. The proposed method was compared against the Gray Level Co-occurrence Matrix, Hu’s moments, Statis-tical moments, Zernike’s moments, Elliptic Fourier features, Tamura’s features and the Statistical Co-occurrence Matrix. For these analyzes, four machine learning classifiers was applied to each feature extractor for the two image CT datasets used: one to classify lung diseases in CT images of the thorax and the other to classify stroke in CT images of the brain.
The proposed AHTD method presented a faster extraction of the required attributes, as well as obtaining the best accuracy and f-score indices in the two datasets evaluated. The attributes from the lung images were extracted in 5.2 milliseconds and obtained an accuracy of 99.01% for the detection and classifica-tion of lung diseases, while the attributes from the brain images were extracted in 3.8 milliseconds and obtained an accuracy of 98.81% in the detection and classification of stroke. These achievements show that the proposed method can be used in the classification of diseases in medical images, and can be used as an alternative method for real-time applications due to its fast extraction time of suitable attributes.
Having demonstrated the potential of the proposed feature extraction method, future works will be related to the
identifi-3o ZM Ave 93.89 Min 89.78 4o TF Max 96.27 Ave 88.91 Min 80.22 5o SM Max 95.69 Ave 92.67 Min 88.59 6o SCM Max 95.56 Ave 95.44 Min 95.11 7o EFF Max 86.76 Ave 85.59 Min 84.00 8o HM Max 85.37 Ave 77.58 Min 55.84
Table 3. Brain and Lung time extraction rankings.
Ranking Feature Lung Brain
(seconds) (seconds) 1o AHTD 0.0052± 0.0011 0.0038 ± 0.0011 2o SM 0.0057± 0.0017 0.0055 ± 0.0016 3o HM 0.0058± 0.0021 0.0053 ± 0.0017 4o GLCM 0.0167± 0.0042 0.0165 ± 0.0028 5o SCM 0.0265± 0.0026 0.0271 ± 0.0029 6o ZM 0.4862± 0.1009 0.4804 ± 0.1242 7o EFF 0.5229± 0.2755 0.5394 ± 0.1104 8o TF 0.8346± 0.0641 0.8374 ± 0.1285
cation and classification of other diseases in lung and brain CT images as well as in other types of medical images. The identi-fication and classiidenti-fication of structures and organs in the human body are also goals for future works.
Acknowledgements
Pedro P. Rebouc¸as Filho acknowledges the sponsorship from the Federal Institute of Education, Science and Technology of Cear´a, in Brazil, via Grants PROINFRA-IFCE/2013 and PROAPP-IFCE/2014. He also acknowledges the sponsorship from the Brazilian National Council for Research and Develop-ment (CNPq) through grants 232644/2014-4.
Authors gratefully acknowledge the funding of Project NORTE-01-0145-FEDER-000022 - SciTech - Science and Technology for Competitive and Sustainable Industries, co-financed by Programa “Operacional Regional do Norte (NORTE2020)”, through “Fundo Europeu de Desenvolvimento Regional (FEDER)”.
Victor Hugo C. de Albuquerque acknowledges the spon-sorship from the Brazilian National Council for Research and Development (CNPq) via Grants 470501/2013-8 and 301928/2014-2.
References
[1] S. F. Eskildsen, P. Coup, V. S. Fonov, J. C. Pruessner, D. L. Collins, Struc-tural imaging biomarkers of alzheimer’s disease: predicting disease pro-gression, Neurobiology of Aging 36, Supplement 1 (2015) S23 – S31. [2] T. Upadhaya, Y. Morvan, E. Stindel, P.-J. Le Reste, M. Hatt, Prognostic
value of multimodal mri tumor features in glioblastoma multiforme us-ing textural features analysis, in: Biomedical Imagus-ing (ISBI), 2015 IEEE 12th International Symposium on, 2015, pp. 50–54.
[3] E. C. Neto, P. C. Cortez, T. S. Cavalcante, V. E. Rodrigues, P. P. R. Filho, M. A. Holanda, 3D lung fissure segmentation in TC images based in tex-tures, IEEE Latin America Transactions 14 (1) (2016) 254–258. [4] M. Abedini, N. Codella, J. Connell, R. Garnavi, M. Merler, S. Pankanti,
J. Smith, T. Syeda-Mahmood, A generalized framework for medical im-age classification and recognition, IBM Journal of Research and Devel-opment 59 (2/3) (2015) 1:1–1:18.
[5] G. L. B. Ramalho, P. P. Rebouc¸as Filho, F. N. S. de Medeiros, P. C. Cortez, Lung disease detection using feature extraction and extreme learning ma-chine, Revista Brasileira de Engenharia Biomdica 30 (2014) 363–376. [6] E. J. Holmes, A. C. Forrest-Hay, R. R. Misra, Interpretation of emergency
head CT: a practical handbook, Cambridge University Press, 2008. [7] G. N. Hounsfield, Computerized transverse axial scanning (tomography):
Part 1. description of system, The British journal of radiology 46 (552) (1973) 1016–1022.
[8] T. P. Naidich, M. Castillo, S. Cha, J. G. Smirniotopoulos, Imaging of the brain: expert radiology series, Elsevier Health Sciences, 2012.
[9] M. Nixon, M. S. Nixon, A. S. Aguado, Feature extraction & image pro-cessing for computer vision, Academic Press, 2012.
[10] A. Paul, N. Bhattacharya, A. Chowdhury, Digit recognition from pres-sure sensor data using euler number and central moments, in: Commu-nications, Devices and Intelligent Systems (CODIS), 2012 International Conference on, 2012, pp. 93–96.
[11] T. Czachorski, S. Kozielski, U. Stanczyk, Man-Machine Interactions 2, Advances in Intelligent and Soft Computing, Springer Berlin Heidelberg, 2011.
[12] M.-K. Hu, Visual pattern recognition by moment invariants, Information Theory, IRE Transactions on 8 (2) (1962) 179–187.
[13] Z. Huang, J. Leng, Analysis of Hu’s Moment Invariants on Image Scaling and Rotation, in: Computer Engineering and Technology (ICCET), 2010 2nd International Conference on, Vol. 7, Changdu, China, 2010, pp. 476– 480.
[14] Y. Sun, G. Wen, J. Wang, Weighted spectral features based on local Hu moments for speech emotion recognition, Pattern Recognition Letters 18 (2015) 80–90.
[15] J. Flusser, T. Suk, J. Boldys, B. Zitova, Projection operators and moment invariants to image blurring, Pattern Analysis and Machine Intelligence, IEEE Transactions on 37 (4) (2015) 786–802.
[16] R. Haralick, Statistical and structural approaches to texture, Proceedings of the IEEE 67 (5) (1979) 786–804.
[17] P. Li, X. Liu, N. Zhao, Weighted co-occurrence phase histogram for iris recognition, Pattern Recognition Letters 33 (2012) 1000 – 1005. [18] M. Gupta, D. Bhaskar, R. Bera, S. Biswas, Target detection of ISAR
data by principal component transform on co-occurrence matrix, Pattern Recognition Letters 33 (2012) 1682–1688.
[19] S. Beura, B. Majhi, R. Dash, Mammogram classification using two di-mensional discrete wavelet transform and gray-level co-occurrence ma-trix for detection of breast cancer, Neurocomputing 154 (0) (2015) 1 – 14.
[20] S. Chu, L. Hong, C. Liu, J. Chen, A new regional shape index for clas-sification of high resolution remote sensing images, in: Earth Observa-tion and Remote Sensing ApplicaObserva-tions (EORSA), 2014 3rd InternaObserva-tional Workshop on, 2014, pp. 156–160.
[21] M. Alves, E. Clua, F. Leta, Evaluation of surface roughness standards applying haralick parameters and artificial neural networks, in: Systems, Signals and Image Processing (IWSSIP), 2012 19th International Confer-ence on, 2012, pp. 452–455.
[22] A. Khotanzad, Y. H. Hong, Invariant image recognition by zernike mo-ments, IEEE Transactions on pattern analysis and machine intelligence 12 (5) (1990) 489–497.
[23] F. P. Kuhl, C. R. Giardina, Elliptic fourier features of a closed contour, Computer graphics and image processing 18 (3) (1982) 236–258. [24] H. Tamura, S. Mori, T. Yamawaki, Textural features corresponding to
visual perception, IEEE Transactions on Systems, Man, and Cybernetics 8 (6) (1978) 460–473.
[25] G. L. B. Ramalho, D. S. Ferreira, P. P. R. Filho, F. N. S. de Medeiros, Rotation-invariant feature extraction using a structural co-occurrence ma-trix, Measurement 94 (2016) 406 – 415.
[26] H. Campos, A. Lemos, Asthma and COPD in view of the pulmonologist, Brazilian Journal of Pulmonology 35 (4).
[27] WHO, Global strategy for the diagnosis, management and prevention chronic obstrutive pulmonar disease, Tech. rep., World Health Organi-zation (2014).
URL http://www.who.int/respiratory/copd/causes/en/ [28] WHO, Cardiovascular diseases (cvds), Tech. rep., World Health
Organi-zation (2015).
URL http://www.who.int/mediacentre/factsheets/fs317/ en/
[29] S. Mendis, T. Armstrong, D. Bettcher, F. Branca, J. Lauer, C. Mace, V. Poznyak, L. Riley, V. Silva, G. Stevens, et al., Global status report on noncommunicable diseases 2014, Switzerland: World Health Organi-zation (2014) 14–15.
[30] P. P. Rebouc¸as Filho, P. C. Cortez, M. A. Holanda, Active contour modes crisp: new technique for segmentation the lungs in CT images, Revista Brasileira de Engenharia Biomdica 27 (2011) 259–272.
[31] P. P. Rebouc¸as Filho, P. C. Cortez, J. H. S. Felix, T. da Silveira, M. A. Holanda, Adaptive 2D crisp active contour model applied to lung seg-mentation in CT images of the thorax of healthy volunteers and patients with pulmonary emphysema, Revista Brasileira de Engenharia Biomdica (2013) 363–376.
[32] T. S. Cavalcante, P. C. Cortez, P. P. Rebouc¸as Filho, J. H. S. Felix, A. R. Alexandria, M. A. Holanda, Comparative analysis of segmenta-tion techniques of airways on images of chest computed tomography, in: 17th International Conference on Systems, Signals and Image Processing-IWSSIP, Processing-IWSSIP, Rio de Janeiro, RJ, 2010, pp. 1–4.
[33] A. B. N. Ribeiro, Lung blood vessels segmentation in thoracic ct scans, Master’s thesis, Universidade Federal do Cear´a, Fortaleza, CE (2013). [34] P. P. R. Filho, Cortez, P. C´esar, A. C. S. Barros, V. H. C. Albuquerque,
J. ao Manuel Ribeiro Silva Tavares, Novel and powerful 3d adaptive crisp active contour method applied in the segmentation of ct lung images, Medical Image Analysis 35 (2017) 503–516.
[35] P. P. R. Filho, Cortez, P. C´esar, A. C. S. Barros, V. H. C. Albuquerque, Novel adaptive balloon active contour method based on internal force for image segmentation – A systematic evaluation on synthetic and real im-ages, Expert Systems with Applications 41 (17) (2014) 7707–7721. [36] W. R. Webb, W. E. Brant, N. M. Major, Fundamentals of body CT,
Else-vier Health Sciences, 2014.
[37] F. D. L. Moreira, M. N. Kleinberg, H. F. Arruda, F. N. C. Freitas, M. M. V. Parente, V. H. C. de Albuquerque, P. P. R. Filho, A novel vickers hardness measurement technique based on adaptive balloon active contour method, Expert Systems with Applications 45 (2016) 294 – 306.
[38] D. M. Yousem, R. I. Grossman, Neuroradiology: the requisites, Elsevier Health Sciences, 2010.
[39] R. Haralick, K. Shanmugam, I. Dinstein, Textural features for image clas-sification, Systems, Man and Cybernetics, IEEE Transactions on SMC-3 (6) (197SMC-3) 610–621.
[40] M.-K. Hu, Visual pattern recognition by moment invariants, Information Theory, IRE Transactions on 8 (2) (1962) 179–187.
[41] O. Sayadi, M. B. Shamsollahi, A model-based bayesian framework for ECG beat segmentation, Physiological Measurement 30 (3) (2009) 335– 352.