Protein utilisation and intermediary metabolism of Senegalese sole
(Solea senegalensis) as a function of protein:lipid ratio
Pedro Borges
1,2, Franc¸oise Medale
2, Jorge Dias
3and Luı´sa M. P. Valente
1*
1CIMAR/CIIMAR, Centro Interdisciplinar de Investigac¸a˜o Marinha e Ambiental and ICBAS, Instituto de Cieˆncias Biome´dicas
de Abel Salazar, Universidade do Porto, Rua dos Bragas, 289, 4050-123 Porto, Portugal
2INRA-UR 1067 Nutrition Me´tabolisme, Aquaculture, Poˆle Hydrobiologie, 64310 Saint Pe´e-sur-Nivelle, France
3CIMAR/CCMAR, Centro de Cieˆncias do Mar do Algarve, Universidade do Algarve, Campus de Gambelas, 8005-139 Faro,
Portugal
(Submitted 29 February 2012 – Final revision received 22 June 2012 – Accepted 9 July 2012 – First published online 20 August 2012)
Abstract
Previous experiments with Senegalese sole (Solea senegalensis) have demonstrated that dietary lipid levels above 8 % impaired growth and did not promote protein retention. We hypothesised that this low ability to use high-lipid diets may depend on the dietary protein level. In the present study, a 2 £ 2 factorial design was applied where two dietary lipid (4 – 17 % DM) and two dietary protein (below and above the requirement levels, 48 and 54 % DM) levels were tested in juveniles for 114 d. Growth performance was not improved by the increase in dietary fat, irrespectively of the dietary protein levels. Protein retention was similar among the diets, although fish fed the diets with high lipid content resulted in significantly lower protein gain. Among the enzymes involved in amino acid catabolism, only aspartate amino-transferase activity in the liver was affected by the dietary lipid levels, being stimulated in fish fed high-lipid diets. Moreover, phosphofruc-tokinase 1 activity was significantly elevated in the muscle of Senegalese sole fed 4 % lipid diets, suggesting enhanced glycolysis in the muscle when the dietary lipid supply was limited and dietary starch increased. The results confirmed that high-lipid diets do not enhance growth, and data from the selected enzymes support the assumption that lipids are not efficiently used for energy production and protein sparing, even when dietary protein is below the protein requirement of the species. Furthermore, data suggest a significant role of glucose as the energy source in Senegalese sole.
Key words:Lipid levels: Protein levels: Fatty acid oxidation: Protein catabolism
The balance between dietary protein and energy has a major impact on protein utilisation(1,2), affecting the ratio between protein oxidation (energy) and synthesis (growth). It also deter-mines body reserve storage that varies depending on the respective proportions of macronutrients supplied by the diet. Dietary lipids appear to be a more efficient non-protein energy source for fish than carbohydrates, especially in sal-monids and other carnivorous species. Besides their higher energy value and their high digestibility, dietary lipids are generally preferentially oxidised compared with carbohydrate sources(3,4). Consequently, over the past decades, the use of
high-lipid diets in fish aquaculture has become a common prac-tice due to the role of dietary lipids as a non-protein energy source, enhancing growth, protein retention and reducing organic matter and N losses(2,5). However, previous studies
have indicated that the lipid metabolism of Senegalese sole (Solea senegalensis) differed from the general trend.
Senegalese sole is a marine fish with high protein requirements, a feature shared with most of the marine fish species, especially flatfish(6 – 11). According to Rema et al.(9), at a fixed dietary lipid level of 12 %, Senegalese sole diets should include a high crude protein level (53 % DM) to main-tain good overall growth performance. In flatfish species, a protein-sparing effect of dietary lipids has been observed in turbot (Scophthalmus maximus)(12) and Atlantic halibut (Hippoglossus hippoglossus)(13); however, in Senegalese sole, increasing the lipid levels from 11 to 21 %(14)did not improve growth. Borges et al.(15)has recently demonstrated a low lipid
tolerance of Senegalese sole, and recommended a dietary lipid inclusion up to 8 % for optimal growth and feed utilisation
* Corresponding author: L. M. P. Valente, fax þ 351 223401838, email [email protected]
Abbreviations: ALAT, alanine aminotransferase; ASAT, aspartate aminotransferase; FAS, fatty acid synthase; GDH, glutamate dehydrogenase; HAD, 3-hydroxyacyl-CoA dehydrogenase; PFK, phosphofructokinase.
qThe Authors 2012
British
Journal
of
Nutrition
https://www.cambridge.org/core . Universidade do Algarve , on 06 Jun 2019 at 10:26:56, subject to the Cambridge Core terms of use, available at
https://www.cambridge.org/core/terms
.
efficiency at a protein level of 57 % (DM basis). We hypothesised that the low ability to use high-lipid diets may depend on the dietary protein level, with dietary protein at high levels (above 50 % DM basis) preferentially oxidised over non-protein energy sources. In many teleost species, an improvement in protein retention can be achieved when low-protein diets are used as long as the dietary non-protein energy fraction increases(5,16,17).
Measurements of enzyme activity associated with growth parameters are generally useful tools to study fish metabolic adaptation to dietary supply(18). The activity of key hepatic enzymes involved in protein catabolism has been pointed out as a relevant indicator of the metabolic utilisation of diet-ary protein by fish(19,20). Moreover, non-protein energy and dietary protein levels can generate different responses in hepatic lipogenic enzymes(17,21). With the increase in non-protein energy supplied either as lipids or carbohydrates, changes in b-oxidation and glycolytic pathways are expected. Mitochondrial b-oxidation is the major energy-producing pathway from fatty acid oxidation, providing an important source of energy for tissues, especially the heart and the skeletal muscle(22). Assessment of the major sites of lipid cata-bolism and synthesis may provide further insight into the apparent weak utilisation of dietary lipids in Senegalese sole. The objective of the present study was to test the hypothesis that the limited capacity of Senegalese sole to utilise dietary lipids is related to dietary protein levels. To this end, a 2 £ 2 factorial design was applied where two dietary lipid (4 – 17 % DM) and two dietary protein (just below and above the requirement levels, 48 and 54 % DM) levels were tested in Senegalese sole juveniles. The dietary lipid levels were chosen based on previous experiments(15) where sole fed with diets containing 4 % lipid displayed significantly higher growth rates than those fed higher lipid levels (12, 16 and 20 % lipid, DM basis). At the end of the trial, growth per-formance, body composition and feed utilisation were analysed. In addition, the activity of selected hepatic enzymes was determined as an indicator of intermediary metabolism. Therefore, the activities of selected enzymes involved in amino acid catabolism (alanine aminotransferase (ALAT), aspartate aminotransferase (ASAT) and glutamate dehydro-genase (GDH)), fatty acid oxidation (3-hydroxyacyl-CoA dehydrogenase (HAD)), fatty acid synthesis (fatty acid syn-thase (FAS)) and glucose catabolism (phosphofructokinase 1 (PFK-1)) were assessed.
Materials and methods Experimental diets
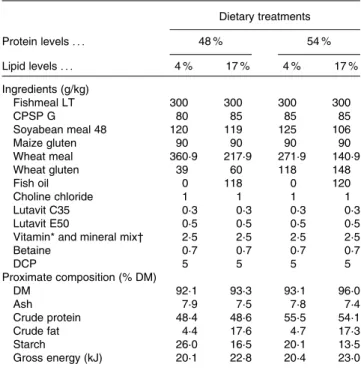
In the present study, four experimental diets were formulated to contain two protein levels, below and above the require-ment levels (48 and 54 % DM), and two lipid levels, previously shown to result in significantly different growth rates (4 and 17 % DM) (Table 1). The increase in the lipid levels was achieved by adding fish oil and lowering the amount of wheat meal, whereas the two protein levels were obtained by mixing different quantities of wheat meal and wheat
gluten. As a consequence, all diets had varying carbohydrate levels that resulted in different starch contents. Low-fat/ low-protein diets had higher starch contents (26 – 20 v. 17 – 14 % DM). The ingredients and proximate composition are presented in Table 1. The ingredients were finely ground, mixed and pelleted dry without steaming using a laboratory pelleting machine (C-300 model; California Pellet Mill) with a 2·0 mm die.
Growth trial
The present study was conducted under the supervision of an accredited expert in laboratory animal science (following
Federation of Laboratory Animal Science Associations
(FELASA) category C recommendations) and according to the European Economic Community animal experimentation guidelines directive of 24 November 1986 (86/609/EEC).
The study was performed at the experimental facilities of Centro de Investigac¸a˜o Marinha e Ambiental (CIIMAR), Porto, Portugal, with Senegalese sole (S. senegalensis) juveniles supplied by a commercial fish farm (Coelho & Castro). After arrival at the experimental unit, fish were acclimatised to the new facilities for 2 weeks. For each treatment, three homogeneous groups of twenty fish (average initial body weight 17 (SD 1·8) g) were grown in white fibre glass tanks
Table 1. Ingredients and proximate composition of the experimental diets with the different protein and lipid levels
Dietary treatments Protein levels . . . 48 % 54 % Lipid levels . . . 4 % 17 % 4 % 17 % Ingredients (g/kg) Fishmeal LT 300 300 300 300 CPSP G 80 85 85 85 Soyabean meal 48 120 119 125 106 Maize gluten 90 90 90 90 Wheat meal 360·9 217·9 271·9 140·9 Wheat gluten 39 60 118 148 Fish oil 0 118 0 120 Choline chloride 1 1 1 1 Lutavit C35 0·3 0·3 0·3 0·3 Lutavit E50 0·5 0·5 0·5 0·5
Vitamin* and mineral mix† 2·5 2·5 2·5 2·5
Betaine 0·7 0·7 0·7 0·7 DCP 5 5 5 5 Proximate composition (% DM) DM 92·1 93·3 93·1 96·0 Ash 7·9 7·5 7·8 7·4 Crude protein 48·4 48·6 55·5 54·1 Crude fat 4·4 17·6 4·7 17·3 Starch 26·0 16·5 20·1 13·5 Gross energy (kJ) 20·1 22·8 20·4 23·0
LT, low temperature; CPSP G, fish soluble protein concentrate (hydrolysed fish-meal); Lutavit C35, vitamin C; Lutavit E50, vitamin E; DCP, dibasic calcium phosphate.
* Vitamins (per kg diet): vitamin A, 10 000 IU (retinol, 3000 mg); vitamin D3, 2125 IU
(cholecalciferol, 53 mg); vitamin K3, 12·5 mg; vitamin B12, 0·025 mg; vitamin B1,
10 mg; vitamin B2, 25 mg; vitamin B6, 12·5 mg; folic acid, 12·5 mg; biotin,
0·86 mg; inositol, 300 mg; nicotinic acid, 85 mg; pantothenic acid, 37·50 mg. † Minerals (per kg diet): Mn (manganese oxide), 25 mg; I (potassium iodide),
1·88 mg; Cu (copper sulphate), 6·25 mg; Co (cobalt sulphate), 0·13 mg; Zn (zinc oxide), 37·5 mg; Se (sodium selenite), 0·31 mg; Fe (iron sulphate), 75 mg.
British
Journal
of
Nutrition
https://www.cambridge.org/core . Universidade do Algarve , on 06 Jun 2019 at 10:26:56, subject to the Cambridge Core terms of use, available at
https://www.cambridge.org/core/terms
.
(50 cm £ 35 cm). Each tank was supplied with filtered and heated (20 ^ 18C) seawater (30‰), at a flow rate of 1·5 litres/min. The most important water parameters (temperature, dissolved O2, salinity, pH and nitrogenous compounds) were
monitored during the entire trial and maintained at levels within the limits recommended for marine species. Fish were exposed to an artificial photoperiod of 12 h light. At the beginning and end of the experiment, individual weights and the length of fish were recorded. Fish were fed ad libitum by automatic feeders six to eight meals per d (24 h) over a period of 114 d. All tanks were daily monitored and feed distribution adjusted according to feed losses in each tank(15). At the beginning of the feeding trial, ten fish from the initial stock were sampled and stored at 2 208C until whole-body analysis. At the end of the trial, three fish per tank were sampled 24 h after the last meal for the same purpose. All fish sampled were euthanised by a sharp blow on the head. Liver and muscle were removed from twelve fish per tank 6 h postprandial and immediately frozen in liquid N2, and
thereafter stored at 2 808C. From those, two liver samples were used for total lipid analysis and the remaining ten liver samples for determination of enzyme activity.
Analytical methods
Frozen samples from each tank were cut without thawing into pieces avoiding drip losses, minced altogether using a meat mincer and pooled homogeneously. After homogenisation, a part of each sample was used to determine the moisture content (1058C for 24 h to constant weight). The rest of the samples were subsequently freeze-dried before further analyses.
Feed and freeze-dried whole-body samples were analysed for DM (1058C for 24 h), ash (5508C for 6 h, Nabertherm L9/11/B170; Nabertherm GmbH), crude protein (N £ 6·25, Nitrogen Analyser, Leco FP-528; Leco), crude lipid (petroleum diethyl ether extraction, Soxtherm Multistat/SX PC; Gerhardt) and gross energy (adiabatic bomb calorimeter, C2000; IKA). Starch was measured following the amyloglucosidase – amylase method(23).
Liver samples were analysed individually for total lipid levels following Folch et al.(24). HAD (EC 1.1.1.35) activity was measured in the liver and muscle according to Kobayashi et al.(25). ALAT (EC 2.6.1.2), ASAT (EC 2.6.1.1) and GDH (EC 1.4.1.2) activities were determined as follows: a frozen sample of either the liver or muscle was homogenised, diluted at 1:10 in ice-cold buffer (30 mM-HEPES, 0·25 mM-saccharose, 0·5 mM-EDTA, 5 mM-K2HPO4and 1 mM-dithiothreitol, pH 7·4).
The homogenate was then centrifuged at 900 g for 10 min, and the supernatant used for ALAT, ASAT and GDH deter-minations. For GDH, the supernatant was sonicated for 1 min (pulse 1 s, amplitude 50) and centrifuged again at 15 000 g for 20 min. ALAT and ASAT were assayed using kits from Enzyline (ALAT/GPT, reference no. 63 313; ASAT/GOT, reference no. 63 213) at 378C and followed by at 340 nm. GDH activity was measured using 10 mM-L-glutamic acid at 378C, as described previously by Bergmeyer(26).
FAS activity was measured in the liver by an isotopic method using [14C]acetyl-CoA according to Hsu &
Butter-worth(27). Liver was homogenised in three volumes of ice-cold buffer (0·02M-Tris – HCl, 0·25M-sucrose, 2 mM-EDTA, 0·1M-NaF, 0·5 mM-phenylmethylsulphonyl fluoride and 0·01M-b-mercaptoethanol, pH 7·4). The homogenates were centrifuged at 15 000 g for 20 min at 48C and the activity of FAS was measured on the supernatant.
PFK-1 activity was assayed in the muscle in a final volume of 0·2 ml containing 100 mM-Tris – HCl (pH 8·25), 5 mM -MgCl2, 50 mM-KCl, 0·15 mM-NADH, 4 mM-ammonium sulphate,
12 mM-2-mercaptoethanol, 10 mM-fructose-6-phosphate, fructose bisphosphate aldolase (0·675 U/ml, EC 4.1.2.13), triose-phosphate isomerase (5 U/ml, EC 5.3.1.1), glycerol-3-triose-phosphate dehydrogenase (2 U/ml, EC 1.1.99.5) and 5 ml crude extract. The PFK-1 reaction was measured after the addition of 1 mM-fructose-6-phosphate at 308C, followed by a decrease in absorbance at 340 nm.
One unit of enzyme activity was defined as the amount of enzyme that catalysed the hydrolysis of 1 mmol of substrate per min at the assay temperature. Enzyme activities were expressed per mg soluble protein. Protein concentration was measured according to the Bradford method(28), using a
protein assay kit (Bio Rad) with bovine serum albumin as a standard.
Statistical analysis
Statistical analyses followed methods outlined by Zar(29). All
data were tested for homogeneity of variances by Bartlett’s tests, and then subjected to a two-way ANOVA with dietary protein and lipid levels as main effects using STATISTICA 9.0 (Statsoft). When protein £ lipid interactions were significant (P# 0·05), individual means were compared using Tukey’s test. Significant differences were considered when P# 0·05.
Results
Feed intake varied significantly with the dietary treatments and was lower with the high-lipid diets so that gross energy intake was similar in the four groups. Given the large differences in dietary lipid levels (17 v. 4 % of DM), lipid intake was signi-ficantly higher in fish fed the 17 % lipid diets despite the reduction in feed intake. As expected, there was an interaction between the lipid and protein levels for starch intake. The diets with a low lipid level (higher dietary starch content) clearly presented higher starch intake compared with the high-fat diets. Protein intake was affected either by the lipid or protein level and was significantly higher (P, 0·05) in the diets containing 54 % crude protein with the highest values recorded for fish fed the diet 54 %/4 %.
At the end of the trial, all treatments resulted in a threefold increase in body weight (Table 2) that ranged from 52 g (54 %/17 %) to 60 g (54 %/4 %). The daily growth index and the final body weight were significantly affected by the dietary lipid levels, with the highest values recorded for the diets with the low lipid/high starch level (P# 0·05). The feed conversion ratio was affected by both the protein (P, 0·05) and lipid
British
Journal
of
Nutrition
https://www.cambridge.org/core . Universidade do Algarve , on 06 Jun 2019 at 10:26:56, subject to the Cambridge Core terms of use, available at
https://www.cambridge.org/core/terms
.
levels (P, 0·05) of the diets with values ranging from 1·14 (54 %/17 %) to 1·34 (48 %/4 %). The protein efficiency ratio was affected by the lipid levels and was higher in fish fed the high-lipid diets (1·66 and 1·62 for 54 %/17 % and 48 %/ 17 %, respectively).
No differences were found in the hepatosomatic index and liver lipid content between the treatments, with the values ranging from 0·99 to 1·01 and 8·54 to 11·10, respectively. The viscerosomatic index was significantly affected by the lipid levels (P, 0·05), with the high-lipid diets leading to higher values. Whole-body protein and moisture were signifi-cantly affected by the lipid levels, and were higher in fish fed the low-lipid diets compared with fish fed the high-lipid diets (Table 3). The opposite trend was observed for both whole-body energy and lipid content. The dietary lipid levels had a stronger effect on whole-body lipid and energy content than the dietary protein levels.
DM gain was similar among the treatments and varied from 2·24 (48 %/4 %) to 2·51 (48 %/17 %). Protein gain was affected by the lipid levels and was higher in fish fed the low-lipid diets. An interaction between the protein and lipid levels was observed for lipids and energy gain; fish fed the high lipid levels deposited more lipids and, consequently, more energy. DM was affected by either the dietary lipid or protein levels, with the higher values registered for the 54 %/17 % (23·78 %) and the lowest for the 48 %/4 % (18·18 %) diets. Lipids and energy retention (Table 3) were significantly affected by the lipid levels (P, 0·05), whereas protein reten-tion was neither affected by the lipid levels nor by the protein content. Fish fed the low-lipid diets displayed higher lipid retention than those fed the high-lipid diets. The inverse was observed for energy retention since fish fed the high-lipid diets ingested higher amounts of high-lipids.
In the muscle, activity of the enzymes involved in protein catabolism (ALAT, ASAT and GDH) was not significantly affected by the dietary treatments (Table 4). In the liver, ASAT activity was significantly lower in fish fed the low-lipid diets than in those fed the high-lipid diets (P, 0·05). The activity of HAD in either the liver or muscle was not affected by the protein or lipid levels in the diet. FAS was significantly affected by both the protein and lipid levels. FAS activity was higher in fish fed the low lipid level and the highest dietary protein level. PFK in the muscle was mainly affected by the lipid levels and ranged from 836·9 (48 %/17 %) to 1150·9 mU/mg protein (48 %/4 %) (Table 4).
Discussion
The results of the present study demonstrated that high-fat diets do not promote growth since Senegalese sole fed the high-lipid diets had a lower growth rate, despite the similar energy intake of the four groups. The present study confirms the results from earlier studies showing that increasing dietary lipid levels when dietary protein content is kept constant did not improve growth performance in either juveniles(15) or large-sized sole(30). Moreover, diets containing lipid levels above 8 % resulted in reduced growth rates in Senegalese sole juveniles(15). The contrary is observed in salmonids and most marine fish species(5,31 – 33). In other flatfish species, the
picture is not so clear. In juvenile (140 g)(13) or commercial-sized (1 kg) halibut(34), growth performance was not affected by the inclusion of non-protein energy sources (lipids and carbohydrates), even when dietary protein was below its pro-tein requirement(11). In juvenile turbot(35,36) and Japanese
flounder (Paralichthys olivaceus)(37), a decline in growth rate was observed when fish were fed lipid-rich diets with high protein levels, and a possible positive role of
Table 2. Effect of the different dietary protein/lipid levels on Senegalese sole intake and growth after 114 d (Mean values and standard deviations, n 3)
Dietary treatments
Protein levels . . . 48 % 54 %
Lipid levels . . . 4 % 17 % 4 % 17 % Two-way ANOVA
Mean SD Mean SD Mean SD Mean SD Lipid Protein Lipid £ protein
Intake (g or kJ/kg per d)* DM 12·32 0·22 11·14 0·55 12·00 0·48 10·17 0·64 ,0·05 0·054 0·28 Protein 5·96 0·10 5·41 0·27 6·66 0·26 5·50 0·35 ,0·05 ,0·05 0·07 Lipids 0·54b 0·01 1·96a 0·10 0·57b 0·02 1·76a 0·11 ,0·05 0·09 ,0·05 Starch 3·20a 0·01 1·83c 0·01 2·41b 0·01 1·47d 0·01 ,0·05 ,0·05 ,0·05 Energy (kJ) 247·26 4·35 253·48 12·48 245·14 9·74 233·75 14·70 0·70 0·12 0·20 Growth
Final body weight 54·59 1·57 53·15 3·90 60·05 3·40 52·32 3·62 ,0·05 0·25 0·13
DGI† 1·07 0·03 1·04 0·08 1·17 0·07 1·02 0·07 ,0·05 0·30 0·17
FCR‡ 1·34 0·03 1·24 0·02 1·23 0·07 1·14 0·03 ,0·05 ,0·05 0·87
PER§ 1·54 0·04 1·66 0·02 1·47 0·08 1·62 0·04 ,0·05 0·08 0·52
DGI, daily growth index; FCR, feed conversion ratio; PER, protein efficiency ratio.
a,b,c,dMean values within a row with unlike superscript letters were significantly different (P, 0·05).
* Nutrient intake ¼ nutrient intake/average body weight ((initial body weight þ final body weight)/2)/d. † DGI ¼ 100 £ ((final body weight)1/32(initial body weight)1/3)/d.
‡ FCR ¼ dry feed intake/weight gain. § PER ¼ weight gain/crude protein intake.
British
Journal
of
Nutrition
https://www.cambridge.org/core . Universidade do Algarve , on 06 Jun 2019 at 10:26:56, subject to the Cambridge Core terms of use, available at
https://www.cambridge.org/core/terms
.
carbohydrates was suggested in Japanese flounder(38). However, Caceres-Martinez et al.(35) found that increasing dietary lipids with a protein level below the protein require-ment did not affect turbot growth. The present findings do not support the hypothesis of a protein-sparing effect of diet-ary lipids in Senegalese sole, regardless of the dietdiet-ary protein levels. Indeed, the lowest-energy diets (devoid of fish oil addition) were able to promote higher growth rates than the high-lipid diets (high-energy-density diets). Despite the similar energy intake, most of the energy ingested by sole fed the low-lipid diets was delivered by protein and starch, and even so these fish showed the highest growth performance. As mentioned before, low-lipid diets presented higher starch content, which can be the reason for this unexpected higher growth. Incorporation of high lipid levels in the diets for sal-monids and most marine fish species is a common practice to improve protein retention(5,17,33,39). Carbohydrates can also be used to spare protein, although in marine fish, which are mainly carnivorous, the ability to utilise this macro-nutrient for energy proposes is generally limited when com-pared with lipids(40,41). In European seabass and gilthead sea bream, data regarding the efficiency of protein sparing by carbohydrates are contradictory, with studies reporting either a significant protein-sparing effect or no effect at all(42). The interaction between macronutrients is fairly well documented in fish species. A recent study in rainbow trout has suggested that impaired glucose utilisation in carnivorous species can be
dependent on dietary lipid levels(43). In Senegalese sole, pro-tein retention was not influenced by either the lipid or propro-tein levels in the diet. However, nutrient gain and whole body composition were significantly affected by the composition of the diets. Body protein content and protein gain were lower in fish fed the high-fat/low-starch diets, regardless of the dietary protein levels, providing additional evidence that dietary lipids do not favour protein accretion in Senegalese sole and that carbohydrates probably have a positive effect in nutrient utilisation. Further studies with adequate design are needed to assess the possible link between dietary carbo-hydrates and lipid intolerance. Overall, the results support the assumption that lipids are not being efficiently used as non-protein energy sources, even when the non-protein content is below the species requirement. This also could result from impaired lipid absorption that would limit the availability of dietary lipids for metabolic pathways. However, a recent study from Dias et al.(44) has suggested a high degree of
lipid absorption in the intestine given the fact that energy digestibility of a diet with 55 % protein and 14 % fat was approximately 93 %. Data on the activity of enzymes involved in amino acid catabolism reinforce the hypothesis of a low protein-sparing effect of dietary lipids in Senegalese sole. Diet-ary amino acids can be used for protein deposition and growth or diverted from this pathway to serve as carbon sub-strates for gluconeogenesis, lipogenesis, ketogenesis or energy production. When amino acids are not used for tissue protein
Table 3. Effect of the different dietary protein/lipid levels on Senegalese sole somatic indices (n 12) and nutrient utilisation (n 3) after 114 d (Mean values and standard deviations)
Dietary treatments
Protein levels . . . 48 % 54 %
Lipid levels . . . 4 % 17 % 4 % 17 % Two-way ANOVA
Mean SD Mean SD Mean SD Mean SD Lipid Protein Lipid £ protein
HSI* 0·99 0·16 1·01 0·19 0·99 0·18 0·99 0·15 0·69 0·72 0·76
Liver total lipids 9·04 1·75 11·1 2·68 8·54 1·47 9·16 2·17 0·14 0·17 0·42
VSI† 2·16 0·33 2·44 0·32 2·23 0·24 2·57 0·36 ,0·05 0·34 0·89
Whole body composition‡ (% WW)
Moisture 76·27 0·73 73·78 0·1 75·95 0·34 74·37 0·53 ,0·05 0·64 0·14 Ash 1·82 0·23 1·62 0·09 1·79 0·08 1·70 0·24 0·19 0·82 0·59 Protein 19·17 0·29 18·31 0·29 19·46 0·48 18·41 0·15 ,0·05 0·35 0·63 Lipids 3·08c 0·29 6·63a 0·23 3·25c 0·29 5·8b 0·23 ,0·05 ,0·05 ,0·05 Energy (kJ/g) 5·53c 0·01 6·66a 0·04 5·64c 0·06 6·37b 0·12 ,0·05 0·07 ,0·05 Gain§ (g/kg per d) DM 2·24 0·07 2·51 0·11 2·41 0·13 2·42 0·15 0·08 0·62 0·09 Protein 1·88 0·03 1·72 0·12 2·01 0·13 1·72 0·09 ,0·05 0·27 0·26 Lipids 0·26c 0·03 0·72a 0·01 0·3c 0·04 0·61b 0·04 ,0·05 0·09 ,0·05 Energy (kJ) 54·05c 0·86 66·57a 2·69 57·59b,c 2·69 62·56a,b 2·63 ,0·05 0·86 ,0·05 Retentionk (% intake) DM 18·18 0·44 22·58 0·37 20·1 1·47 23·78 1·16 ,0·05 ,0·05 0·54 Protein 31·48 0·25 31·77 0·68 30·26 2·54 31·28 1·08 0·45 0·33 0·67 Lipids 48·95 6·67 36·94 1·8 53·25 5·2 34·71 2·63 ,0·05 0·70 0·25 Energy (kJ) 21·86 0·43 26·27 0·23 23·51 1·4 26·8 1·41 ,0·05 0·10 0·37
HSI, hepatosomatic index; VSI, viscerosomatic index; WW, wet weight.
a,b,cMean values within a row with unlike superscript letters were significantly different (P, 0·05).
* HSI ¼ 100 £ (liver weight/body weight) (%). † VSI ¼ 100 £ (visceral weight/body weight) (%).
‡ Initial body composition was as follows: moisture, 75·65 % WW; ash, 2·49 % WW; protein, 17·22 % WW; lipids, 4·53 % WW; energy, 5·81 kJ/g WW. § Nutrient gain ¼ (nutrient in final carcass– nutrient in initial carcass)/average body weight/d.
k Retention ¼ 100 £ (final body weight £ final carcass nutrient content –initial body weight £ initial carcass nutrient content)/nutrient intake.
British
Journal
of
Nutrition
https://www.cambridge.org/core . Universidade do Algarve , on 06 Jun 2019 at 10:26:56, subject to the Cambridge Core terms of use, available at
https://www.cambridge.org/core/terms
.
synthesis, they are rapidly deaminated through the combined intervention of transaminases such as ALAT and ASAT, and GDH. In seabream (Sparus aurata), hepatic ALAT appears to be sensitive to dietary protein levels(20), and in Atlantic salmon (Salmo salar) and rainbow trout, high-protein diets promoted the stimulation of liver ALAT(19,45). In Mugil capito, the activity of both ALAT and ASAT increased with the increase in the protein content of the diet(46). In the present study, the activity of ALAT, ASAT and GDH in the liver of sole was not affected by dietary protein levels. Contrarily to our expec-tations, the only significant change regarding the activity of the enzymes involved in amino acid catabolism was an increase in ASAT activity in the liver of sole fed the high-lipid diets, at both protein levels tested (48 and 54 % DM), supporting the assumption that high-lipid diets do not promote protein sparing. In seabream, ASAT seems to have a more prominent role in protein mobilisation compared with ALAT, but the activity of both enzymes decreased when fish were fed with high-energy diets, regardless of the protein levels(20). In the liver of Atlantic salmon, ASAT activity is not dependent on the type of dietary energy sources(19). With the increase in
aspartate transamination in the liver of sole fed the high-lipid diets, higher concentrations of glutamate, the substrate of GDH, were expected and thus an elevated activity of GDH. However, liver GDH activity did not respond to increased ASAT activity.
Muscle tissue represents the largest body compartment and is responsible for most of the energy expenditure in fish. Diet-ary lipid content did not significantly affect the activity of ALAT, ASAT and GDH in the sole muscle, although there was a significant negative correlation between ALAT activity in the muscle and protein gain (R 2 0·73, P¼ 0·01). Neverthe-less, Campos et al.(47) observed a decrease in the expression of myogenic regulatory factors and myosins in the muscle of
Senegalese sole fed increasing dietary lipid levels, supporting somehow the hypothesis that high lipid levels depress growth by reducing protein accretion.
Whole-body lipids and energy content were significantly affected by both the lipid and the protein levels of the diets. The high-lipid diets led to a significantly higher whole-body lipid and energy content of sole, confirming the effect of elev-ated lipid intake on whole-body lipid accumulation widely reported in various animals. In sole, lipid gain promoted by the high-lipid diets probably resulted from the storage of diet-ary fat because the activity of FAS, the enzyme catalysing the end-step of lipid neosynthesis, was depressed in the liver of sole fed the high-lipid diets. The higher body fat content observed in sole fed the high-lipid diets reinforces the assumption that dietary lipids are effectively absorbed once digested. However, lipid retention was significantly lower with the 17 % fat diets than with the 4 % lipid diets regardless of the dietary protein levels, suggesting that part of the dietary fat supply was diverted towards other pathways. Despite the general belief that high-protein diets may promote high lipid deposition in fish(17,45,48), in the present study, lipid gain
and whole-body lipid content were the highest in sole fed the high-lipid/low-protein diet, suggesting metabolic disturb-ances when high fat levels are combined with high protein levels in the diet.
The low activity of FAS suggests a marginal contribution of de novo synthesis of lipids for the increment of body lipid con-tent. This could be related to the fact that in sole, as in other flatfish, the capacity to store fat is limited. However, FAS activity was found to be highly sensitive to the composition of nutrient intake. The highest value was found in the liver of sole fed the low-fat/high-protein diet. The inhibition of FAS by increasing levels of dietary lipids is a well-documented phenomenon in several species(17,49,50)including Senegalese
Table 4. Effect of the different dietary protein:lipid ratios on Senegalese sole enzyme activity (mU/mg protein) after 114 d (Mean values and standard deviations, n 6)
Dietary treatments
Protein levels . . . 48 % 54 %
Lipid levels . . . 4 % 17 % 4 % 17 % Two-way ANOVA
Mean SD Mean SD Mean SD Mean SD Lipid Protein Lipid £ protein
ALAT Liver 563·4 212·6 686·4 200·7 576·4 206·7 684·1 191·6 0·20 0·95 0·93 Muscle 19·26 5·15 19·45 5·9 16·08 6·18 16·43 4·6 0·91 0·19 0·97 ASAT Liver 1706·4 259·4 2027·8 342·5 1729·1 182·7 2309·4 194·7 ,0·05 0·16 0·22 Muscle 131·55 18·05 140·71 51·44 137·73 25·25 124·22 30·68 0·89 0·73 0·46 GDH Liver 174·7 39·3 191·3 41·8 207·7 43·3 206·5 35·9 0·66 0·18 0·61 Muscle 1·09 0·13 1·4 0·56 1·12 0·36 1·42 0·54 0·13 0·92 0·96 HAD Liver 69·07 14·21 72·52 9·59 61·05 6·86 64·69 11·77 0·44 0·09 0·98 Muscle 6·16 2·96 6·09 1·95 6·84 2·41 6·94 1·66 0·99 0·44 0·93 FAS Liver 0·05 0·024 0·01 0·01 0·11 0·06 0·03 0·02 ,0·05 ,0·05 0·78 PFK Muscle 1150·9 156·5 836·8 200·2 1037·2 225·3 928·9 253·3 ,0·05 0·91 0·27
ALAT, alanine aminotransferase; ASAT, aspartate aminotransferase; GDH, glutamate dehydrogenase; HAD, 3-hydroxyacyl-CoA dehydrogenase; FAS, fatty acid synthase; PFK, phosphofructokinase.
British
Journal
of
Nutrition
https://www.cambridge.org/core . Universidade do Algarve , on 06 Jun 2019 at 10:26:56, subject to the Cambridge Core terms of use, available at
https://www.cambridge.org/core/terms
.
sole(14). Dias et al.(14)showed that a diet with 21 % fat led to a reduced specific activity of FAS compared with a diet with 11 % fat. We should also consider that high-fat diets contained a greater amount of n-3 PUFA, which have been proved responsible for decreasing the activity of some lipogenic enzymes, including FAS(51). In the present study, the higher level of dietary starch in the low-fat diets could have further enhanced FAS activity, as it has been found in rainbow trout(16) and blackspot seabream (Pagellus bogaraveo)(48) that digestible carbohydrate favoured lipogenesis. In addition, the higher values of FAS activity in the liver of sole fed the 54 % protein diets suggest that some dietary amino acids could have been used as substrates for de novo lipogenesis, but with a marginal consequence on body lipid content.
The preferential sites for lipid deposition are not quite well defined. In flatfish species, more than two-thirds of the lipid content appears to be located in the bone, fins and brain(11,15,52). Nevertheless, and contrarily to what has been
observed in other marine fishes, it seems that liver is not a pre-ferential organ for lipid deposition in Senegalese sole, since the hepatosomatic index and lipid content were not affected by the dietary protein or lipid content. Moreover, the viscero-somatic index was significantly higher in fish fed the high-lipid diets, showing the capacity of the digestive tract to accumulate perivisceral fat. Indeed, a twofold increase in intestinal lipid content was observed previously in Senegalese sole fed diets with 16 and 20 % lipid levels compared with 4 % lipid diets(15). Mitochondrial b-oxidation is the major energy-producing pathway from fatty acids. From the cleavage of fatty acid in acetyl-CoA, with the reduction of NADþto NADH as part of the b-oxidation spiral(22), ATP can be generated to supply energy and cover cellular energy needs. Compared with the liver, white muscle has a lower enzyme specific activity expressed per unit tissue. However, it is worth consi-dering data from white muscle for the assessment of global b-oxidation capacity due to this tissue’s large size(53). The increase in dietary lipids or dietary protein levels did not change the activity of HAD, one of the key enzymes of the b-oxidation pathway, neither in the liver nor in the muscle of sole. Similar results were observed in rainbow trout (Oncorhynchus mykiss) from different genetic lines (fat line v. lean line) fed high-energy and low-energy diets(3). In haddock (Melanogrammus aeglefinus)(54), there was no sig-nificant increase in mitochondrial or peroxisomal b-oxidation activity in various tissues, when the dietary lipid level increased from 12 to 24 %. In demersal fish such as sole and haddock, specific activity from b-oxidation key enzymes is lower compared with salmon or rainbow trout. Sole(14,15) and gadoid(54,55) fishes, in general, have reduced capacity to accumulate lipids. Muscle, which can constitute more than 50 % of the whole body, is a lean tissue with no more than 5 % of fat (wet weight basis). Overall, the low mitochondrial b-oxidation observed in both tissues (liver and muscle) prob-ably reflects the low lipid levels in these tissues. Fish fed the high-fat diets did not enhance fatty acid oxidation despite the higher whole-body lipid levels and fat intake. The regulat-ory mechanisms involved in the balance between lipid intake, fatty acid oxidation and lipid deposition are intricate with
important physiological implications such as obesity(56,57). When high-lipid diets are chronically ingested, this balance is affected, resulting in lipid accumulation and, consequently, health disorders(58 – 60). The regulatory mechanisms of lipid oxidation and deposition are still not fully understood, and lessons can be taken from lean models to reveal these mechanisms. The absence of the response of HAD to the diet-ary levels of fat could be related to the use of carbohydrate substrates for energy production.
We found that PFK-1 (EC 2.7.1.11) activity was significantly enhanced in the muscle of sole fed the low-lipid diets, regard-less of the dietary protein levels. As mentioned before, the formulation of the 4 % lipid diets was achieved by increasing the proportions of wheat meal and hence resulted in increased starch levels (Table 1). Although Dias et al.(44) found that wheat meal had a lower energy digestibility compared with other ingredients tested, the up-regulation of PFK-1 activity was probably due to higher starch intake in the 4 % lipid diets. PFK-1 catalyses the formation of fructose-1,6-bipho-sphate from fructose-6-phofructose-1,6-bipho-sphate and MgATP, one of the early rate-limiting steps of glycolysis(61,62). In omnivorous or herbivorous fish species, metabolic adaptations to high-carbohydrate diets have been described(41). In the wild, Senegalese sole feeds basically on benthonic invertebrates, such as polychaeta larvae, bivalves, molluscs and small crustaceans(63). However, despite apparent carnivorous feed-ing habits, Senegalese sole presents digestive features gener-ally found in species with omnivorous feeding habits(64), i.e. residual stomach acid digestion and proteolysis and a rather long intestine where pH is always above 6. Dias et al.(14) reported that hepatic activity of glucokinase and pyruvate kinase, other two key glycolytic enzymes, was not affected by the inclusion of high levels of carbohydrates, irrespective of starch type, when the activity was measured 18 – 20 h after the meal. Nevertheless, data obtained in the present exper-iment suggest that glucose is used as a source of energy by the muscle when the lipid supply is limited and the dietary starch content high. In flounder, Lee et al.(37,38)also suggested a possible role of carbohydrates in metabolic energy supply when the dietary lipid level is low (7 % lipid in the diets). This requires further verification through experiments focused on the role of carbohydrates as non-protein energy sources in flatfish.
In conclusion, according to the results achieved so far, dietary lipids do not seem to be a good energy source for promoting growth in S. senegalensis. There is no evidence of a protein-sparing effect by increasing dietary lipid levels, even when the dietary protein level is lowered from 54 to 48 %. The activity of enzymes involved in key metabolic pathways points towards a lack of metabolic adaptation to high lipid levels, reflecting the high protein requirement of the species. The metabolic fate of dietary lipids remains to be fully understood but could be linked to the competition with carbohydrates for energy supply. Data suggest a possible metabolic adaptation to dietary carbohydrates in Senegalese sole, which contrasts with what is generally observed in Salmonids and most marine species.
British
Journal
of
Nutrition
https://www.cambridge.org/core . Universidade do Algarve , on 06 Jun 2019 at 10:26:56, subject to the Cambridge Core terms of use, available at
https://www.cambridge.org/core/terms
.
Acknowledgements
The present study was supported by Fundac¸a˜o para a Cieˆncia e Tecnologia of Portugal (PhD grant SFRH/BD/47,780/2008). The authors would like to thank Christiane Vachot and Laurence Larroquet for their valuable help in the enzyme determinations. P. B. carried out the main experimental work and wrote the draft of the manuscript under the direc-tion of the project designer and leader L. M. P. V.; F. M. and J. D. assisted with the experimental design and draft writing. The authors declare that there are no conflicts of interest.
References
1. Bureau DP, Kaushik SJ, Cho CY, et al. (2002) Bioenergetics. In Fish Nutrition, 3rd ed., pp. 1 – 59 [EH John and WH Ronald, editors]. San Diego, CA: Academic Press.
2. Kaushik SJ (1998) Nutritional bioenergetics and estimation of waste production in non-salmonids. Aquat Living Resour 11, 211 – 217.
3. Kolditz C, Borthaire M, Richard N, et al. (2008) Liver and muscle metabolic changes induced by dietary energy con-tent and genetic selection in rainbow trout (Oncorhynchus mykiss). Am J Physiol Regul Integr Comp Physiol 294, R1154 – R1164.
4. Sargent JR & Tacon AG (1999) Development of farmed fish: a nutritionally necessary alternative to meat. Proc Nutr Soc 58, 377 – 383.
5. Lee DJ & Putnam GB (1973) The response of rainbow trout to varying protein/energy ratios in a test diet. J Nutr 103, 916 – 922.
6. Lee S-M, Park CS & Bang IC (2002) Dietary protein require-ment of young Japanese flounder Paralichthys olivaceus fed isocaloric diets. Fish Sci 68, 158 – 164.
7. NRC (1993) Nutrient Requirements of Fish. Washington, DC: National Academy Press.
8. Peres H & Oliva-Teles A (2008) Lysine requirement and efficiency of lysine utilization in turbot (Scophthalmus maximus) juveniles. Aquaculture 275, 283 – 290.
9. Rema P, Conceicao LEC, Evers F, et al. (2008) Optimal dietary protein levels in juvenile Senegalese sole (Solea senegalensis). Aquac Nutr 14, 1 – 7.
10. Wilson RP, John EH & Ronald WH (2002) Amino acids and proteins. In Fish Nutrition, 3rd ed., pp. 143 – 179. San Diego, CA: Academic Press.
11. Hamre K, Øfsti A, Næss T, et al. (2003) Macronutrient com-position of formulated diets for Atlantic halibut (Hippoglossus hippoglossus, L.) juveniles. Aquaculture 227, 233 – 244. 12. Bromley PJ (1980) Effect of dietary protein, lipid and energy
content on the growth of turbot (Scophthalmus maximus L.). Aquaculture 19, 359 – 369.
13. Helland SJ & Grisdale-Helland B (1998) Growth, feed utilization and body composition of juvenile Atlantic halibut (Hippoglossus hippoglossus) fed diets differing in the ratio between the macronutrients. Aquaculture 166, 49 – 56. 14. Dias J, Rueda-Jasso R, Panserat S, et al. (2004) Effect of
diet-ary carbohydrate-to-lipid ratios on growth, lipid deposition and metabolic hepatic enzymes in juvenile Senegalese sole (Solea senegalensis, Kaup). Aquac Res 35, 1122 – 1130. 15. Borges P, Oliveira B, Casal S, et al. (2009) Dietary lipid
level affects growth performance and nutrient utilisation of Senegalese sole (Solea senegalensis) juveniles. Br J Nutr 102, 1007 – 1014.
16. Alvarez MJ, Lopez-Bote CJ, Diez A, et al. (1999) The partial substitution of digestible protein with gelatinized starch as
an energy source reduces susceptibility to lipid oxidation in rainbow trout (Oncorhynchus mykiss) and sea bass (Dicentrarchus labrax) muscle. J Anim Sci 77, 3322 – 3329. 17. Dias J, Alvarez MJ, Diez A, et al. (1998) Regulation of hepatic
lipogenesis by dietary protein/energy in juvenile European seabass (Dicentrarchus labrax). Aquaculture 161, 169 – 186. 18. Dabrowski K & Guderley H (2003) Intermediary metabolism. In Fish Nutrition, 3rd ed., pp. 309 – 365 [EH John and WH Ronald, editors]. San Diego, CA: Academic Press.
19. Fynn-Aikins K, Hughes SG & Vandenberg GW (1995) Protein retention and liver aminotransferase activities in Atlantic salmon fed diets containing different energy sources. Comp Biochem Physiol A Mol Integr Physiol 111, 163 – 170. 20. Meto´n I, Mediavilla D, Caseras A, et al. (1999) Effect of diet
composition and ration size on key enzyme activities of glycolysis-gluconeogenesis, the pentose phosphate pathway and amino acid metabolism in liver of gilthead sea bream (Sparus aurata). Br J Nutr 82, 223 – 232.
21. Fernandez F, Miquel AG, Cordoba M, et al. (2007) Effects of diets with distinct protein-to-carbohydrate ratios on nutrient digestibility, growth performance, body composition and liver intermediary enzyme activities in gilthead sea bream (Sparus aurata, L.) fingerlings. J Exp Mar Biol Ecol 343, 1 – 10. 22. Rinaldo P, Matern D & Bennett MJ (2002) Fatty acid oxidation
disorders. Annu Rev Physiol 64, 477 – 502.
23. AOAC (2006) Official Methods of Analysis of AOAC Inter-national, 18th ed., chapter 32, pp. 38 – 39. Gaithersburg, MD: AOAC International.
24. Folch J, Lees M & Sloane Stanley GH (1957) A simple method for the isolation and purification of total lipides from animal tissues. J Biol Chem 226, 497 – 509.
25. Kobayashi A, Jiang LL & Hashimoto T (1996) Two mito-chondrial 3-hydroxyacyl-CoA dehydrogenases in bovine liver. J Biochem 119, 775 – 782.
26. Bergmeyer HU (editor) (1974) Glutamate-Oxaloacetate Transaminase. UV-Assay, Manual Method. New York: Academic Press.
27. Hsu RY & Butterworth PHW (1969) Pigeon liver fatty acid synthetase. In Methods of Enzymology, pp. 33 – 39 [J Lownstein, editor]. New York, NY: Academic Press. 28. Bradford MM (1976) A rapid and sensitive method for
the quantitation of microgram quantities of protein utilizing the principle of protein dye binding. Anal Biochem 72, 248 – 254.
29. Zar JH (1999) Biostatistical Analysis, 4th ed. London: Prentice Hall.
30. Valente LMP, Linares F, Villanueva JLR, et al. (2011) Dietary protein source or energy levels have no major impact on growth performance, nutrient utilisation or flesh fatty acids composition of market-sized Senegalese sole. Aquaculture 318, 128 – 137.
31. Company R, Calduch-Giner JA, Kaushik S, et al. (1999) Growth performance and adiposity in gilthead sea bream (Sparus aurata): risks and benefits of high energy diets. Aquaculture 171, 279 – 292.
32. Company R, Calduch-Giner JA, Perez-Sanchez J, et al. (1999) Protein sparing effect of dietary lipids in common dentex (Dentex dentex): a comparative study with sea bream (Sparus aurata) and sea bass (Dicentrarchus labrax). Aquat Living Resour 12, 23 – 30.
33. Hillestad M & Johnsen F (1994) High-energy/low-protein diets for Atlantic salmon: effects on growth, nutrient reten-tion and slaughter quality. Aquaculture 124, 109 – 116. 34. Grisdale-Helland B & Helland SJ (1998) Macronutrient
utili-zation by Atlantic halibut (Hippoglossus hippoglossus): diet digestibility and growth of 1 kg fish. Aquaculture 166, 57 – 65.
British
Journal
of
Nutrition
https://www.cambridge.org/core . Universidade do Algarve , on 06 Jun 2019 at 10:26:56, subject to the Cambridge Core terms of use, available at
https://www.cambridge.org/core/terms
.
35. Caceres-Martinez C, Cadena-Roa M & Me´tailler R (1984) Nutritional requirements of turbot (Scophthalmus maximus): I. A preliminary study of protein and lipid utilization. J World Mariculture Soc 15, 191 – 202.
36. Regost C, Arzel J, Cardinal M, et al. (2001) Dietary lipid level, hepatic lipogenesis and flesh quality in turbot (Psetta maxima). Aquaculture 193, 291 – 309.
37. Lee S-M, Cho SH & Kim K-D (2000) Effects of dietary protein and energy levels on growth and body composition of juvenile flounder Paralichthys olivaceus. J World Aquacult Soc 31, 306 – 315.
38. Lee S-M, Kim K-D & Lall SP (2003) Utilization of glucose, maltose, dextrin and cellulose by juvenile flounder (Paralichthys olivaceus). Aquaculture 221, 427 – 438. 39. Cho CY, Hynes JD, Wood KR, et al. (1994) Development
of high-nutrient-dense, low-pollution diets and prediction of aquaculture wastes using biological approaches. Aqua-culture 124, 293 – 305.
40. Stone DAJ (2003) Dietary carbohydrate utilization by fish. Rev Fish Sci 11, 337 – 369.
41. Wilson RP (1994) Utilization of dietary carbohydrate by fish. Aquaculture 124, 67 – 80.
42. Enes P, Panserat S, Kaushik S, et al. (2011) Dietary carbo-hydrate utilization by European sea bass (Dicentrarchus labrax L.) and gilthead sea bream (Sparus aurata) juveniles. Rev Fish Sci 19, 201 – 215.
43. Figueiredo-Silva AC, Panserat S, Kaushik S, et al. (2011) High levels of dietary fat impair glucose homeostasis in rainbow trout. J Exp Biol 215, 169 – 178.
44. Dias J, Yu´fera M, Valente LMP, et al. (2010) Feed transit and apparent protein, phosphorus and energy digestibility of practical feed ingredients by Senegalese sole (Solea senegalensis). Aquaculture 302, 94 – 99.
45. Lupia´nez JA, Sa´nchez-Lozano MJ, Garcı´a-Rejo´n L, et al. (1989) Long-term effect of a high-protein/non-carbohydrate diet on the primary liver and kidney metabolism in rainbow trout (Salmo gairdneri). Aquaculture 79, 91 – 101.
46. Alexis MN & Papaparaskeva-Papoutsoglou E (1986) Amino-transferase activity in the liver and white muscle of Mugil capito fed diets containing different levels of protein and carbohydrate. Comp Biochem Physiol B Biochem Mol Biol 83, 245 – 249.
47. Campos C, Valente LMP, Borges P, et al. (2010) Dietary lipid levels have a remarkable impact on the expression of growth-related genes in Senegalese sole (Solea senegalensis Kaup). J Exp Biol 213, 200 – 209.
48. Figueiredo-Silva AC, Corraze G, Rema P, et al. (2009) Black-spot seabream (Pagellus bogaraveo) lipogenic and glycolytic pathways appear to be more related to dietary protein level than dietary starch type. Aquaculture 291, 101 – 110.
49. Arnesen P, Krogdahl A˚ & Kristiansen IØ (1993) Lipogenic enzyme activities in liver of Atlantic salmon (Salmo salar, L.). Comp Biochem Physiol B Biochem Mol Biol 105, 541 – 546. 50. Likimani TA & Wilson RP (1982) Effects of diet on lipogenic
enzyme activities in channel catfish hepatic and adipose tissue. J Nutr 112, 112 – 117.
51. Teran-garcia M, Adamson AW, Yu G, et al. (2007) Polyunsa-turated fatty acid suppression of fatty acid synthase (FASN): evidence for dietary modulation of NF-Y binding to the Fasn promoter by SREBP-1c. Biochem J 402, 591 – 600. 52. Berge GM & Storebakken T (1991) Effect of dietary fat level
on weight gain, digestibility, and fillet composition of Atlan-tic halibut. Aquaculture 99, 331 – 338.
53. Stubhaug I, Frøyland L & Torstensen B (2005) b-Oxidation capacity of red and white muscle and liver in Atlantic salmon (Salmo salar) – effects of increasing dietary rape-seed oil and olive oil to replace capelin oil. Lipids 40, 39 – 47. 54. Nanton DA, Lall SP, Ross NW, et al. (2003) Effect of dietary lipid level on fatty acid beta-oxidation and lipid composition in various tissues of haddock, Melanogrammus aeglefinus L. Comp Biochem Physiol B Biochem Mol Biol 135, 95 – 108.
55. Nanton DA, Lall SP & McNiven MA (2001) Effects of dietary lipid level on liver and muscle lipid deposition in juvenile haddock, Melanogrammus aeglefinus L. Aquac Res 32, 225 – 234.
56. Raben A, Agerholm-Larsen L, Flint A, et al. (2003) Meals with similar energy densities but rich in protein, fat, carbohydrate, or alcohol have different effects on energy expenditure and substrate metabolism but not on appetite and energy intake. Am J Clin Nutr 77, 91 – 100.
57. Westerterp KR, Smeets A, Lejeune MP, et al. (2008) Dietary fat oxidation as a function of body fat. Am J Clin Nutr 87, 132 – 135.
58. Pi-Sunyer FX (2002) The obesity epidemic: pathophysiology and consequences of obesity. Obesity 10, 97S – 104S. 59. Lazar MA (2005) How obesity causes diabetes: not a tall tale.
Science 307, 373 – 375.
60. Bessesen DH, Bull S & Cornier MA (2008) Trafficking of diet-ary fat and resistance to obesity. Physiol Behav 94, 681 – 688. 61. Su JY & Storey KB (1995) Fish muscle phosphofructokinase: influences of protein concentration on enzyme kinetic beha-viour. Int J Biochem Cell Biol 27, 1277 – 1283.
62. Mediavilla D, Meto´n I & Baanante IV (2007) Purification and kinetic properties of 6-phosphofructo-1-kinase from gilthead sea bream muscle. Biochim Biophys Acta 1770, 706 – 715. 63. Cabral HN (2000) Comparative feeding ecology of sympatric
(Solea solea) and (S. senegalensis), within the nursery areas of the Tagus estuary, Portugal. J Fish Biol 57, 1550 – 1562. 64. Yu´fera M & Darı´as MJ (2007) Changes in the gastrointestinal
pH from larvae to adult in Senegal sole (Solea senegalensis). Aquaculture 267, 94 – 99.
British
Journal
of
Nutrition
https://www.cambridge.org/core . Universidade do Algarve , on 06 Jun 2019 at 10:26:56, subject to the Cambridge Core terms of use, available at
https://www.cambridge.org/core/terms
.