M
ASTER IN
F
INANCE
M
ASTER
’
S FINAL WORK
P
ROJECT
W
ORK
E
QUITY
R
ESEARCH
–
L
UZ
S
AÚDE
P
EDRO
J
OSÉ
F
ERNANDES
A
LVES
M
ASTER IN
F
INANCE
M
ASTER
’
S
F
INAL
W
ORK
P
ROJECT
W
ORK
E
QUITY
R
ESEARCH
–
L
UZ
S
AÚDE
P
EDRO
J
OSÉ
F
ERNANDES
A
LVES
S
UPERVISIONP
ROFESSORD
R.
C
ARLOSM
ANUELC
OSTAB
ASTARDOI ABSTRACT
Luz Saúde, S.A. is one of the largest companies within the Portuguese health sector. Offering differentiated services, the company achieved considerable growth, in spite of the ongoing economic crisis. Given its structure and desirability to foreign investors, it would eventually be acquired almost entirely in 2014.
This study aims to determine the intrinsic value of Luz Saúde, S.A.’s shares, through a detailed analysis of the group's operating performance and external environment. The evaluation was based on the method of discounted cash flows, which according to the literature review, is the best methodology for evaluating Luz Saúde. This evaluation suggests that the company’s share price on 12/31/2014 was underestimated, i.e. the share was rated below its intrinsic value of 3.80 euros, thus presenting a potential of appreciation of 22, 15%, resulting in a recommendation to buy for interested investors.
Keywords: Evaluation of Companies; Free Cash Flow to Firm; Enterprise Value, Equity
II Resumo
Luz Saúde, S.A. é uma das maiores empresas da área da saúde em Portugal. Com um serviço diferenciado a empresa tem conseguido um crescimento considerável mesmo em períodos económicos adversos. Com uma estrutura e área de negócio bastante apetecível a investidores estrangeiros, acabou por ser adquirida quase na totalidade em 2014.
Este trabalho tem como objetivo determinar o valor intrínseco das ações da Luz Saúde, através de uma análise detalhada do desempenho operacional do grupo e de seu ambiente externo. A avaliação foi baseada no método dos fluxos de caixa descontados, que de acordo com o estabelecido na revisão da literatura constitui a melhor metodologia para avaliar a Luz Saúde.
Com esta avaliação, foi possível concluir que o valor da ação da Luz Saúde em 31/12/2014 encontra-se subvalorizada, ou seja, foram cotados abaixo do seu valor intrínseco 3,80 euros, apresentando assim um potencial de valorização de 22,15%, foi dada uma recomendação de compra aos investidores interessados.
Keywords: Evaluation of Companies; Free Cash Flow to Firm; Enterprise Value, Equity
III ACKNOWLEDGMENTS
The successful task of presenting this Dissertation today was punctuated by the support and incentive of several key players of my life. I know, without a shred of doubt, that I would not have been able to do so, in accordance to the time table defined and in light of the personal and professional reality in which I live in, had it not been for their patience and understanding towards this endeavour of mine, and for that I will be forever grateful.
To Dr. Carlos Manuel Costa Bastardo, for his guidance in the interpretation of the reports that were subject of observation, for his ever-present help in obtaining the papers required to fulfil my Dissertation, for his complete and total availability whenever I needed his mentoring, and for his help in solving and overcoming the many hardships that were presented to me throughout the making of this Master’s Final Work.
To my colleagues and friends, Catarina Firmino, Cláudia Vinhas de Sousa and André Ramos, for their companionship, support, words of incentive, commitment and availability throughout this long two-year hike, punctuated with ups and downs, one that we overcame together by being an united and close front.
To my parents, Ângelo dos Santos Alves and Isabel Baptista Fernandes Alves, to my brother Hugo André Alves Fernandes and to my lifemate Joana Cristina Cardoso Teixeira Ribeiro, for being the support pillar that was paramount in my successful undertaking and accomplishment at hands.
IV Index 1) Introduction ... 1 1.1) Background ... 1 1.2) Project Structure ... 2 2) Literature Review ... 4 2.1) Company Evaluation ... 4 2.2) Methods of evaluation... 4
2.2.1 Discounted Cash Flow (DCF) ... 5
3) Luz Saúde, S.A. ... 15
3.1) Company and business presentation ... 15
3.2) Operational Performance ... 17
3.3) Market Performance, Stakeholders structure ... 20
4) National Economic Perspective and the Sector ... 22
4.1) Sector Analisys... 23
5) Strategic analysis ... 25
5.1) SWOT Analysis ... 25
5.2) 5 Forces of Porter Analysis ... 25
6) Evaluation ... 26
6.1) Methodology ... 26
6.2) Assumptions ... 27
6.2.1) Turnover ... 27
6.2.2) EBITDA ... 27
6.2.3) Investment in non current assets and depreciations ... 27
6.2.4) Investment in working capital ... 28
6.2.5) Risk-free Assets... 28
6.2.6) Cost of Debt ... 28
6.2.7) Beta ... 29
6.2.8) Market Risk Premium... 29
6.2.9) Tax Rate ... 29
6.2.10) Equity weight and Financial Debt ... 29
6.2.11) APV (Adjusted Present Value) ... 30
6.3) FCFF of Company ... 30
7) Evaluation Results ... 31
8) Sensitivity analysis... 32
V
Bibliography ... 36
Annex ... 39
Annex 1 – Alternative evaluation methods ... 39
Liquidation and Accounting Valuation ... 39
Relative Valuation ... 40
Contingent Claim Valuation ... 41
Annex 2 – Sector Ratios ... 42
Annex 3 – Five Forces of Porter ... 44
Annex 4 - Financial indicators ... 45
Annex 5 – Financial Ratios ... 45
Annex 6 – Other evaluations ... 46
WACC: ... 46
FTE: ... 46
Table Index: Table 1 - Methods of evaluation ... 5
Table 2 - Data from last 5 Years ... 17
Tabla 3 - Operational Data ... 18
Tabla 4 - Structural Data ... 19
Table 5 - Five Forces of Porter ... 44
Table 6 - Financial indicators ... 45
Table 7 - Financial Ratios ... 45
Plot Index: Plot 1 - Investment Flutuation in Health ... 1
Plot 2 - Distribution of Investment in Health ... 2
Plot 3 - Price PSI GERAL vs LUZ SAÚDE ... 21
Plot 4 - Fluctuation PSI Geral vs Luz Saúde, S.A. ... 21
Plot 5 - ROI ... 42
Plot 6 - ROE ... 42
Plot 7 - ROS ... 42
Plot 8 - Leverage ... 43
Plot 9 - Leverage Struture ... 43
VI Glossary:
APT – Arbitrage Pricing Theory APV – Adjusted Present Value B - Beta
Capex – Capital expenditures CAPM – Capital Asset Pricing Model CI – Capital Invested
D – Debt
DCF – Discounted Cash Flow DDM – Dividend Discount Model DPS – Dividend per share
E – Equity
EBIT – Earnings before Interest and Taxes
EBITDA – Earnings before Interest, Taxes, Depreciation and Amortization EPS – Earnings per share
EVA – Economic Value Added FCFE – Free Cash Flow to Equity FCFF – Free Cash Flow to Firm FTE – Flow to Equity
G – Growth Rate
GDP - Gross domestic product Ke – Cost of Equity
Kd – Cost of Debt
M&A - Merge and Acquisitions
NOPAT - Net Operating Profit After Tax PBV – Price to Book Value Ratio PE - Price Earnings Ratio PS – Price to Sales Ratio Rf – Risk Free Rate ROE – Return on Equity ROI – Return on Investment ROS – Return on Sales
SWOT – Strengths; Weaknesses; Opportunities; Threats T - Taxes
1
1)
Introduction
1.1) Background
The financial crisis that hit Portugal between 2010 and 2014, following the global financial crisis of 2007 - 2008, coupled with the euro zone’s public debt crisis, affected every economic activity in Portugal. With a high structural deficit, the Portuguese government was forced to reduce investments. One of the sectors where this disinvestment was particularly noticeable was the public health sector, with a decrease of 16% between 2010 and 2014. The private health sector, however, made an investment of 0.41% in the same period.
Plot 1 - Investment Flutuation in Health
Regarding relative weight, the disinvestment in the public sector and stabilization in the private sector caused the disparity between public investment in public and private health to eventually be reduced.
2010 2011 2012 2013 2014
Private Health Sector 0,00% 1,79% 0,43% -4,17% 2,50%
Public Health Sector 0,00% -8,22% -8,76% -0,24% 0,68%
Total Investment 0,00% -5,22% -5,80% -1,59% 1,28% -10,00% -8,00% -6,00% -4,00% -2,00% 0,00% 2,00% 4,00% Δ
2
Plot 2 - Distribution of Investment in Health
The private health sector was one of the few sectors showing great potential in the Portuguese market, even within the financial crisis context.
The main objective of this project is to evaluate Luz Saúde, S.A., determining the intrinsic value of its shares on 12/31/2014. Evaluating a company requires a detailed analytic approach, considering every variable that affects its value, including external - macroeconomic or industry factors -, and internal variables - financial indicators, business segments, strategies and growth prospects. This is a very important analysis, contributing to the efficiency of the financial market, and providing new information and recommendations to investors on whether to buy or sell the company’s shares.
Luz Saúde, S.A. is one of the largest companies in the Portuguese private health sector, competing directly with the market’s leading groups: the Mello Group and Lusiadas Group.
1.2) Project Structure
This work is structurally divided in six sections:
2010 2011 2012 2013 2014
Private Health Sector 30% 32% 34% 33% 34%
Public Health Sector 70% 68% 66% 67% 66%
0% 10% 20% 30% 40% 50% 60% 70% 80% %
3
The first section corresponds to the literature review, where every methods of
assessment will be referred, but only the discounted cash flows method will be analyzed, summarizing the leading academic publications on the subject. This review will make it easier to understand the method’s application and identify the most appropriate methodology for evaluating Luz Saúde, S.A.;
The second section contains a detailed analysis of Luz Saúde S.A. in the last five
years, particularly regarding its objectives, strategies and operational and market performance;
The third section covers the sector’s and macroeconomic
framework/background, presenting each direct competitor;
The fourth section comprises a strategic analysis of the company using two
important management tools: SWOT and Porter's 5 Forces analyses. This strategic analysis is the result of a compilation of conclusions drawn from the analyses carried out in the second and third sections;
The fifth section details the evaluation of Luz Saúde S.A. Initially, the main
assumptions will be defined, and then the evaluation method - Free Cash Flow To Firm (FCFF) - will be applied;
Finally, in the last section, the assessment results will be presented and
analyzed; the main objective will be to compare the intrinsic value of the shares to their market value, in order to subsequently give recommendations to future investors.
4
2)
Literature Review
2.1) Company Evaluation
A company evaluation is the process of determining the value of a commercial, industrial, service or investment organization, in order to pursue an economic activity, Neves (2002). According to Damodaran (2006), evaluations are pivotal in finances, being used in different business contexts, specifically in portfolio management in merge and acquisitions (M&A), and in Corporate Finance. In Corporate Finance, the best way to add value to a company is investigated changing their investment decisions, financing and dividend policy, Damodaran (2006). In portfolio management, the importance of an evaluation depends on the investor's characteristics; for a passive profile investor, the evaluation has a minor role, whereas to an active profile investor, evaluation is key, Damodaran (2002). Finally, in M&A, an evaluation of the same company can result in different values. The buyer’s assessment might not respond normally to the seller’s or even to other buyers’ assessments due to different perceptions of the industry and the company, Fernandez (2007). According to Fernandez (2007), anyone working in Corporate Finance must understand the mechanisms involved in company evaluation, not only because of its importance for valuing M&A, but also because identifying the sources of creation and destruction of the company’s economic value is fundamental.
2.2) Methods of evaluation
There are various models for evaluating companies. Hence, the first step is precisely to select which method to use, based on each model’s diversity and complexity, and
5
features implemented by each author. In this case, and in order to simplify this process, the perspective by Damadoran (2006), dividing assessment methods into four categories, will be considered:
Discounted Cash Flow Valuation;
Liquidation and Accounting valuation;
Relative Valuation;
Contingent Claim Valuation.
The following table presents the models that can be used in each of the abovementioned methods, according to Damodaran (2006):
Table 1 - Methods of evaluation
Discounted Cash Flow (DCF)
Liquidation and Accounting
valuation Relative Valutation
Contingent Claim Valuation
Equity DCF Models: - Book Value Multiples: - Black Scholes
- Dividend Discount Model (DDM) - Liquidation Value - - Binomial Value - Free Cash Flow to Equity (FCFE) - Fair Value Valuation - PE
Firm DCF Models - PBV
- Free Cash Flow to Firm (FCFF) - PS
- Economic Value added (EVA)
Adjusted Present Value (APV)
2.2.1 Discounted Cash Flow (DCF)
In an evaluation using the discounted cash flow, the value of an asset is the present value of expected cash flows of the asset, discounted at a rate that reflects the risk of those cash flows. The use of DCF is also considered somehow an act of faith, as it assumes that each asset has an intrinsic value, and tries to estimate this value based on its characteristics, Damodaran (2006).
6
The evaluation of discounted cash flows is based on future cash flows and discount rates. Given these data, this approach is easier to apply to assets (companies) whose cash flows are currently positive and can be estimated with sufficient reliability for future periods, where a proxy for the risk can be used to obtain discount rates. The closer one gets to this idealized scenario, the more difficult it is to assess the cash flows, Damodaran (2002).
Although there are many DCFs, this study will focus on the most consensual and widely used methods for evaluating companies.
As summarized in Table 1, this study will refer the following methods:
Equity Discounted Cash Flow Models; Firm Discounted Cash Flow Models; Adjusted Present Value.
2.2.1.1 Equity Discounted Cash Flow Models
The market value of a company’s equity is obtained by updating the equity’s cash flow to a return rate of the company's equity. When this value is added to the market value of the financial debt, it is possible to determine the total value of a company, Fernandez (2007).
There are two models in this category:
Dividend Discounted Model (DDM); Free Cash Flow to Equity (FCFE).
7
Dividend Discounted Model (DDM)
The cash flow models based on discounted dividends are the oldest, but many analysts abandoned these methods, considering them too conservative. However, many of the discounted cash flow models are founded on dividends. According to this model, the value of an asset is represented by cash flows from dividends generated by the asset, discounted at the risk rate required by investors (K ), i.e., the equity return rate. The cash flows from dividends and the equity return rate are the two model indicators. To obtain the expected dividends it is necessary to consider certain assumptions on payout and dividend growth rates. The equity return rate can be calculated using the CAPM, through the Beta factor in arbitrage, and in multi-factor models, Damodaran (2006). This model has been studied for a long time, having been Williams (1938) the first author to identify the correlation between the share value and dividends. Durant (1957) created a variant for the DDM model, but Gordon (1962) was the one who popularized the model. In addition to the indicators of the initial model, this model also considers a growth rate constant, (g). The model has two important considerations for calculating growth rate:
- Considering that the dividend growth rate is perpetual, it cannot exceed the income growth rate;
- Second, it is considered that other performance measures may have a growth equal to the dividends growth rate.
Value of Stock = Expected Dividends next period
(Cost of Esquity – Expected growth rate in perpetuity)
Fuller and Hsia (1984) created a new variant of the Gordon model, the H. Model. This model considers two stages of growth rate, a stable growth phase and variable growth
8
phase, bypassing problems associated with abrupt changes in growth rate, when transitioning to the stable growth rate phase.
P =DPS × (1 + g )
(r − g ) +
DPS × H × (g − g ) (r − g )
The great advantage of this model is its ease of application and calculation. Nonetheless, it has some limitations, especially regarding the cash flow applied to shareholders, as it is normal for companies to retain incomes, withholding some of the capital available. Consequently, this will result in a higher FCFE than DDM, thus adulterating the model, Damodaran (2006).
Free Cash Flow to Equity (FCFE)
The FCFE model follows much of the DDM model’s logic. It differs in the fact that, instead of cashing the actual dividends, it discounts the potential dividends. Damodaran (1994) defines the model as a way to capture the free cash flows after necessary reinvestment and payment of financial debt have been made.
FCFE = Net Income + Depreciation − Capital Expendditures
− Change in noncash working capital − (New Debt Issued − Debt repayments)
The use of this model is especially appropriate for shareholder restructuring, such as M&A, and for evaluating financial institutions, because in these situations it is necessary to jointly assess the operating and financial decisions, Goedhart (2005). This model was calculated and is available in the annex only for information purposes.
9
2.2.1.2 Firm Discounted Cash Flow Models
These models are an alternative to equity-based models. In this case, the company is evaluated as a whole, considering the total investment, i.e. equity and financial debt. The model is built based on an average capital ratio, combining the equity return rate with the foreign capital return rate. In these models, it is also important to consider that there are tax benefits due to the use of financial debt, Damodaran (2006).
The most relevant models within this category are:
Free Cash Flow to Firm (FCFF); Economic Value Added (EVA).
Free Cash Flow to Firm (FCFF)
An assumption of the FCFF - as for the FCFE model - is the application of a continuous growth (g). Hence, the basis of the following year’s FCFF model is the average capital cost rate and the perpetual growth rate.
Company Value = FCFF
WACC − g
Following the FCFE Model, the FCFF model shares the same conditions:
The growth rate cannot equal or exceed the economic growth;
The company's characteristics must be consistent with the assumptions of
growth stability, namely, the reinvestment rate used to estimate the cash flows for the company must be consistent with the stability of the growth rate.
10
These assumptions were analyzed by Miles and Ezzel in 1980, who concluded that it is possible to achieve a tax benefit with perpetual growth by upgrading these cash flows to the cost of equity rate, Damodaran (2006 ).
FCFF = Operating Cash Flow − Expenses − Taxes − Change in NWC − Changes in Investments
Weighted Average Cost of Capital (WACC)
WACC is calculated by weighting the debt cost (Kd) and the equity cost (Ke) on the company's financial structure. This is the appropriate rate for situations in which we evaluate the company as a whole (debt and capital), considering the required equity return according to the proportion of capital invested by each party, Fernandez (2007).
WACC = E
E + D × K +
D
E + D × K × (1 − T)
Hence, the variables Tax Rate, Equity and Financial Debt Capital are calculated directly, whereas for the calculating Ke and Kd rates it is necessary to rely on assumptions. This model was calculated and is available in the annex only for information purposes.
Equity Cost (Ke)
Equity’s return rate is defined as the rate that investors require for their investment. In order to estimate this indicator, it is necessary to determine the expected return rate of the company's shares. As expected return rates are unobservable, we use prefixing models of risky assets that translate into expected return.
The most common model used for calculating this rate is the Capital Asset Price Model - CAPM (Sharpe 1964). However, there are other models, such as the Arbitrage Price
11
Model - APT (Ross 1976) and the three factors model, by Fama and French (2004). These designs differ mainly in the way they define risk.
The CAPM defines the risk of an action as its sensitivity to the stock market, being the most common, Goedhart et al (2005a).
E(R ) = R + β × E[R − R ]
Risk Free Rate ( )
According to Damodaran in his article "Estimating Risk Free Rates", there are two essential requirements to define a risk-free rate:
"There can be no risk default associated with its cash flows" and; "There can be no reinvestment risk."
In order to consider that there is no risk, one cannot consider companies because they lack the ability to issue currency, unlike countries. Hence, the selection should be performed from countries at no risk of default, and there are no better candidates for this than countries with AAA rating.
For this reason, and because we are considering companies located in Europe, the best basis for defining a risk-free interest rate is the German government bonds, since it is one of the few countries meeting the requirements for selecting a risk-free rate.
Beta ( )
The Beta coefficient is an indicator that measures the risk, having two key features for the calculation process:
12
- Second, the Betas measure the relative risk of an asset, standardized in value 1.
Betas can be calculated based on the unlevered industry’s Beta, because the sector is exposed to similar operational risks. Thus, Beta can be calculated using the following formula, Damodaran (1999):
β = β [ 1 + (1 − t)D
E ]
Another way to calculate Beta is through a linear regression between the asset returns and the index returns, using the following formula, Damodaran (1999):
E[R ] = a + β + E[R ]
Market risk premium ( )
This indicator reflects the market risk and can be divided into three classifications, Damodaran (2012):
Award Required - Extra value demanded by investors in order to invest in risky assets;
Award History - Difference between the average returns of the market portfolio and the risk-free interest rate;
Implicit Award – Future estimation based on market rates or asset prices traded today.
According to ERSE (2014), the risk award for investors to invest in risk assets in Portugal is 6.25 %.
13
Cost of Debt ( )
Debt cost is the rate that financial lenders require to invest capital. The best way to estimate this value is to consider the yield to maturity of a long-term obligation that is sold in the secondary market.
Another way to estimate debt cost to companies that do not issue bonds is using the default spread, plus the interest rate without risk, Damodaran (2002).
Economic Value Added (EVA)
According to Ferreira (2002), EVA is " ... a concept perfectly articulated with the new financial theory, where the value of a company is equal to the sum of updated cash flows for shareholders and creditors... '. This is an indicator that arose from minor changes to a previous one, named "Residual Income".
This concept exists since 1777, although it has evolved over the years with several names, having first been named "Residual Income" in 1965 by Anthony and Solomons.
In 1995 it was named "Economic Profit" by Copeland and Murri, and finally in 1990 the company Stern & Co. assigns its current designation, "Economic Value Added". This indicator arose from the need to create value for shareholders, being Rappaport, with his article Harvard Business Performance (1981) and book Greating Shareholder Value - The New Standard for Business Performance (1986), one of the main drivers of this movement. This ended up resurrecting this metric, as mentioned Neves (2011) "...having finally left the academic books and passed to the business practice.".
EVA is a more effective form of performance evaluation, as it considers all the financial investment in the company: by the capital holder, by financial creditors, and
14
considering the interest rates required by each party. Finally, these interest rates are applied to the operational income created during the reviewed period, thus obtaining the net value created for shareholders.
For Martin and Petty (2000), their definition of EVA is no more than a new metric improved by economic profits.
EVA = NOPAT − WACC × CI
2.2.1.3 Adjusted Present Value Model (APV)
The APV model separates the effect of the financial debt from the value of the assets associated with the business. This model starts with the evaluation of the unlevered company. Afterwards, the effect of the debt and the resulting tax benefits associated with this debt are added. The first attempt to isolate the tax benefits of debt was from Modigliani (1963), using the cost rate debt as refresh rate of a perpetuity. The current form of the APV model was presented by Myers (1974) as the relationship between investment and financing decisions, Damodaran (2006).
In this model the evaluation is done in three steps, beginning with estimating the value of the company without debt, then considering the updated value of the debt tax benefits, and finally assessing the probability of default and its respective cost through the effect of contracted debt, Damodaran (2006).
First Step:
= + (1 + )
−
15
= × ×
(1 + )
Third Step:
[ ] = ( ) × ( )
The advantage of this model relies on its ability to separate the debt effect on its several components, allowing the analyst to use different refresh rates for each component. The major drawback of this model involves the difficulty in estimating the probability of default and cost, Damodaran (2002).
3)
Luz Saúde, S.A.
3.1) Company and business presentation
After being aquired by Fidelidade - mostly (80%) controled by the Chinese company Fosun -, Espírito Santo Saúde became Luz Saúde, S.A.. This open society saw its capital be almost entirely acquired (96.067%) on 17 October 2014, with a price per share of € 5.01, representing a total investment of 478 million euros. By the end of the fiscal period of 2014, Luz Saúde was held by Fidelidade on 98,2%.
Luz Saúde Group is one of the largest players in the private health sector, a market dominated by four entities: Mello Group, Luz Saúde Lusíadas and Trofa Saúde, representing 83% of the market, Luz Saúde appears in second place with about 25% market share, behind the Mello Group, holding a position of approximately 40% in the market.
16
The story of this successful group began in 2000, with the acquisition of a majority stake in the capital of CLIR, owner of Aveiro Private Hospital and the Arrabida Hospital. It has since undergone various processes of M&A, and construction involving private Hospitals, clinics and even senior residences.
The group currently owns 8 private hospitals, 7 ambulatory clinics, 1 private hospital in a PPP regime, and 2 local senior homes.
The Lusíadas Saúde Group, formerly known as Private Hospitals of Portugal, SA, was acquired on March 1, 2013 by the Brazilian Amil Group for ca. 85.6 million euros. The group was renamed to Lusíadas Saúde immediately following the acquisition.
This is one of the largest players in the private health market, including the third largest brand, behind Mello and Espirito Santo Saúde Group, with a share market of approximately 23%.
The Lusíadas Group began operating in March 1998, still under the Private Hospitals of Portugal designation, managing the Hospital Privado dos Clérigos, immediately launching the construction of Boavista Private Hospital.
Today it is one of the most important brands within the private health sector, owning 4 Private Hospitals, 4 Clinics and 1 Private Hospital under PPP regime, employing 4000 professionals.
The Mello Saúde Group was the first entity to work in the health sector in Portugal. It started its activity in 1945, with the inauguration of the Hospital CUF Infante Santo. Nowadays, it is the largest business group in the health area in Portugal, with ca. 40%
17
of the market share and, because it is not quoted on the stock market, it continues to be a closed group without dispersed capital.
It currently comprises 6 private hospitals, 5 private clinics, 1 institute, 2 hospitals under PPP regime, and a insurance and work health organization, with a staff of about 7000 employees.
3.2) Operational Performance
Luz Saúde has shown some variation in terms of performance indicators over the last five years, similarly to competing companies. However, the results have always been positive with the exception of the year 2012, when the net result dropped to negative levels, inverting the position of the previous years.
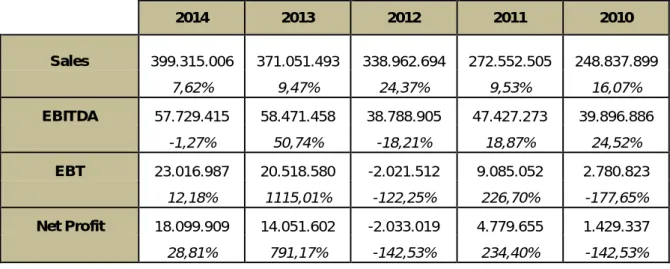
Table 2 - Data from last 5 Years
2014 2013 2012 2011 2010 Sales 399.315.006 371.051.493 338.962.694 272.552.505 248.837.899 Δ 7,62% 9,47% 24,37% 9,53% 16,07% EBITDA 57.729.415 58.471.458 38.788.905 47.427.273 39.896.886 Δ -1,27% 50,74% -18,21% 18,87% 24,52% EBT 23.016.987 20.518.580 -2.021.512 9.085.052 2.780.823 Δ 12,18% 1115,01% -122,25% 226,70% -177,65% Net Profit 18.099.909 14.051.602 -2.033.019 4.779.655 1.429.337 Δ 28,81% 791,17% -142,53% 234,40% -142,53% Sales
Through a detailed analysis of Luz Saúde business’s volume, it is possible to see a continuous growth over the reviewed period, reaching its highest relative growth compared to the previous period in 2012, with a value of 24.3%. Furthermore, it
18
should be noted that the turnover growth between 2010 and 2014 was approximately 60%. This growth reflects the overall improvement of the activity either in outpatient or inpatient.
EBITDA
As in turnover, the operating cash flows trend has been positive and increasing over the period, excluding the year 2012 when, despite the increase in turnover, EBITDA suffered a break cost, associated with the inauguration of Hospital Beatriz Ângelo. In the year 2014 there was also a slight fall of 1.27% in operating profitability. Furthermore, between 2010 and 2014, the EBITDA growth was approximately 44%.
Operational information
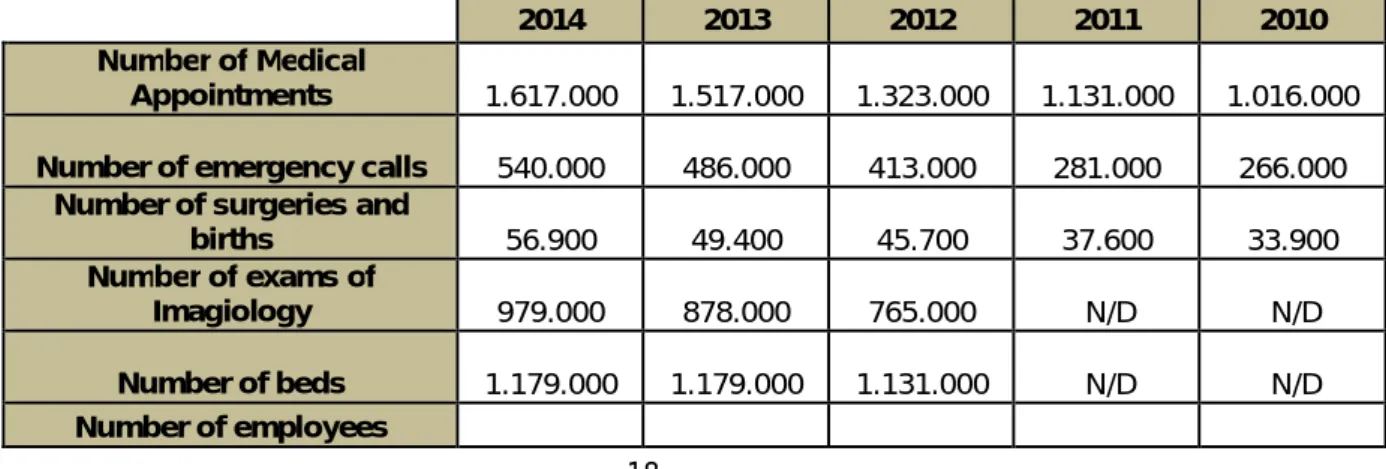
In operational terms, analyzing the data presented in Table 4, we see that there were positive developments in every area of intervention during the period under review; the number of visits increased by 59%, the number of emergency room visits increased 103%, the number of surgeries and deliveries increased by 68%, and the number of employees grew by 59%. Although there is no data regarding number of imaging exams and number of beds in 2010 and 2011, growth between 2012 and 2014 was 28% and 4%, respectively.
Tabla 3 - Operational Data
2014 2013 2012 2011 2010 Number of Medical Appointments 1.617.000 1.517.000 1.323.000 1.131.000 1.016.000 Number of emergency calls
540.000 486.000 413.000 281.000 266.000 Number of surgeries and
births 56.900 49.400 45.700 37.600 33.900 Number of exams of Imagiology 979.000 878.000 765.000 N/D N/D Number of beds 1.179.000 1.179.000 1.131.000 N/D N/D Number of employees
19
9.200 9.000 8.400 6.300 5.800
Structural Information
Investment in Capex has fluctuated over the reported period, in which 2010, 2012 and 2014 were the periods with higher investment, following hospital facility improvement undertaken during those years.
The Working Capital Fund has shown great volatility in 2010, 2012 and 2013 with negative results, meaning that the permanent capital is not covering long-term needs, and needs to finance fixed assets with short-term liabilities. In 2011 and 2014 this indicator was more balanced, ending the permanent capital to fund short-term operations. These oscillations are largely due to changes in long-term financial debt and equity oscillation.
The net debt has been reduced over that period, a decrease of 42% between 2010 and 2014 with no effect on cash and equivalents.
Another indicator that has improved over the reporting period is the financial net debt due to the EBITDA. In 2010 the company needed 7 years of operational activity to settle all financial debt, and in 2014 it would only take three years to settle the financial debt capital, a time reduction of 60%.
Tabla 4 - Structural Data
2014 2013 2012 2011 2010 CAPEX 28.300.000 12.500.000 27.117.325 6.819.642 24.425.517 Working Capital 8.508.915 - 31.495.327 - 52.173.747 83.768.122 - 33.323.546 NET DEBT 171.975.872 171.104.746 204.295.296 271.987.270 297.038.364 NET DEBT/EBITDA 3 3 5 6 7
20
3.3) Market Performance, Stakeholders structure
Luz Saúde, S.A. has been publicly listed on Euronext Lisbon since February 12, 2014, incorporating the general index of the country, PSI - GENERAL.
Analyzing plot 1, we can identify major fluctuations, reaching its maximum on 10 October 2014 with a value of € 4.98 per share. On the other hand, the minimum value was reached on 10 December 2014, with a value of 3.11€ per share. It was in this period - between October and December - that we saw increased volatility in share price. We can define two limits between which the share price was kept during 2014, positively never exceeding 5.00€ and a negative value of 3.00€. Despite the oscillations detected between February 12, 2014 and December 31, 2015, the overall share price increased during that period.
When comparing the share to the index, we find that the first performed better than the second, as the index devalued in the reference period, losing more than 700 points.
21
Plot 3 - Price PSI GERAL vs LUZ SAÚDE
Regarding daily variations, when we compare the index to the share alone, we note that the share has a higher daily volatility, with much pronounced fluctuations than those recorded for the index. The peak volatility for Luz Saúde, S.A. was registered, as abovementioned, between October and December 2014, while the index has remained relatively stable.
Plot 4 - Fluctuation PSI Geral vs Luz Saúde, S.A.
Through a public offer of aquisition, Fidelidade - Companhia de Seguros S.A. acquired 96.067% of the capital of Luz Saúde, at a price of 5.01€ per share, thus becoming the main shareholder of Luz Saúde on December 31, 2014. Fidelidade -
0 20 40 60 80 100 120 140 160 180
PSI Geral Luz Saúde
-0,15 -0,1 -0,05 0 0,05 0,1 0,15 0,2 0,25
22
Companhia de Seguros S.A. held 98.23% of the company’s equity capital, representative of 93,851,156 shares of a total of 95,542,254.
4)
National Economic Perspective and the Sector
After a time of great uncertainty and difficulties, during which several consecutive negative growth rates were recorded for the Portuguese economy, economic growth resumed in 2014. This year registered an increase of GDP of 0.9%, marking the emergence of a new cycle, based on estimates from the Bank of Portugal, with expected economic growths of 1.7% in 2015, 1.9% in 2016 and 2% in 2017.
With sustained growth in private consumption accompanied by an increase in disposable income, and an acceleration of gross fixed capital mainly in the business sector, it is expected that domestic demand presents a short-term moderate growth. A gradual and moderate unemployment reduction in coming years is also expected, as a result of good prospects for the national economy.
Finally, a stabilization of the consumer’s price harmonization index in annual terms is projected for 2015, with an increase of 1% in 2016 and 2017, according to the moderate growth of the Portuguese economy.
The Private Health market is expected to increase along with the estimates for the Portuguese economy, and in line with the growth recorded in this market in recent years.
Portugal has the world’s second lowest fertility rate and a representative elderly population, corresponding to ca. 10% of the total population. Hence, a pronounced growth of senior health offer is expected, especially in health insurance, health plans
23
and senior residences. The market for health insurance, very influent in the private health care market, has recently registered an increase of 3%, indicating that this growth will persist in the short term.
Another important factor in private healthcare is the State’s need to reduce public debt, which will cause an investment reduction in the health sector and, consequently, the regression of the services offered. This is one of the main aspects in which private healthcare has found a niche, presenting considerable interest in improving and diversifying their services and equipment in order to attract clients from the public sector.
Hence, it is expected that the private healthcare sector keeps growing during the next years - as occurred during the crisis -, especially due to the growth in insurance and health plans, and to the increased service offer and equipment quality.
4.1) Sector Analisys
ROI
The rentability of invested capital, as stated above, is reflected in the operating return rate of equity and financial debt capital’s sum. Analyzing the ROI chart (appendix), we can conclude that the market trend is growth, mainly due to the increase in EBIT, since capital growth has canceled the reduction of financial debt. Luz Saúde’s behavior has been steady over the reviewed period, with a positive slope.
ROE
Although the ROE plot does not allow us to identify volatility, the truth is that the entire market has seen a lot of instability in this indicator. Regarding Luz Saúde, this instability is due to the net profit variation associated with some changes in equity. As in the previous indicator, the growth trend is common throughout the sector.
24
ROS
For Luz Saúde, this metric has been unstable, varying according to the evolution of the operating results. Regarding the sector, the presented behavior is very similar to the one presented by the companies mentioned, ultimately following the same path in general terms.
Leverage
Liability has been a major concern for companies in the health sector. Analyzing the leverage of the chart, we see that every company in the sector has high liability values. However, Luz Saúde is in a more convenient level than the others. It is the intention of the analyzed companies to reduce their liability by reducing financial debt, either by increasing the equity and reducing financial debt.
Leverage Structure
The weight of current liabilities’ in total liabilities is pivotal for identifying the percentage of commitments that exist in short term, considering all obligations. Luz Saúde presents many variations due to changes in short-term financial debt. In general, the market has revealed some variations, registering a general trend towards reduction of short-term debt. Luz Saúde is in a better position than its competitors.
Debt Payment
In terms of estimating the time required for settling the debt, we can see a very positive evolution, both in Luz Saúde and throughout the sector. This is essentially due to the objective of reducing financial debt in the market.
25
5)
Strategic analysis
5.1) SWOT Analysis
5.2) 5 Forces of Porter Analysis
Strenghts
Weaknesses
Opportunities
Threats
Positive Negative In te rn a l Ex te rn a lInternal focus of business expansion Client satisfaction
Financial robustness of the structure Presence in masses locations Strong sence of social responsability Search for inovation
Ambitious and productive investments Good position in the health market Qualified human resources
High debt level
High operational costs
Long average time for receiving payments Operational volatility
Structure relying in costs
Financial debt concerntrated in comercial paper
Market in constant growth Internationalization
Developing strategic partnerships Expansion in the internal market Investment in new Technologies Investing in alternative medicines Creating new business oportunities Offer diversification
Strong competition Mature market Political instability
Brand affected by the BES effect Market stagnation
Rising of new brands
1,00 1,50 2,00 2,50 3,00 3,50 4,00 Possibility of entering competitors Rivalry among companies within the
sector
Threat from substitute products Buyers' negotiation power Supplier's negotiation power
AVERAGE
26
6)
Evaluation
6.1) Methodology
Luz Saúde will be evaluated according to the Absolute Value method, determining the company's value as a whole in absolute terms.
The absolute value will be determined by the FCFF method. Despite all the methods presented in this study, FCFF remains the most commonly used by investors and managers in business valuation. It is also the best method to apply in this case since the financial framework has an important weight in the economic structure of the company. We will calculate the three most relevant models of FCFF method: FTE model, APV and WACC. The FCFF will be designed for a time frame of three years- named explicit period- and a final period, considered perpetual. Afterwards, the adjusted FCFF will be discounted to the corresponding rates, taking into account each of the models in both the explicit period and perpetuity.
The evaluation will be based on the financial statements presented by Luz Saúde in the period 2010-2014.
Low
Average
High
27 6.2) Assumptions
To calculate the company's value in absolute terms, a set of assumptions were defined, such as the projection of FCFF and the refresh rate that will be presented immediately.
6.2.1) Turnover
The turnover was estimated and calculated for the next 3 years of explicit period and for the perpetual period, with a standard growth rate of 0.5% of the turnover for the previous period.
The Bank of Portugal estimates a GDP growth for 2015, 2016 and 2017 of 1.7%, 1.9% and 2% respectively. However, the political instability that currently exists in Portugal, and the fact that there appears to be a tendency for turnover stabilization based on the historical period 2010-2014, must be acknowledged.
6.2.2) EBITDA
EBITDA was calculated taking into account the historical evolution and the turnover. First, the EBITDA margin for each historical period from 2010 to 2014 was determined. Afterwards, the average indicator was calculated and applied to the turnover for the explicit and perpetual period.
6.2.3) Investment in non current assets and depreciations
Luz Saúde does not have a defined investment policy, but based on the historical period, we can see that there is a general pattern. Historically, Luz Saúde has a two investment cycle in two years, i.e. investment happens at t, and again only at t + 2.
To calculate the explicit and perpetual period we considered the average CAPEX of the historical period, and applied it to the turnover of each year.
28
= − +
+
The process of estimating depreciation and amortization was performed the same way used for investment, the average depreciation and amortization was calculated on the historical period, and applied to turnover in each of the explicit and perpetual periods.
6.2.4) Investment in working capital
To estimate the investment in working capital - an indicator that compiles various items of assets and short-term liabilities (inventories, accounts receivable, EOEP, other current assets, suppliers, bills to pay, other current liabilities) - we calculated the average of each rubrics for the explicit period, and later applied it to turnover in each of the estimated periods.
6.2.5) Risk-free Assets
The risk-free rate used for the assessment corresponds to the German treasury rate, thus fulfilling the no risk interest rate parameters mentioned in the literature review. According to Bloomberg, the risk-free interest rate with a maturity of 10 years, was rated 0.13% on 15 April, 2016.
6.2.6) Cost of Debt
To determine debt cost, three values are presented, corresponding to three forms of calculation:
Risk Model and Company Failure - 7.63%; Risk Model and Country Failure - 3.38%; Rate in the report and accounts - 3.12%.
Since Luz Saúde is not rated, the first formula, which considers the risk model and company default, is immediately excluded.
29
The second formula, taking into account the country risk would be the most appropriate if there were no information on the cost of debt capital. However, with the information provided in the report and the company's accounts, it was possible to obtain the rate demanded by creditors - which is the most accurate - and apply it during the study. Hence, the cost rate of debt capital used in the study was 3.12%. We can also conclude that Luz Saúde is doing a good job in terms of financial costs, since the profitability provided to creditors is inferior to every estimate obtained.
6.2.7) Beta
The beta used in this study was extracted from the Damodaran website, with the value of 0.95. Due the small number of observations in the stockmarket, we were unable to obtain a reliable Beta, which lead us to eventually choose the Damodaran site.
6.2.8) Market Risk Premium
According to a study by ERSE, the risk prize of the Portuguese market will be 6.25% between 2015 and 2017, which is the rate applied during the study.
6.2.9) Tax Rate
The tax rate used was the corporate tax rate used in 2015 (21%), corresponding to the nominal rate on taxable income in the 2014 period.
6.2.10) Equity weight and Financial Debt
The economic structure of Luz Saúde has been subjected to fluctuations over the analyzed period. We can see that there is a steady increase in equity, developed
30
between 2013 and 2014. Regarding financial debt, the company’s policy has been to reduce external dependence, which culminated in a 33% reduction from 2010 to 2014. This position reflects the company's interest in reducing the D/E ratio.
6.2.11) APV (Adjusted Present Value)
The APV model was used in this evaluation, in addition to the WACC and FTE models. However, taking into account the level of financial debt and its weight in Luz Saúde’s structure, it is important to assess the tax shield arisen from using this debt. For this reason, the APV model was considered the best model to evaluate Luz Saúde using the R rate, 5,13%.
6.2.1) Long-Term Growth Rate
The growth rate used in perpetuity was 0.5 %, considering this an acceptable value contrasting with the historic information of the Portuguese economy.
6.3) FCFF of Company
After applying all criteria mentioned in the preceding paragraphs and in the literature review, we obtained the following FCFF:
Explicit Period Perpetuity
2014 2015 2016 2017 2018
EBIT*(1-t) 24.145.216,46 19.608.574,98 19.706.617,85 19.805.150,94 19.904.176,70 Depreciation 27.529.869,45 36.317.950,84 36.499.540,59 36.682.038,30 0,00 Change Working Capital 28.602.009,58 2.900.666,92 5.316.838,58 5.318.422,77 5.320.014,88 Capex 28.300.000,00 27.179.582,65 27.315.480,56 27.452.057,96 0,00 FCFF -5.226.923,67 25.846.276,25 23.573.839,31 23.716.708,50 14.584.161,81
We estimated a value of 66.33 million for the explicit period, and 271.25 million for perpetuity.
31
7)
Evaluation Results
The evaluation of Luz Saúde was performed in absolute terms, taking into account the historical period 2010-2014, as well as other assumptions in terms of growth rates, yields and other market indicators. With all these indicators, it was possible to estimate the explicit period of three years and a perpetual period, which were used for the calculation of FCFF, being later discounted, thus obtaining its valorization. Because the company has a considerable financial debt, it was also important to calculate the effect of the Tax Shield and value this indicator. The Firm Value was calculated from the sum of the discounted FCFF, plus the tax effect, other current and non-current assets, deducting other current and non-current liabilities. Based on Firm Value, the company's equity was calculated, adding the value of financial debt existing in the 2014 period.
Value of Operations Explicit 66.328.633,04 € Value of Operations Perpetuity 271.244.949,25 €
Tax Savings 123.865.247,81 € Other Assets 352.984.837,78 € Other Liabilities 178.282.178,94 € Firm Value 2014 636.141.488,95 € Debt 2014 192.656.555,98 € Minority 2014 - € Equity Value 2014 443.484.932,97 € Shares 95.542.254,00 € Price Target 4,64 €
The intrinsic value of each of Luz Saúde’s share obtained in the evaluation was 4.64€. This represents a potential appreciation of 22% on the share price on 31/12/2014, and an increase of 56% over the most recent share price (03/24/2016). It is important to mention that the obtained value is not accurate because the assessment was based on
32
certain economic and sectorial assumptions that in the future may not be realized. Hence, a sensitivity analysis will estimate with a greater degree the range of values that this price may assume.
8)
Sensitivity analysis
The variables that are most relevant to analyze its impact on Luz Saúde are the perpetual growth rate and the risk-free interest rate.
g 4,64 Δ 0,20% 4,49 -3,28% 0,40% 4,59 -1,14% 0,60% 4,70 1,19% 0,80% 4,81 3,72% 1% 4,94 7% 1,20% 5,09 9,55% 1,40% 5,24 12,93% 1,60% 5,42 16,68% 1,80% 5,61 20,88%
In a ceteris paribus scenario, the g variable undergoes changes, strongly affecting the share value. For example, a simple change of 1% has an impact of 7% in share value.
4,64 Δ 2,60% 5,06 9,01% 2,80% 4,87 4,91% 3,00% 4,72 1,62% 3,20% 4,59 -1,06% 3,40% 4,49 -3,30% 3,60% 4,40 -5,19% 3,80% 4,33 -6,82% 4,00% 4,26 -8,22% 4,20% 4,20 -9,45%
Performing another ceteris paribus scenario, it appears that variations in the variable R will - as observed with the variable g - strongly affect share value, e.g., for a variation superior to 1%, the share value will vary over 9%.
33 g 4,64 0,20% 0,40% 0,60% 0,80% 1,00% 1,20% 1,40% 1,60% 1,80% 2,6% 4,91 5,01 5,12 5,23 5,36 5,51 5,66 5,84 6,03 2,8% 4,72 4,82 4,92 5,04 5,17 5,31 5,47 5,65 5,84 3,0% 4,56 4,66 4,77 4,89 5,02 5,16 5,32 5,49 5,69 3,2% 4,44 4,54 4,65 4,77 4,89 5,04 5,19 5,37 5,56 3,4% 4,34 4,44 4,54 4,66 4,79 4,93 5,09 5,26 5,46 3,6% 4,25 4,35 4,46 4,57 4,70 4,84 5,00 5,17 5,37 3,8% 4,17 4,27 4,38 4,50 4,63 4,77 4,92 5,10 5,29 4,0% 4,11 4,21 4,31 4,43 4,56 4,70 4,86 5,03 5,22 4,2% 4,05 4,15 4,26 4,37 4,50 4,64 4,80 4,97 5,17
Compiling the two previous assumptions, the growth rate (g) and the risk-free rate R , ceteris paribus, it is possible to see that the most positive oscillation within the presented scenarios will value the share price to 6.03€, while in worse scenarios the share price would lose value to 4.05€.
This analysis ends up giving more confidence to the presented values, and it is possible to see that the value of the share is undervalued.
9)
Conclusions
Luz Saúde has great potential for future growth. Over the past five years this company demonstrated resilience to the global financial crisis, and its adversity, managing to continually fulfill their objectives. Its operating performance is mainly explained by a turnover increase, a direct consequence of increasing the number of health facilities and investment in service quality. Continuing to follow this expansion and diversification strategy, and presenting a differentiated service/product that offers a good quality/price ratio to the customer, it is expected that this company will continue to grow. Destinations for international expansion are still unexplored, which might be part of the short term strategy, specifically for emerging markets and PALOPs, resulting in an opportunity to take into consideration.
34
Despite having numerous opportunities for growth, the group also has important challenges ahead. One is related to its EBITDA margin; the group must be able to regain their margins to the values presented in beginning of the financial crisis (16%), a task that will be challenging for two reasons: (i) health services have high operating costs because of the need for highly qualified human resources, implying larger salaries, and (ii) providing a differentiated service requires a higher demand and quality level. Another challenge for Luz Saúde is to reduce the weight of its debt, due to the company’s weight of high Net Debt. It is also important to note the average time of customer receivables and consequently the reduced liquidity that arises in order to avoid cash flow problems. Finally, the company’s last challenge will be to maintain the level of excellence in services within their institutions, and maintain sustainable growth.
From the results obtained in the company’s evaluation and in the sensitivity analysis, one can conclude that the price of Luz Saúde’s shares on 31/12/2014 is undervalued; even considering the worst case scenario, the share price is still lower than its real value. The results of the sensitivity analysis also allows us to state with a higher degree of certainty that the intrinsic value of the company's shares on 31/12/2014 would be between 4.05€ and 6.03€. So, buying recommendation of Luz Saúde’s shares would be given to future investors on that date, because the market would eventually recognize their true value, and consequently, the rise of share price would provide investors returns higher than 7%, within a time period of 12 months.
We also performed the FCFE and WACC models, retrieving values of 4.70€ and 3.83€ respectively. The FCFE model was not considered for the evaluation due to its implicit
35
valuation of the company from the viewpoint of equity investor, excluding the investor's debt capital. The WACC model would be one of the models to consider because, as the APV model, it considers the evaluation of the company from the equity and debt capital perspective. However, one cannot assess the benefits of financial debt separately. This model retrieved a value closer to the market value, at the time of evaluation.
Regarding future research, it would be interesting to evaluate the impact of the construction of Hospital Beatriz Ângelo on Luz Saúde’s accounts, as well as the effect of recent changes in the ADSE model and Public Private Partnerships in the private healthcare market
36
Bibliography
Academic works – articles and books:
Cooper, I., Davydenko, S. (2001), “The cost of debt”, Unpublished paper,
London Business School;
Cooper, I., Nyborg, K. (2006), “Consistent methods of valuing companies by
DCF: Methods and assumptions”, Unpublished Paper, London Business School;
Copeland, E., Keenan, T. (1998), “How much is flexibility worth?”, The McKinsey
Quarterly 1998, No.2;
Copeland, Tom; Koller, Timothy; Murin, Jack – Valuation, Measuring and
Managing the Value of Companies. 2ª ed. New York: John Wiley & Sons, 1994
Damodaran, A (1999), “Estimating Risk Parameters”, Stern School of Business;
Damodaran, A. (2002), Investment Valuation: Tools and Techinques for
determining the value of Any Asset, 2ªEdição, Wiley (New York);
Damodaran, A. (2002), “Estimating Risk free Rates”, Stern School of Business;
Damodaran, A. (2006), “Valuation Approaches and Metrics: A Survey of the
Theory and Evidence”, Stern School of Business;
Damodaran, A. (2015), “DISCOUNTED CASHFLOW MODELS: WHAT THEY ARE
AND HOW TO CHOOSE THE RIGHT ONE.”, Stern School of Business;
Elton, E., Gruber, M., Brown, S., Goetzmann, W. (2010), Modern portfolio
theory and Investment analysis 8th edition, Paperback;
Fernández, P. (2003), “Levered and Unlevered Beta”, IESE Research Papers
D/488, IESE Business School;
Ferreira, Domingos – Fusões, Aquisições e Reestruturações de Empresas.
Lisboa: Edições Sílabo, 2002.
Fernández, P. (2007), “Company valuation methods. The most common errors
in valuations”, Research Papers D/449, IESE Business School;
Fernández, P. (2015), “Company valuation methods., Research Papers, IESE
37
Goedhart, M., Koller, T., Wessels, D., McKinsey and Company (2005a),
Valuation: Measuring and Managing the Value of Companies, 3ªEdição, Wiley (New York);
Hoffman, S. (2001), The law and business of international project finance, 2ª Edition, Transnational Publishers, Inc.;
Kaplan, S., Ruback, R. (1995), “The Valuation of Cash Flow Forecasts: An
Empirical Analysis”, Journal of Finance, Vol. 50, No. 4;
Lie, E., Lie, H. (2002); “Multiples used to estimated Corporate Value”, Financial
Analysts Journal, Vol. 58, No. 2, pp. 4-22;
Luehrman, T. (1997a), “What’s It Worth? – A General Manager’s Guide to
Valuation”, Harvard Business Review, May-June;
Luehrman, T. (1997b), “Using APV: A Better Tool for Valuing Operations”,
Harvard Business Review, May-June;
Neves, J., Pimentel, P. (2004), The equity risk premium in Portugal in the 1990’s
and the Merton approach, European Review of Economics and Finance;
Reports and Magazines:
Banco de Portugal, Projeções para a economia portuguesa: 2015‐2017;
ERSE, Parâmetros de regulação para o período de 2015 a 2017
Luz Saúde, S.A Relatório e Contas (2010 a 2014);
Grupo Mello, Relatório e Contas (2010 a 2014);
INE, Conta Satélite da Saúde, 2012 – 2014Pe
Lusiadas Saúde, Relatório e Contas (2010 a 2014);
Grupo Trofa, Relatório e Contas (2010 a 2014)
Ministério da Saúde, Relatório e Contas: 2014;
Main web sources:
38
CMVM – http://www.cmvm.pt/cmvm/Pages/default.aspx;
Damodaran, Aswath – http://pages.stern.nyu.edu/~adamodar;
Financial Times – http://www.ft.com/intl/markets;
Google finance - https://www.google.com/finance
Grupo Mello - http://www.josedemellosaude.pt/
INE – http://www.ine.pt;
Informa D&B - //www.informadb.pt/idbweb/
Investing - http://pt.investing.com/
Lusiadas Saúde - https://www.lusiadas.pt/pt/
Luz Saúde - http://www.luzsaude.pt/pt/
Reuters – http://www.reuters.com;
Trofa Saúde - http://www.trofasaude.pt/
39
Annex
Annex 1 – Alternative evaluation methods
Liquidation and Accounting Valuation
The Liquidation and Accounting Valuation method is based on the evaluation of assets existing in the company using value or book value accounting estimates as a starting point, Damodaran (2006).
This evaluation method is based on three models: Book Value, Fair Value and Liquidation Valuation.
The book value consists in the evaluation of assets based on their book value. Daniels (1934) states that usually the financial statements represent the actual value of the company, serving as meeting point between the buyer and the seller. The evaluation based on this model has to follow certain rules: (i) for a fixed asset value one should consider the acquisition value with subsequent depreciation; (ii) in the case of a current active, the value is based on market value. Finally, there are other assets that can not be measured so easily. In conclusion, for companies with more weight in fixed assets and with few opportunities for growth, this evaluation model may be useful; for other types of companies this will not be the best model, Damodaran (2006).
The fair value has been a hotly debated topic in recent years by accounting and regulators. Some believe it may bring useful information to the market, while others believe it can lead to manipulation of financial statements. This is not a very appreciated model in the finance world, as it is believed that only can provide a delay in market effect, Damoran (2006).
The Liquidation Valuation presupposes the fact that the assets have to be sold immediately, the value obtained can be calculated in the same way that evaluations based on discounted cash flows, but with the liquidation effect which can download price of the asset. This is a method that can be used in economic difficulty with companies but in healthy companies would not be possible to translate their true market value, Damodaran (2006).
40
In recent years, the fair value has been an intensely debated topic among accounting and regulators. Some believe it may bring useful information to the market, while others believe it can lead to manipulation of financial statements. This is a model that is not much appreciated in the world of finance it is believed that only can provide a delay in market effect, Damoran (2006).
The Liquidation Valuation presupposes the fact that assets have to be sold immediately. The value obtained can be calculated in the same way that evaluations based on discounted cash flows, but considering the liquidation effect - which can download price of the asset. This method may be used in companies enduring financial difficulties, but for healthy companies it would not be able to describe their true market value, Damodaran (2006).
Relative Valuation
This model is based on the demand of the market value of other comparable companies within the sector, following three essential steps:
Find comparable assets based on market values; Scale market values to a common variable; Adjust differences over assets.
The Relative Valuation can converge to the same value of the discounted cash flows, but in order for that to happen, the market value of the assets must be correct. It is important to note that many equity researchers in M&A combine the method of discounted cash flows with the relative valuation method, Damodaran (2002 and 2006). There is a wide variety of multiples for assets evaluation, which can differentiate into three types: (i) multiple based on market capitalization that are
41
based on the price; (ii) multiple based on the company's value based on the company's value and (iii) multiple related growth, Fernandez (2002).
Contingent Claim Valuation
The Contingent Claim Valuation model uses option price calculation models to evaluate assets: the binomial model and Black Scholes, Damodaran (2006). This model evaluates not only the company itself, but also the opportunities that may arise during the operation, variations that can happen, but that in a DCF model are not easily valued. It is considered a more complete model than DCF because contemplates exogenous variables such as asset price changes, expansions and technological developments, among others, Damodaran (2002) and Copeland and Keenan (1998). However due to the multitude of variables that this model needs, it becomes very difficult to use and apply practically Luehrman (1997).