R E S E A R C H
Open Access
Epigenome-wide DNA methylation profiling
of periprostatic adipose tissue in prostate
cancer patients with excess adiposity
—a
pilot study
Yan Cheng
1,2, Cátia Monteiro
3,4, Andreia Matos
5,6, Jiaying You
1, Avelino Fraga
6,7, Carina Pereira
3,8,
Victoria Catalán
9,10, Amaia Rodríguez
9,10, Javier Gómez-Ambrosi
9,10, Gema Frühbeck
9,10,11,
Ricardo Ribeiro
3,5,6,12,13*†and Pingzhao Hu
1*†Abstract
Background: Periprostatic adipose tissue (PPAT) has been recognized to associate with prostate cancer (PCa) aggressiveness and progression. Here, we sought to investigate whether excess adiposity modulates the methylome of PPAT in PCa patients. DNA methylation profiling was performed in PPAT from obese/overweight (OB/OW, BMI > 25 kg m−2) and normal weight (NW, BMI < 25 kg m−2) PCa patients. Significant differences in methylated CpGs between OB/OW and NW groups were inferred by statistical modeling.
Results: Five thousand five hundred twenty-six differentially methylated CpGs were identified between OB/OW and NW PCa patients with 90.2% hypermethylated. Four hundred eighty-three of these CpGs were found to be located at both promoters and CpG islands, whereas the representing 412 genes were found to be involved in pluripotency of stem cells, fatty acid metabolism, and many other biological processes; 14 of these genes, particularlyFADS1, MOGAT1, andPCYT2, with promoter hypermethylation presented with significantly decreased gene expression in matched samples. Additionally, 38 genes were correlated with antigen processing and presentation of endogenous antigen via MHC class I, which might result in fatty acid accumulation in PPAT and tumor immune evasion.
Conclusions: Results showed that the whole epigenome methylation profiles of PPAT were significantly different in OB/OW compared to normal weight PCa patients. The epigenetic variation associated with excess adiposity likely resulted in altered lipid metabolism and immune dysregulation, contributing towards unfavorable PCa
microenvironment, thus warranting further validation studies in larger samples.
Keywords: DNA methylation, Periprostatic adipose tissue, Obesity, Prostate cancer, Microenvironment Background
Prostate cancer (PCa) is one of the most frequent malig-nancies in men and the second leading cause of cancer-related death in the North America and most western European countries [1,2]. Epidemiological studies support
obesity or excess adiposity as an important environmental risk factor for PCa, being primarily associated with advanced disease and death [3]. Periprostatic adipose tissue (PPAT), a white fat depot surrounding the prostate capsular-like structure, has been recognized to have the potential to exert pro-tumoral endocrine and paracrine influences on prostate cancer cell’s biological phenotypes [4]. There is now evidence that obesity and overweight result in excess fat deposit at PPAT [5], altered fatty acid profile [6], migration of tumor cells [7], secretion of a variety of adipokines, such as interleukin-1 beta (IL-1b), osteopontin, leptin, tumor necrosis factor alpha (TNF-a),
* Correspondence:[email protected];[email protected]
†Equal contributors
3Molecular Oncology Group, Portuguese Institute of Oncology, Porto,
Portugal
1Department of Biochemistry and Medical Genetics & Department of
Electrical and Computer Engineering, University of Manitoba, Winnipeg, Canada
Full list of author information is available at the end of the article
© The Author(s). 2018 Open Access This article is distributed under the terms of the Creative Commons Attribution 4.0 International License (http://creativecommons.org/licenses/by/4.0/), which permits unrestricted use, distribution, and reproduction in any medium, provided you give appropriate credit to the original author(s) and the source, provide a link to the Creative Commons license, and indicate if changes were made. The Creative Commons Public Domain Dedication waiver (http://creativecommons.org/publicdomain/zero/1.0/) applies to the data made available in this article, unless otherwise stated.
and decreased adiponectin, thus contributing to a tumor microenvironment that ultimately facilitates PCa aggres-siveness [7,8].
DNA methylation is a well-known epigenetic mechan-ism resulting from the interaction between environmen-tal factors and the genome [9]. DNA methylation with variation of CpG sites is associated with tissue-specific gene modulation and involved in phenotype transmis-sion and in the development of diseases [10]. Excess adiposity, as a consequence of environmental factors such as excessive food consumption or inactive lifestyle, has been identified as a regulator of epigenetic modifica-tion in adipose tissue. Recent findings from experimental studies suggested that modification of DNA methylation pattern in adipose tissue and adipocytes was related with development of cancer, type 2 diabetes, and cardiovascu-lar diseases through influencing metabolism and inflam-mation [11–13]. Additionally, several studies reported altered DNA methylation in PCa cells as compared with adjacent benign tissue, and some significantly methyl-ated CpG sites and genes were found to be responsible for the occurrence and progression of PCa [14–16]. Nevertheless, the epigenome-wide DNA methylation profile of PPAT from excess adiposity PCa patients is currently unknown despite its potential mechanistic involvement in obesity association with PCa.
The aim of this study was to perform a epigenetic-wide association study (EWAS) in order to evaluate DNA methylation profile of PPAT obtained from obese/ overweight (OB/OW) in comparison with normal weight (NW) PCa patients and identify differentially methylated sites. We also explored the consequential potential bio-logical functions that account for the effect of PPAT from OB/OW subjects in PCa molecular mechanisms.
Methods
Study samples
This study included ten prostate cancer patients from the Portuguese Institute of Oncology, Porto Centre. In-clusion criteria and conditions of this study have been previously reported, including the procedures for PPAT collection, handling, and storage [4]. Briefly, PPAT was collected and immediately processed in the operating room and transported to the laboratory within 2 h in appropriate culture media and temperature conditions, in order to minimize pre-analytical errors. Patients’ signed informed consent and research procedures were approved by the institute’s ethics committee.
The clinical and pathological characteristics of partici-pants are presented in Table 1. The ten subjects were selected from a larger group of patients undergoing prostate surgery (n = 51) [4, 17] that fitted the strict inclusion and exclusion criteria, in order to control for variables that might influence adipose tissue gene
expression or methylation (e.g., diabetic or anti-dyslipidemia drugs, stage of disease and PSA, concomitant diseases such as diabetes, other neoplasia or metabolic syndrome). Subjects were matched for age at diagnosis, PSA value, Gleason grade, and stage of disease, which differed in body mass index (BMI). BMI was calculated by dividing weight in kilograms by the squared height in meters and categorized using the WHO (World Health Organization) criteria: normal weight, BMI < 25 kg m−2, overweight, 25≤ BMI < 30 kg m−2, and obese, BMI≥ 30 kg m−2. Obese and overweight were combined into one excess adiposity group (n = 5, BMI≥25 kg m−2) versus normal weight group (n = 5, BMI < 25 kg m−2). Therefore, the two groups were selected to differ only by BMI, in order to reflect our objective of assessing whether excess adiposity (BMI) influences PPAT methylation profile.
Epigenome-wide DNA methylation analysis
DNA was isolated from PPAT using Puregene hisalt extraction method (Qiagen/Gentra). Briefly, the tissue was minced with scalpels in a sterile petri dish on ice and then transferred to Puregene Cell Kit for overnight Proteinase K digest at 55 °C. A second Proteinase K digest was done the next morning for 5 h. DNA from the digested tissue was purified using Puregene extrac-tion protocol (Qiagen/Gentra). Purified DNA was washed 2× with 70% ethanol and DNA pellet air dried and rehydrated in TE (10 mM Tris-Cl, 1 mM EDTA pH 7.5). Epigenome-wide DNA methylation was
ana-lyzed using the Infinium Human Methylation450
(HM450) BeadChip (Illumina, San Diego, CA, USA) in the Center for Applied Genomics (Toronto). This array
Table 1 Clinicopathological characteristics of PCa patients by BMI category
Character NW (n = 5) OB/OW (n = 5) P value Age (years) 65.2 ± 3.8 63.2 ± 2.5 0.67a BMI (kg/m2) 23.0 ± 0.3 29.0 ± 0.9 0.0003a Gleason score < 7 2 (40%) 1 (20%) ≥ 7 3 (60%) 4 (80%) 1.00b Stage OCPCa 2 (40%) 2 (40%) EPCa 3 (60%) 3 (60%) 1.00b Smoking status Yes 1 5 No 4 0 0.05b PSA (ng/ml) 10.7 ± 2.7 12.1 ± 3.23 0.74a
Data are presented as mean ± SD or number (%). Significant difference between OB/OW and NW was evaluated usingat test andbFisher’s exact test OB/OW obese/overweight, NW normal weight, BMI body mass index; PSA, prostate specific antigen; PCa, prostate cancer; OCPCa, organ-confined prostate cancer; EPCa, extra-prostatic PCa
contains 485,577 probes, which cover 21,231 (99%) RefSeq genes. Briefly, DNA was bisulfite-converted using the EZ DNA methylation kit (Zymo Research, Orange, CA, USA) and then used on the Infinium Assay® followed by the Infinium HD Assay Methylation Protocol (Illumina). The imaging data on the BeadChips was captured by Illumina iScan system.
Data filtering and normalization
Raw methylation level for each probe was represented by methylation β value, which was calculated based on β = intensity of the methylated allele/(intensity of the unmethylated allele + intensity of the methylated allele + 100). M values were the logit transformation of β values based on M = log2(β/(1 − β)), which makes the data more homoscedastic and appropriate for further bioinformatic and statistical analysis.
Methylation values were normalized using the func-tional normalization algorithm implemented in Minfi R package [18]. Quality control was performed by exclud-ing CpG probes, which are found by Chen et al. to be cross-reactive with areas of the genome not at the site of interest [19], as well as control probes and probes on sex chromosomes. We analyzed a total of 438,458 CpG sites from the PPAT of 5 OB/OW PCa patients and 5 NW PCa patients.
Differential methylation analysis
A statistical linear modeling approach was applied to the detected differentially methylated CpG sites (DMCs) asso-ciated with obesity in PPAT using the Bioconductor “limma” package [20]. Hyper- or hypomethylation was determined when methylation levels of CpGs increased or decreased between the OB/OW PCa group and the NW PCa group based on mean different β > 0 or < 0. False discovery rate (FDR)-correctedP values were determined according to the method of Benjamin and Hochberg’s (BH method) multiple testing procedure [21].
Differentially methylated regions (DMRs) were identified
using the “Bumphunter” method implemented in the
“chAMP” R package with the parameters (B = 1000, useWeights = TRUE, minProbes = 10, pickCutoff = TRUE, and other settings with default values) [22].
The proportions of significant hyper- or hypomethy-lated CpGs were calcuhypomethy-lated and visualized according to their relation to the nearest genes or to the CpG islands, separately. Gene promoter region was defined as 1500 base pairs (bp) and 200 bp upstream of the transcription start site (TSS) (TSS1500 and TSS200) [23]. Identified genes were selected when more than two significantly hypermethylated CpGs were simultaneously located in the promoter region.
Functions, pathway, and network enrichment analysis
Gene ontology (GO) and KEGG pathway enrichment ana-lyses were performed to explore the biological functions of significantly methylated genes using the online bioinfor-matic tool Enrichr [24]. Protein-protein interaction (PPI) analysis of all DMC-related genes was performed using NetworkAnalyst according to STRING database [25].
Association analysis between DNA methylation and gene expression
We have previously performed gene expression experi-ment of the PPAT of the 5 OB/OW PCa patients and the 5 NW PCa patients using the HG-U133 Plus 2.0 Affymetrix GeneChip Array (Affymetrix, Santa Clara, CA, USA) [4]. Differential gene expression (DGE) ana-lysis between the OB/OW PCa patients and the NW PCa patients was re-performed using the Bioconductor “limma” package as previously described [4]. Spearman’s rank correlation analysis was performed between the methylation profiles of the hypermethylated CpGs and the gene expression profiles of the genes in PPAT.
Results
Clinical characteristics
Clinical characteristics of PCa patients in this study were stratified according to obesity classification groups and are presented in Table 1. Mean age, PSA level, Gleason sum score, and cancer stage in subjects with PCa were similar (P value > 0.05) between OB/OW and NW groups. As expected, the mean BMI of the OB/OW group was significantly higher than that of the NW sub-jects (P value < 0.01). All the patients in the OB/OW group are ex-smokers or active smokers, while only one patient in the NW group is a smoker (P value = 0.05).
Epigenome-wide DNA methylation profiling of PPAT
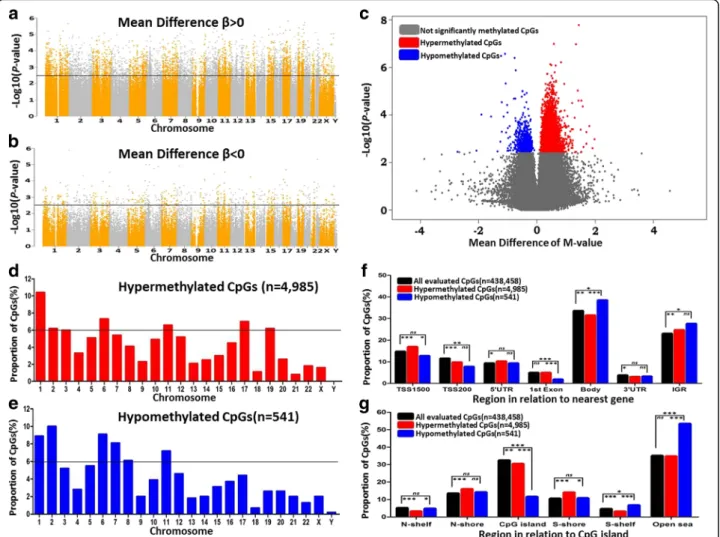
To study the impact of obesity status on DNA methyla-tion profiles and to identify differentially methylated CpG sites in PPAT from OB/OW and NW prostate cancer patients, we conducted epigenome-wide DNA methyla-tion analyses. A flowchart of the data analysis is depicted in Additional file 1: Figure S1. After quality control and filtering, the Infinium array generated methylation data for 438,458 CpG sites, from which 5526 were differentially methylated after FDR control in the PPAT of OB/OW PCa patients compared to NW (adjusted P value < 0.25; Additional file2: Table S1 and Table2). The unsupervised hierarchical clustering of DMCs showed differential DNA methylation patterns in PPAT between OB/OW and NW samples (Additional file 3: Figure S2). The majority of DMCs were hypermethylated (n = 4985, 90.2%), with 9.8% hypomethylated CpG sites (n = 541) in OB/OW versus NW prostate cancer patients (Fig.1a, b, c).
Chromosomal distribution of the DMCs
To further explore the methylation profile, we investi-gated the chromosome distribution of DMCs. Results showed that hypermethylated CpG sites were located at chromosomes 1, 6, 11, and 17 (proportion > 6%, Fig.1d) and hypomethylated CpG sites were located at chromo-somes 1, 2, 6, 7, and 11 (proportion > 6%, Fig.1e).
Methylation variations of hypermethylated DMCs and hypomethylated DMCs were found mainly distributed on chromosomes 1, 6, and 11, suggesting that the DNA
methylation alterations in these chromosomes were correlated with the body weight changes in prostate patients. Furthermore, we compared the distribution of the DMCs (hyper- and hypomethylated, separately) with the distribution of all evaluated CpG sites based on their relation to nearest gene regions (Fig.2f, Additional file4: Table S2) or their relation to CpG islands (Fig. 2g, Additional file 5: Table S3) using χ2
test. The results showed that hypermethylated CpGs are mainly located at TSS1500 (transcription start sites 1500), IGR (intergenic
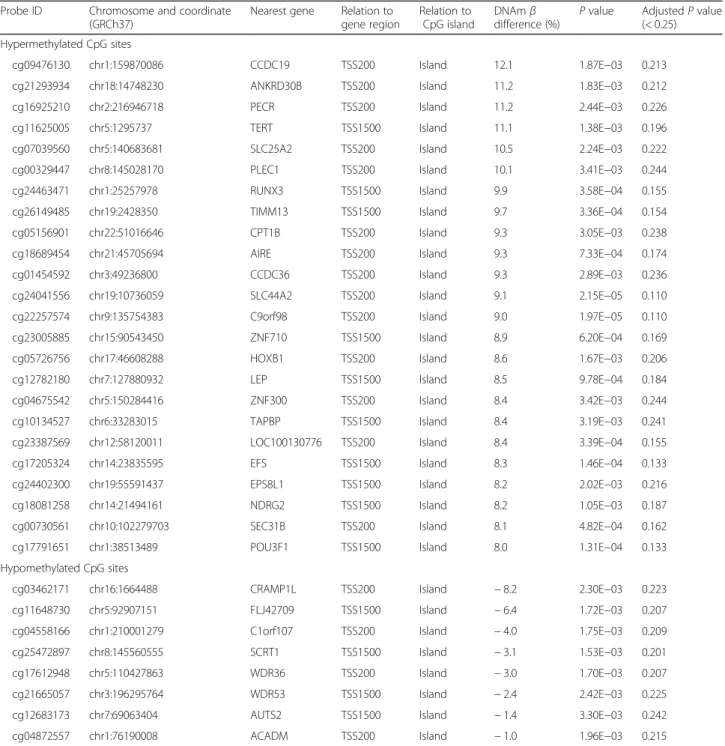
Table 2 Differentially methylated CpG sites in PPAT between obese/overweight PCa patients and normal weight controls
Probe ID Chromosome and coordinate (GRCh37)
Nearest gene Relation to gene region Relation to CpG island DNAmβ difference (%) P value AdjustedP value (< 0.25) Hypermethylated CpG sites cg09476130 chr1:159870086 CCDC19 TSS200 Island 12.1 1.87E−03 0.213 cg21293934 chr18:14748230 ANKRD30B TSS200 Island 11.2 1.83E−03 0.212 cg16925210 chr2:216946718 PECR TSS200 Island 11.2 2.44E−03 0.226 cg11625005 chr5:1295737 TERT TSS1500 Island 11.1 1.38E−03 0.196 cg07039560 chr5:140683681 SLC25A2 TSS200 Island 10.5 2.24E−03 0.222 cg00329447 chr8:145028170 PLEC1 TSS200 Island 10.1 3.41E−03 0.244 cg24463471 chr1:25257978 RUNX3 TSS1500 Island 9.9 3.58E−04 0.155 cg26149485 chr19:2428350 TIMM13 TSS1500 Island 9.7 3.36E−04 0.154 cg05156901 chr22:51016646 CPT1B TSS200 Island 9.3 3.05E−03 0.238 cg18689454 chr21:45705694 AIRE TSS200 Island 9.3 7.33E−04 0.174 cg01454592 chr3:49236800 CCDC36 TSS200 Island 9.3 2.89E−03 0.236 cg24041556 chr19:10736059 SLC44A2 TSS200 Island 9.1 2.15E−05 0.110 cg22257574 chr9:135754383 C9orf98 TSS200 Island 9.0 1.97E−05 0.110 cg23005885 chr15:90543450 ZNF710 TSS1500 Island 8.9 6.20E−04 0.169 cg05726756 chr17:46608288 HOXB1 TSS200 Island 8.6 1.67E−03 0.206 cg12782180 chr7:127880932 LEP TSS1500 Island 8.5 9.78E−04 0.184 cg04675542 chr5:150284416 ZNF300 TSS200 Island 8.4 3.42E−03 0.244 cg10134527 chr6:33283015 TAPBP TSS1500 Island 8.4 3.19E−03 0.241 cg23387569 chr12:58120011 LOC100130776 TSS200 Island 8.4 3.39E−04 0.155 cg17205324 chr14:23835595 EFS TSS1500 Island 8.3 1.46E−04 0.133 cg24402300 chr19:55591437 EPS8L1 TSS1500 Island 8.2 2.02E−03 0.216 cg18081258 chr14:21494161 NDRG2 TSS1500 Island 8.2 1.05E−03 0.187 cg00730561 chr10:102279703 SEC31B TSS200 Island 8.1 4.82E−04 0.162 cg17791651 chr1:38513489 POU3F1 TSS1500 Island 8.0 1.31E−04 0.133 Hypomethylated CpG sites
cg03462171 chr16:1664488 CRAMP1L TSS200 Island − 8.2 2.30E−03 0.223 cg11648730 chr5:92907151 FLJ42709 TSS1500 Island − 6.4 1.72E−03 0.207 cg04558166 chr1:210001279 C1orf107 TSS200 Island − 4.0 1.75E−03 0.209 cg25472897 chr8:145560555 SCRT1 TSS1500 Island − 3.1 1.53E−03 0.201 cg17612948 chr5:110427863 WDR36 TSS200 Island − 3.0 1.70E−03 0.207 cg21665057 chr3:196295764 WDR53 TSS1500 Island − 2.4 2.42E−03 0.225 cg12683173 chr7:69063404 AUTS2 TSS1500 Island − 1.4 3.30E−03 0.242 cg04872557 chr1:76190008 ACADM TSS200 Island − 1.0 1.96E−03 0.215
region), N-shore, and S-shore, and hypomethylated CpGs are mostly located at the gene body and open sea.
Functional enrichment analysis of significantly obesity-associated DMCs
To investigate the potential biological relevance of the sig-nificant DMCs, we further filtered 483 DMCs (distributed within 413 genes) from a total of 5526 DMCs according to their locations at both the gene promoter and CpG
island (Additional file6: Table S4). Four hundred seventy-five of the 483 DMCs (representing 404 genes) were hypermethylated. Functional enrichment analysis of the hypermethylated genes showed that these genes were enriched for biological processes, such as pattern specification process, neuron differentiation, neuron fate specification, and negative regulation of phosphate metabolic process (adjustedP value < 0.05, Additional file7: Table S5), as well as molecular functions, such as
Fig. 1 Epigenetic profiles of differentially methylated CpGs of PPAT between OB/OW and NW groups. Manhattan plots show epigenetic profiles of all increased methylated CpGs (a) and all decreased methylated CpGs (b). TheX-axis shows chromosomes, and the Y-axis is a −log10 (P value). The black line represents the threshold of adjustedP value = 0.25. CpGs above the black line are significantly hyper- or hypomethylated. The volcano plot of DNA methylation (c) shows a significant difference in PPAT between the OB/OW and NW groups. Four thousand nine hundred eighty-five hypermethylated CpGs are labeled in red, and 541 hypomethylated CpGs are labeled in green (adjustedP value > 0.25). The proportions of hyper- and hypomethylated CpGs on each chromosome are shown in (d) and (e). The black line indicates if the proportions of hyper- and hypomethylated CpGs on a chromosome are higher than 6%. The distribution of significant DMCs (hyper- or hypomethylated CpGs) and globe DNA methylation CpGs in locations related to the nearest gene regions and CpG islands are shown in f and g. Hypermethylated CpGs are mainly located at TSS1500 (transcription start sites 1500), IGR (intergenic region), N-shore (the 2 kb regions upstream of the CpG island boundaries), and S-shore (the 2 kb regions downstream of the CpG island boundaries), and hypomethylated CpGs are mostly located at the gene body and open sea. The difference of the proportion of CpGs among the three CpG groups was calculated based on theχ2test (*P < 0.05, **P < 0.01, ***P < 0.001, ns not significant). CpG islands were defined as DNA sequences (500 base windows; excluding most repetitive Alu-elements) with a GC base composition greater than 50% and a CpG observed/expected ratio of more than 0.6. The 2 kb regions immediately upstream (N_Shore) and downstream (S_Shore) of the CpG island boundaries were defined as“CpG island shores,” and the 2 kb regions upstream (N_Shelf) and downstream (S_Shelf) of the CpG island shores were referred as“CpG island shelves.” Open seas were the regions more than 4 kb from CpG islands
neuropeptide receptor activity and sequence-specific DNA-binding RNA polymerase II transcription factor ac-tivity (adjustedP value < 0.1, Additional file 8: Table S6). KEGG pathway enrichment analysis showed that hyper-methylated genes were involved in signaling pathways regulating pluripotency of stem cells, fatty acid metabol-ism, basal cell carcinoma, non-alcoholic fatty liver disease (NAFLD), and AMPK signaling pathway (P value < 0.05, Additional file9: Table S7).
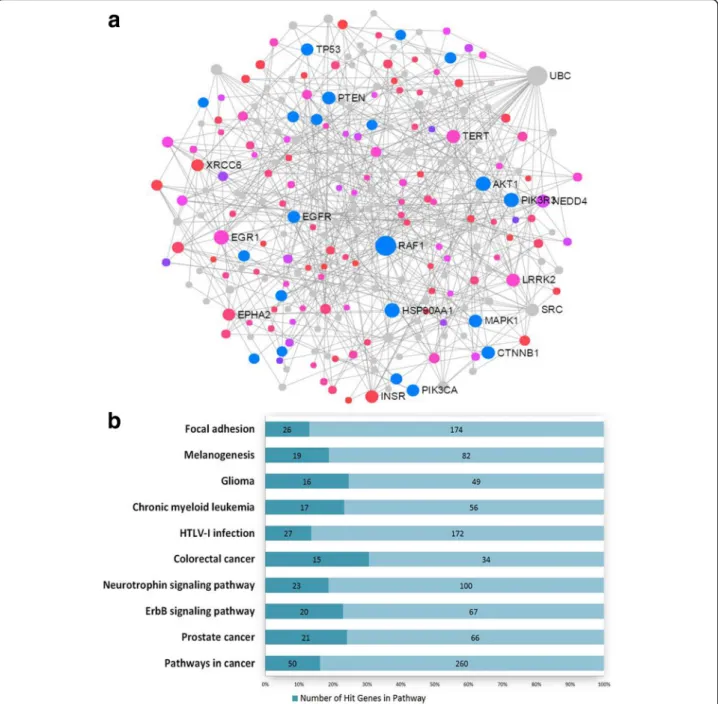
We mapped the 404 hypermethylated genes to the STRING database and generated a protein-protein inter-action (PPI) network by the NetworkAnalyst. The largest subnetwork was identified to include 247 nodes (genes) and 403 edges (Fig. 2a). In the network, the size of the nodes was based on their degree values and the color of nodes was based on their P values. This network con-tained 118 seed genes from the DMCs, and the enrich-ment pathway analysis showed that the genes of the
Fig. 2 Protein-protein interaction analysis. a A subnetwork composing of 247 nodes and 403 edges was generated using methylated genes. Blue dots represent the genes involved in prostate cancer; red and pink dots represent the seeds (methylated genes) according to the differentP values; the gray dots represent the proteins which were closely interacted with the seeds, and the circle size represents the node degree. b The pathway enrichment analysis shows the subnetwork is mainly enriched in cancer pathways (P < 0.0001)
subnetwork were mostly involved in the pathways of pros-tate cancer and other cancers (Fig.2b, Additional file10: Table S8, adjusted P value < 0.05). Particularly, the gene UBC (ubiquitin C) was found to be a hub connecting with many other nodes in the network, suggesting that the gene may play important biological roles in the PPAT of obese PCa patients.
Selected genes with multiple methylated CpG sites
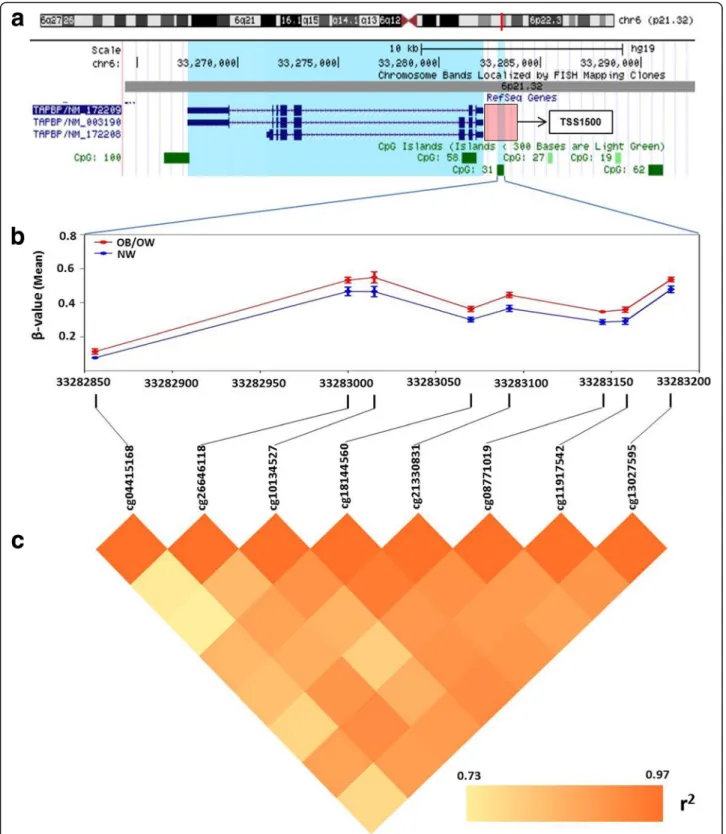
In order to explore repression of genes by DNA methy-lation modifications, we selected genes which had mul-tiple hypermethylated CpG sites (the number of methylated CpG sites≥ 2, in at least one of the sites with a mean difference ofβ > 3% and an adjusted P value < 0.25) (Additional file1: Figure S1 and Additional file11: Table S9). A total of 38 genes with 100 differentially methylated CpG sites were selected, which includedTAPBP, RUNX3, CPT1B, CPT1C, MOGAT3, WNT2, and AIRE (Additional file 11: Table S9). Notably, the promoter region of TAPBP (TAP-binding protein) had eight hypermethylated CpG sites in the promoter (Fig.3a), which were significantly more methylated in the OB/OW than those in the NW groups (Fig.3b), with
a mean difference of β value greater than 5%
(Additional file 10: Table S8). Spearman’s rank correlation showed strong association (r2= 0.73–0.97) of the eight hypermethylated CpGs in theTAPBP promoter with their methylation levels (Fig.3c). Pathway analysis of these genes revealed enrichment for fatty acid metabolism, PPAR signaling pathway, glucagon signaling pathway, AMPK signaling pathway, glycerolipid metabolism, basal cell carcinoma, antigen processing and presentation, ECM receptor interaction, and insulin resistance (adjusted P value < 0.25) (Additional file 12: Table S10).
Differential methylated regions analysis
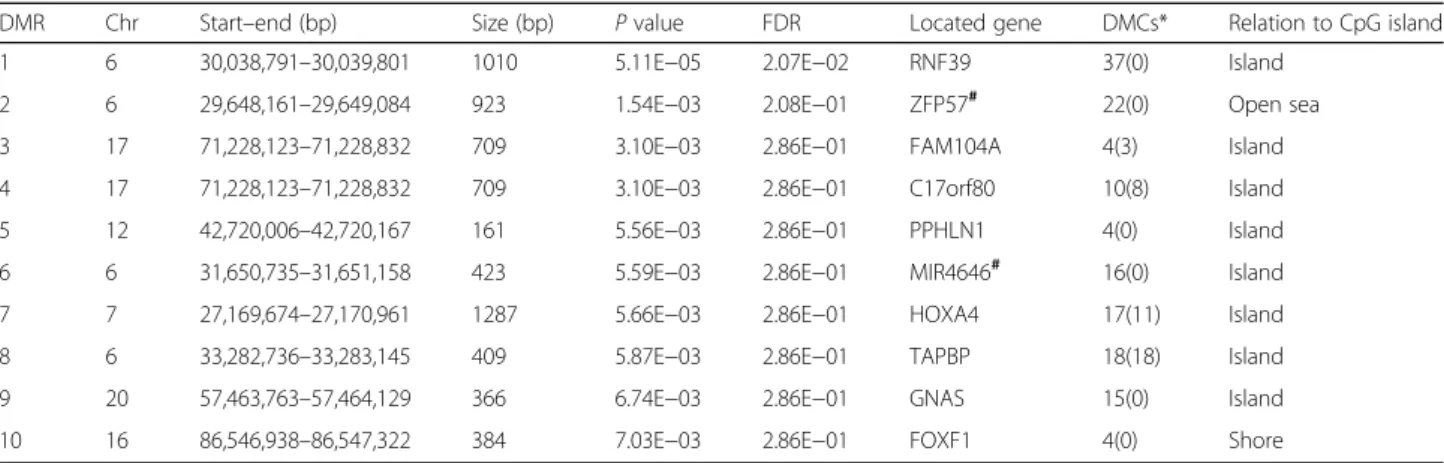
Ten DMRs were identified (P < 0.01) in obesity PPAT samples compared to normal weight controls (Table 3). The size of the DMRs varied from 161 to 1287 bp. Note-worthy, four out of the ten DMRs were discovered on chromosome 6. Eight regions were located in genes, and two were in the intergenic region. Four regions were in
the gene promoter of FAM104A, C17orf80, HOXA4A,
andTAPBP.
Association analysis between DNA methylation and mRNA expression
Increased DNA methylation of promoter in CpG islands was obviously linked to gene transcriptional silencing [26]. Therefore, we related hypermethylated CpG sites in PPAT with genes showed decreased gene expression level from our previously generated mRNA expression data [4]. DNA methylation of 16 CpG sites, corresponding to 14 genes, was associated with significantly decreased transcripts in OB/OW group (P value < 0.05) (Table4). The Spearman’s
rank correlation analysis showed that eight of the 14 genes have significantly negative association (P value < 0.05) be-tween the methylation profiles and the gene expression profiles of these genes (Table4). The repression genes were mainly involved in metabolic pathways (Additional file 13: Table S11, adjusted P value < 0.25), such as MOGAT1 (glycerolipid metabolism), FADS1 (fatty acid metabolism and biosynthesis of unsaturated fatty acids), and PCYT2 (glycerophospholipid metabolism). The mRNA expression level ofFADS1 was significantly decreased in the PPAT of obese with prostate cancers in our previous study using qRT-PCR [4]. Besides these, GO enrichment analysis showed that these genes are functionally related to receptor binding (neuropeptide receptor binding, dopamine receptor binding, and insulin receptor binding) and enzyme activity (acid phosphatase activity, metallocarboxypeptidase activity, and acylglycerol O-acyltransferase activity) (Additional file14: Table S12, adjustedP value < 0.25).
Discussion
This pilot study revealed significant differences of DNA methylation profiles between the PPATs from OB/OW versus NW PCa patients. Variations in global DNA methylation demonstrated that excess adiposity played an important role in DNA methylation level of PPAT tissues in prostate cancer patients, which provide an opportunity to explore the effect of obesity on PPAT epigenetic modification and subsequently on prostate cancer. These findings reported for the first time in PPAT depot are in concordance with previous works reporting that excess adiposity and BMI activate DNA methylation in adipose tissue [27–29]. Thus, considering the present understanding of the potential causal relationship between excess adiposity and cancer [30], diabetes [11], and cardiovascular disease [31], our results provide methylated candidate genes, which might foster research on the potential biological mechanisms under-lying epigenetic regulation of PPAT by excess adiposity and prostate cancer.
Given that DNA methylation of CpGs located at pro-moters and islands are associated with gene transcrip-tion silencing, we performed a strict filtering of DMCs and explored the biological functions of all promoter hypermethylated genes, aiming to find the critical meth-ylated CpGs in the PPAT between the obese and normal weight PCa patients. Bioinformatic analysis showed that the enriched pathways were mostly involved in meta-bolic disorders, particularly fatty acid degradation and glycerolipid and choline metabolism. These pathways are known to mediate the pro-tumoral effect of white adipose tissue in tumors, thus contributing to tumori-genesis and metastasis [32, 33], particularly in prostate cancer [5]. Findings from other oncological models high-light excess adiposity-associated impact in methylation
Fig. 3 Visualization and analysis of hypermethylated CpG sites in TAPBP promoter.a The chromosome positions of hypermethylated CpG sites show that DMCs are located at chr6 (p21.32), which is in the region of TSS1500 (pink square) of TAPBP and at the location of CpG island 31. b Methylation levels of eight CpG sites in PPAT from OB/OW and NW PCa patients have shown a significant difference. c Correlation analysis shows strong correlation (Spearman correlation coefficientr20.73~ 0.97) between the eight hypermethylated CpG sites based on the mean β value difference of individual probes
markers known to associate with potential effect in the cancer microenvironment (e.g., aromatase, prostaglandin E2 receptor in breast cancer) [34, 35]. Obesity has also been shown to associate with methylation of cancer-related genes (E-cadherin, p16, and RAR-β(2)) directly in malignant breast cells [36,37].
Pathway enrichment analysis showed a strong associ-ation between promoter hypermethylassoci-ation of CPT1B, CPT1C, ACADM, and FADS1, with fatty acid metabol-ism. CPT1B (carnitine palmitoyltransferase 1B) and CPT1C (carnitine palmitoyltransferase 1C) genes encode rate-limiting enzymes in fatty acid degradation and play critical roles in long-chain fatty acid (LCFA)β-oxidation by controlling transportation of long-chain fatty acyl-CoAs from the cytoplasm across the outer mitochondria
membrane [38]. Maple et al. reported that increased methylation of specific CpGs in the CPT1B promoter was correlated with decreased CPT1B transcripts in the skeletal muscle after lipid oversupply in severe obesity, which resulted in obese individual’s incapacity to increase fat oxidation, contributing to metabolic inflex-ibility [39]. Although the biochemical function ofCPT1C has been verified to be necessary for the regulation of
energy homeostasis in CPT1C knockout mouse brain
[40], the study of CPT1C methylation was absent. CPT1B and CPT1C were previously reported to be highly expressed in the muscle, brain, and many other normal tissues including adipocytes [41]. Taken together, these findings suggest that methylation of specific CpG sites in theCPT1B and CPT1C promoters likely result in gene
Table 3 Differentially methylated regions (DMR) in PPAT of obese/overweight PCa patients compared to normal weight controls
DMR Chr Start–end (bp) Size (bp) P value FDR Located gene DMCs* Relation to CpG island 1 6 30,038,791–30,039,801 1010 5.11E−05 2.07E−02 RNF39 37(0) Island
2 6 29,648,161–29,649,084 923 1.54E−03 2.08E−01 ZFP57# 22(0) Open sea 3 17 71,228,123–71,228,832 709 3.10E−03 2.86E−01 FAM104A 4(3) Island 4 17 71,228,123–71,228,832 709 3.10E−03 2.86E−01 C17orf80 10(8) Island 5 12 42,720,006–42,720,167 161 5.56E−03 2.86E−01 PPHLN1 4(0) Island 6 6 31,650,735–31,651,158 423 5.59E−03 2.86E−01 MIR4646# 16(0) Island 7 7 27,169,674–27,170,961 1287 5.66E−03 2.86E−01 HOXA4 17(11) Island 8 6 33,282,736–33,283,145 409 5.87E−03 2.86E−01 TAPBP 18(18) Island 9 20 57,463,763–57,464,129 366 6.74E−03 2.86E−01 GNAS 15(0) Island 10 16 86,546,938–86,547,322 384 7.03E−03 2.86E−01 FOXF1 4(0) Shore
#The DMR is located at the intergenic region Chr chromosome
*The number in the bracket is the quantities of DMCs located at the promoter (TSS200 and TSS1500) regions
Table 4 Genes hypermethylated in promoters with significantly decreased gene expression
Gene symbol DNA methylation Gene expression Correlation analysis Probe ID DNAmβ
diff. (%)
AdjustedP value (< 0.25)
Probe ID FC P value (< 0.05) Spearman’s rank
correlation coefficient P value (< 0.05) UCN cg20442078 5.6 0.17 8051061 − 1.12 3.61E−02 − 8.42E−01 2.23E−03 CCHCR1 cg00160818 1.9 0.17 8124868 − 1.14 1.73E−02 − 7.45E−01 9.21E−03 CRB3 cg14782015 4.3 0.20 8025041 − 1.13 1.84E−02 − 7.21E−01 1.21E−02 AGBL4 cg21834207 3.2 0.13 7915971 − 1.17 1.29E−02 − 6.73E−01 1.97E−02 INSL3 cg10174482 4.2 0.13 8035345 − 1.13 4.94E−02 − 6.36E−01 2.72E−02 ANKRD30B cg21293934 11.2 0.21 8069499 − 1.17 2.24E−02 − 6.08E−01 3.11E−02 FADS1 cg16213375 3.6 0.16 7948612 − 1.8 9.55E−04 − 5.88E−01 4.01E−02 PAPL cg18481683 2.3 0.24 8028570 − 1.19 1.45E−02 − 5.52E−01 5.21E−02 MOGAT1 cg12678667 4 0.15 8048725 − 1.28 3.87E−02 − 4.67E−01 8.91E−02 PPP1R1B cg09762778 5 0.12 8006865 − 1.27 4.74E−02 − 4.67E−01 8.91E−02 PRUNE2 cg00390775 4.4 0.15 8161884 − 1.31 1.91E−02 − 3.82E−01 1.39E−01 CIDEA cg18309817 1.8 0.18 8020211 − 1.32 3.21E−02 − 2.97E−01 2.03E−01 PCYT2 cg19583655 6.2 0.21 8019280 − 1.26 6.38E−04 − 1.88E−01 3.04E−01 SCUBE1 cg07697597 1.7 0.23 8076586 − 1.23 9.03E−03 − 4.24E−02 4.59E−01
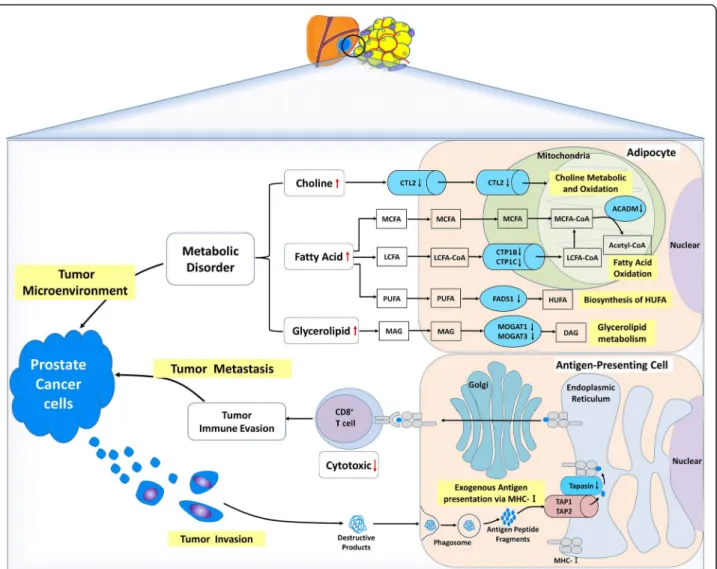
expression silencing, thus consequently contributing to fatty acid accumulation in adipocytes by decreasing long-chain fatty acidβ-oxidation in the mitochondria (Fig.4).
LCFA and ACADM genes (aliases MCAD, medium-chain acyl-CoA dehydrogenase) coding for metabolic enzymes presented increased methylation in the PPAT of the OB/OW group.ACADM is the critical enzyme of the initial step of β-oxidation and controls the medium-chain fatty acid (MCFA) metabolism by catalyzing the
dehydrogenation of medium-chain Acyl-CoA, which is the common middle product of MCFA and LCFA, in the mitochondria. Mutations inACADM cause MCAD defi-ciency, which resulted in fatty acid oxidation disorder leading to disease or infantile death [42–44]. Greco et al. [45] reported inverse association betweenACADM tran-script abundance with fat content in the human liver. Our findings suggest that the hypermethylated ACADM found in the PPAT of OB/OW PCa patients might fail to
Fig. 4 Proposed mechanisms with differentially methylated genes from PPAT of OB/OW prostate cancer patients. Hypermethylated genes in periprostatic adipose tissue of patients with increased adiposity might contribute towards the modulation of prostate tumor microenvironment. The genes that might be related to tumor microenvironment include choline transporter-like protein 2 (CTL2, which was a rate-limiting step of choline metabolism by transporting extracellular choline into cell and mitochondria), carnitine palmitoyltransferase 1B and 1C (CPT1B and CPT1C, which encode the rate-limiting enzymes of long-chain fatty acidβ-oxidation by controlling transportation of long-chain fatty acyl-CoAs from cytoplasm across outer mitochondria membrane), medium-chain-specific acyl-CoA dehydrogenase (ACADM, which catalyzes the initial step of medium-chain fatty acid β-oxidation in mitochondria), fatty acid desaturase 1 (FADS1, which was correlated with fatty acid metabolism by catalyzing polyunsaturated fatty acid biosynthesis), monoacylglycerolO-acyltransferases 1 and 3 (MOGAT1 and MOGAT3, which catalyze the formation of diacylglycerol by transferring fatty acyl-CoA to 2-monoacylglycerol), which contributes to metabolic disorder in adipose tissue by regulating the metabolism of lipid, choline, and glycerolipid. Another gene with hypermethylated promoter,TAPBP (transporter associated with antigen processing (TAP) transport protein), could influence tumor supervi-sion of immune cells in PPAT by altering tumor antigen presentation process from TAP to MHC class I in endoplasmic reticulum and result in tumor metastasis and cancer progression. The black downward arrows represent the promoter hypermethylated genes (in blue containers), and the red arrows represent the possible consequence of these methylated genes. LCFA long-chain fatty acid, MCFA media-chain fatty acid, PUFA polyunsaturated fatty acid, HUFA high unsaturated fatty acid, MAG monoacylglycerol, DAG dionoacylglycerol
generate medium-chain acyl-CoAβ-oxidation and result in MCFA and LCFA accumulation in adipose tissue, pro-viding a favorable tumor microenvironment for PCa cell aggressiveness (Fig.4). Additional functional studies are required to confirm this assumption.
The hypermethylation of the FADS1 (fatty acid desatur-ase 1) promoter, whose transcriptional activity was signifi-cantly decreased in OB/OW PCa patients in agreement with our previous study [4], has been described as corre-lated with polyunsaturated fatty acid (PUFA) metabolism by catalyzing the biosynthesis of highly unsaturated fatty acids (HUFA) from the catalysis of dihomo-gamma-linoleic acid (DGLA, 20:3 n-6) and eicosatetraenoic acid (ETA, 20:4 n-3) desaturation, in order to generate arachidonic acid (AA, 20:4 n-6) and eicosapentaenoic acid (EPA, 20:5 n-3) [46]. Genetic variants in the FADS1 and FADS2 gene clusters have been associated with altered (n-6) and (n-3) PUFA metabolism [47,48], whereas metabolic disorder in PUFA exerted effects on PCa by mediating the formation of eicosanoid inflammatory mediators (prostaglandins, leukotrienes, thromboxanes, and lipoxins), angiogenesis, immune cell regulation, and membrane structure and function [49,50]. These results illustrated that the epigen-etic modifications of FADS1 may play important roles in the regulation of fatty acid metabolic genes on PPAT in response to excess adiposity (Fig.4).
Besides abnormal fatty acid metabolism, DMC-related genes identified in our study were also correlated with gly-cerolipid metabolism.MOGAT1 and MOGAT3 encode the monoacylglycerolO-acyltransferase (MOGAT) and catalyze the formation of diacylglycerol (DAG) from monoacylgly-cerol (MAG), which is the precursor of phosphatidylcholine, phosphatidylethanolamine, and triacylglycerol (TAG), by transferring fatty acyl-CoA to 2-monoacylglycerol [51]. While humanMGAT1 (aliases for MOGAT1) is involved in intestinal dietary fat absorption and TAG synthesis in the liver, its function in adipose tissue has yet to be elucidated. The expression ofMGAT1 was increased in the liver of diet-induced obese mice with nonalcoholic fatty liver disease (NAFLD), but, interestingly, there was increased DAG accu-mulation and no inflammatory injury reduction in hepato-cytes after MGAT1 knockdown. Similarly, MOGAT3 was mostly expressed in the human intestine and liver and main-tained a significant DGAT (diacylglycerolO-acyltransferase) activity. Although results indicate that the metabolic mech-anism of lipid regulation by MGAT1 and MOGAT3 was altered, evidence of association between lipid metabolic dis-orders caused by aberrant expression of MGAT1/MOGAT3 and PCa are lacking. Our data indicate the methylation of MOGAT1 and 3 genes in PPAT may play important roles in response to excess adiposity by modulating glycerolipid metabolism (Fig.4).
Choline metabolic disorder might be caused by epigenetic regulation of SLC44A2 (solute carrier family
44 member 2), which encodes choline transporter-like protein 2 (CTL2) and is mainly expressed on blood plasma and mitochondrial membrane of different organ-isms and cell types. This transporter is a rate-limiting step in choline metabolism by transporting extracellular choline into cell and mitochondria. Choline is essential for synthesizing membrane phospholipid and neurotransmit-ter acetylcholine and used as a donor of methyl groups via choline oxidized in mitochondria [52]. The choline transporter has been associated with choline metabolic disorders, thus playing an important role in regulating im-mune response, inflammation, and oxidation [53, 54]. Concordantly, abnormal choline metabolism emerged as a metabolic hallmark, associated with oncogenesis and tumor progression in prostate cancer and other malignan-cies [55–57]. The increased uptake of choline by the cancer cell was important to meet the needs of phosphat-idylcholine synthesis [58]. We hypothesize that hyper-methylated SLC44A2 in adipocytes might be associated with lower uptake and oxidation of extracellular choline, resulting in choline accumulation in PPAT extracellular media (Fig.4) and increasing the availability of choline for PCa cell metabolism.
Besides metabolic modifications, altered immune regu-lation pathways were also enriched in DMC-related genes. TAPBP (alias tapasin) encodes a transmembrane glycoprotein, which mediates the interaction between MHC class I molecules and a transport protein TAP (transporter associated with antigen processing), being responsible for antigen processing and presentation. This mechanism occurs via mediating TAP to translocate endo/exogenous antigen peptides from the cytoplasm into the endoplasmic reticulum and deliver the antigen peptides to MHC class I molecules. The cancer cell’s survival depends on successful escape to immune surveillance. Loss of MHC class I has been described as a major immune evasion strategy for cancer cells. Down-regulation of antigen-presenting MHC class I pathway in tumor cells was a common mechanism for tumor cells escaped from specific immune responses, which can be associated with coordinated silencing of antigen-presenting machinery genes, such asTAPBP [59]. Cross-presentation is the ability of certain antigen-presenting cells to take up, process, and present extracellular anti-gens with MHC class I molecules to CD8+
T cells. This process is necessary for immunity against most tumors. Recent studies revealed thatTAPBP is a major target for cancer immune evasion mechanisms and decreased TAPBP expression in cancer was associated with reduced CD8+T cell-mediated killing of the tumor cells, lowered immune responses, and enhanced tumor metas-tases via downregulation of antigen presentation the MHC class I pathway [60, 61]. Our results showed that TAPBP promoter hypermethylation in the PPAT of
obese PCa subjects likely reduced the expression or ac-tivity of TAPBP, downregulating tumor cell’s antigen presentation of immune cells in PPAT, leading to impaired CD8+T cell activation (Fig.4). This indicates that methylation of TAPBP might be a mechanism by which prostate cancer cells escape the immune surveillance and provide an appropriate microenvironment for tumor aggressiveness, allowing prostatic cancer cells’ transfer, spread, and growth. The significant DMR identified with
eight DMCs located in the TAPBP promoter further
supported its role in prostate cancer.
From the PPI analysis, the network which was con-nected through ubiquitin C is characterized, suggesting UBC played a significant biological function with the methylated genes in PPAT between OB/OW and NW patients and somehow was correlated with the methyla-tion. Ubiquitin is much known with the functions including roles in protein degradation, DNA repair, cell cycle regulation, kinase modification, and cell signaling pathways [62]. Recent reports expressed that the ubiquitin-proteasome system was associated with the progression and metastasis of prostate cancers [63, 64]. And long-term silencing of the UBC was found to be correlated with DNA methylation at the promoters [65]. Additional studies are needed to clarify whether the pro-tein network for methylated genes impacts prostate can-cer and if this difference is associated with ubiquitin C.
Although we present the first report on periprostatic adipose tissue methylation profile in association with excess adiposity measured by BMI, our results should be interpreted in the context of several potential limita-tions. This study is limited by small sample size, even though representative groups of OB/OW and NW are likely to be selected following the strict inclusion/exclusion criteria and between-group match by clinicopathological and demographic variables. Although we matched patients by clinicopathological characteristics between adiposity groups, tobacco smoking was more frequent among OB/ OW compared with NW patients. Actually, albeit we can-not exclude an effect of smoking status on the presumably adiposity-associated findings presented herein, due to a known effect of tobacco on overall DNA methylation, data from previous reports indicate that methylation profiles are tissue-specific [66, 67] and that adiposity-associated DNA methylation occurs independently of tobacco smoking [68,69]. Future studies will benefit from the confirmation of these results in larger sample sizes, determination of correspondence to matched prostate tumor methylation patterns, investigation of interactome at the interface between tumor and PPAT, and prospective investigations on the value of PPAT epigenetic modifications on cancer recurrence and survival. Future validation and replication are important to establish the accuracy and generalizability of the reported associations.
In summary, we observed differences in PPAT methyla-tion between NW and OB individuals at several loci known to be involved in the metabolism of choline (SLC44A2), fatty acids (CPT1B, CPT1C, ACADM, FADS1), and
glycero-lipid (MOGAT1, MOGAT3) and in the regulation of
exogenous tumor antigen presentation (TAPBP). These findings suggest a relationship of adiposity status with the methylation profile, which ultimately modulates tumor microenvironment and may influence PCa behavior.
Conclusions
In this preliminary study, we report DNA methylation changes in PPAT underlying the association between excess adiposity and PCa. Whole epigenome methylation profiling of PPAT of PCa patients revealed significant differences in OB/OW versus normal weight subjects. Epigenetic imprint-ing in association with excess adiposity expressed the meth-ylated modifications in genes functionally related with lipid metabolism and immune function, which could ultimately contribute to an unfavorable tumor microenvironment and decreased immune surveillance for prostate tumors. This association analyses provided us novel insights into how prostate cancer patients with excess adiposity differ from those of patients with normal weight in epigenome. Findings from this study warrant confirmation in PPAT samples from larger number of patients.
Additional files
Additional file 1:Figure S1. Research flowchart. Whole research flowchart. NW normal weight, OB/OW obese/overweight, BMI body mass index, PPAT periprostatic adipose tissue, QC quality control, DMCs differentially methylated CpG sites, DMRs differentially methylated regions, Limma linear models for microarray and RNA-seq analysis data usingR, GO gene ontology, KEGG Kyoto Encyclopedia of Genes and Genomes, PPI protein-protein interaction network. (JPEG 128 kb)
Additional file 2:Table S1. Differentially methylated CpG sites in PPAT between obese/overweight PCa patients and normal weight controls. The table shows 5526 DMCs in PPAT between obese/overweight PCa patients and normal weight patients, which were identified by using the “Limma” method. (XLSX 663 kb)
Additional file 3:Figure S2. Heatmap of differentially methylated CpG sites between the PPAT of OB/OW PCa and NW PCa patients. The graphical display of hierarchical clustering for DMCs. The selected CpGs are those with FDR < 0.25 and beta difference between obesity and normal weight group larger than 10%. (JPEG 1797 kb)
Additional file 4:Table S2. Distribution of differentially methylated CpG sites in relation to the nearest gene regions. The table shows the distribution of DMCs according to the relation to the nearest gene regions. (XLSX 11 kb)
Additional file 5:Table S3. Distribution of differentially methylated CpG sites in relation to CpG islands. The table shows the distribution of DMCs according to the relation to CpG islands. (XLSX 13 kb)
Additional file 6:Table S4. Differentially methylated CpG sites located at both gene promoters and CpG islands. This table shows the 483 DMCs which locate at both gene promoters and CpG islands. (XLSX 76 kb)
Additional file 7:Table S5. GO biological process analysis of promoter hypermethylated genes. GO biological process analysis for 404 promoter hypermethylated genes. (XLSX 18 kb)
Additional file 8:Table S6. GO molecular function analysis of promoter hypermethylated genes. GO molecular function analysis for 404 promoter hypermethylated genes. (XLSX 13 kb)
Additional file 9:Table S7. Pathway enrichment analysis of promoter hypermethylated genes. Pathway enrichment analysis for 404 promoter hypermethylated genes. (XLSX 11 kb)
Additional file 10:Table S8. Pathway enrichment analysis of the genes included in PPI networks. Pathway enrichment analysis for methylated genes and related genes included in PPI networks. (XLSX 13 kb)
Additional file 11:Table S9. Selected genes with multiple hypermethylated CpG sites in PPAT with obese/overweight. The table shows the 38 selected genes which have multiple hypermethylated CpG sites. (XLSX 24 kb)
Additional file 12:Table S10. Pathway enrichment analysis of the selected genes with multiple hypermethylated CpG sites. Pathway enrichment analysis for the 38 selected genes which have multiple hypermethylated CpG sites. (XLSX 13 kb)
Additional file 13:Table S11. Pathway enrichment analysis of the overlapping genes. Pathway enrichment analysis for the 14 overlapping genes. (XLSX 13 kb)
Additional file 14:Table S12. GO molecular function analysis of the overlapping genes. GO molecular function analyses for the 14 overlapping genes. (XLSX 13 kb)
Abbreviations
AA:Arachidonic acid; ACADM: Aliases MCAD, medium-chain acyl-CoA dehydro-genase; BH: Benjamin and Hochberg; BMI: Body mass index; CPT1B: Carnitine palmitoyltransferase 1B; CPT1C: Carnitine palmitoyltransferase 1C; CTL2: Choline transporter-like protein 2; DAG: Diacylglycerol; DGAT: Diacylglycerol O-acyltransferase; DGAT2: DiacylglycerolO-acyltransferase 2; DGEs: Differential gene expressions; DGLA: Dihomo-gamma-linoleic acid; DMCs: Differentially methylated CpG sites; DMRs: Differentially methylated regions;
EPA: Eicosapentaenoic acid; ER: Endoplasmic reticulum; EWAS: Epigenetic-wide Association Studies; FADS1: Fatty acid desaturase 1; FDR: False discovery rate; GO: Gene ontology; GWAS: Genome-wide Association Studies; HUFA: Highly unsaturated fatty acid; KEGG: Kyoto Encyclopedia of Genes and Genomes; LCFA: Long-chain fatty acids; limma: Linear models for microarray and RNA-seq data; MAG: Monoacylglycerol; MCFA: Medium-chain fatty acid; MGAT1: Aliases for MOGAT1; MHC: Major histocompatibility complex;
MOGAT: Monoacylglycerolacyltransferase; MOGAT1: Monoacylglycerol O-acyltransferase 1; MOGAT3: MonoacylglycerolO-acyltransferase 3;
NAFLD: Nonalcoholic fatty liver disease; PCa: Prostate cancer; PPAT: Periprostatic adipose tissue; PPI: Protein-protein interaction analysis; PSA: Prostate-specific antigen; PUFA: Polyunsaturated fatty acid; QC: Quality control; SLC44A2: Solute carrier family 44 member 2; TAG: Triacylglycerol; TAP: Transporter associated with antigen processing; TAPBP: TAP binding protein; TSS: Transcription start site; TSS1500: 1500 bp upstream of the transcription start site; TSS200: 200 bp upstream of the transcription start site; UBC: Ubiquitin C
Funding
This work was supported in part by the Natural Sciences and Engineering Research Council of Canada, Manitoba Research Health Council, University of Manitoba, and China Scholarship Council.
Availability of data and materials
The datasets used and/or analyzed during the current study are available from the corresponding author on reasonable request.
Authors’ contributions
YC designed and implemented the experiments and drafted the manuscripts. JY helped generate the figures. PH supervised and monitored the whole project. RR, CM, AM, CP, VC, JGA, GF, and AR performed the tissue handling and processing, isolated the RNA, and conducted the gene expression experiment. RR, AF, AM, and CM collected the adipose tissue and clinicopathological patient information and edited the manuscript. RR, GF, and PH designed the study and edited the manuscript. All authors read, edited, and approved the final manuscript.
Ethics approval and consent to participate
Informed consent has been obtained from all the participants, and the study has received ethical approval from the Ethics Committee of Portuguese Institute of Oncology, Porto Centre.
Consent for publication
The participants/patients have given their consent for their data to be published in the report.
Competing interests
The authors declare that they have no competing interests.
Publisher’s Note
Springer Nature remains neutral with regard to jurisdictional claims in published maps and institutional affiliations.
Author details
1
Department of Biochemistry and Medical Genetics & Department of Electrical and Computer Engineering, University of Manitoba, Winnipeg, Canada.2Experimental Center, Northwest University for Nationalities, Lanzhou, People’s Republic of China.3Molecular Oncology Group,
Portuguese Institute of Oncology, Porto, Portugal.4Research Department, Portuguese League Against Cancer–North, Porto, Portugal.5Laboratory of
Genetics and Environmental Health Institute, Faculty of Medicine, University of Lisboa, Lisbon, Portugal.6Tumor & Microenvironment Interactions, i3S/
INEB, Institute for Research and Innovation in Health, and Institute of Biomedical Engineering, University of Porto, Porto, Portugal.7Department of
Urology, Centro Hospitalar Universitário do Porto, Porto, Portugal.8CINTESIS, Center for Health Technology and Services Research, Faculty of Medicine, e, University of Porto, Porto, Portugal.9Metabolic Research Laboratory, Universidad de Navarra, Pamplona, Spain.10CIBER Fisiopatología de la
Obesidad y Nutricion, Instituto de Salud Carlos III, Madrid, Spain.
11Department of Endocrinology, Clínica Universidad de Navarra, Pamplona,
Spain.12Department of Clinical Pathology, Centro Hospitalar e Universitário de Coimbra, Coimbra, Portugal.13i3S/INEB, Instituto de Investigação e
Inovação em Saúde/Instituto Nacional de Engenharia Biomédica,
Universidade do Porto, Tumor & Microenvironment Interactions, Rua Alfredo Allen, 208 4200-135 Porto, Portugal.
Received: 2 February 2018 Accepted: 5 April 2018
References
1. Labbé DP, Zadra G, Ebot EM, Mucci LA, Kantoff PW, Loda M, Brown M. Role of diet in prostate cancer: the epigenetic link. Oncogene. 2014; 34(36):4683–91.
2. Sutcliffe S, Colditz GA. Prostate cancer: is it time to expand the research focus to early-life exposures? Nat Rev Cancer. 2013;13:208–18. 3. Peisch SF, Van Blarigan EL, Chan JM, Stampfer MJ, Kenfield SA. Prostate
cancer progression and mortality: a review of diet and lifestyle factors. World J Urol. 2017;35(6):867–74.
4. Ribeiro R, Monteiro C, Catalán V, Hu P, Cunha V, Rodríguez A, Gómez-Ambrosi J, Fraga A, Príncipe P, Lobato C, Lobo F, Morais A, Silva V, Sanches-Magalhães J, Oliveira J, Pina F, Lopes C, Medeiros R, Frühbeck G. Obesity and prostate cancer: gene expression signature of human periprostatic adipose tissue. BMC Med. 2012;10:108.
5. Venkatasubramanian PN, Brendler CB, Plunkett BA, Crawford SE, Fitchev PS, Morgan G, Cornwell ML, McGuire MS, Wyrwicz AM, Doll JA. Periprostatic adipose tissue from obese prostate cancer patients promotes tumor and endothelial cell proliferation: a functional and MR imaging pilot study. Prostate. 2014;74:326–35.
6. Iordanescu G, Brendler C, Crawford SE, Wyrwicz AM, Venkatasubramanian PN, Doll JA. MRS measured fatty acid composition of periprostatic adipose tissue correlates with pathological measures of prostate cancer aggressiveness. J Magn Reson Imaging. 2015;42(3):651–7.
7. Laurent V, Guérard A, Mazerolles C, Le Gonidec S, Toulet A, Nieto L, Zaidi F, Majed B, Garandeau D, Socrier Y, Golzio M, Cadoudal T, Chaoui K, Dray C, Monsarrat B, Schiltz O, Wang YY, Couderc B, Valet P, Malavaud B, Muller C. Periprostatic adipocytes act as a driving force for prostate cancer progression in obesity. Nat Commun. 2016;7:10230.
8. Ribeiro R, Monteiro C, Cunha V, Oliveira MJ, Freitas M, Fraga A, Príncipe P, Lobato C, Lobo F, Morais A, Silva V, Sanches-Magalhães J, Oliveira J, Pina F, Mota-Pinto A, Lopes C, Medeiros R. Human periprostatic adipose tissue promotes prostate cancer aggressiveness in vitro. J Exp Clin Cancer Res. 2012;31:32.
9. Liu L, Li Y, Tollefsbol TO. Gene-environment interactions and epigenetic basis of human diseases. Curr Issues Mol Biol. 2008;10(2):25–36. 10. Tost J. DNA methylation: an introduction to the biology and the
disease-associated changes of a promising biomarker. Methods Mol Biol. 2009;507:3–20.
11. Barres R, Zierath J. DNA methylation in metabolic disorders. Am J Clin Nutr. 2011;93:897S–00.
12. Pinnick KE, Karpe F. DNA methylation of genes in adipose tissue. Proc Nutr Soc. 2011;70(1):57–63.
13. Benton MC, Johnstone A, Eccles D, Harmon B, Hayes MT, Lea RA, Griffiths L, Hoffman EP, Stubbs RS, Macartney-Coxson D. An analysis of DNA methylation in human adipose tissue reveals differential modification of obesity genes before and after gastric bypass and weight loss. Genome Biol. 2015;16:8. 14. Wu Y, Davison J, Qu X, Morrissey C, Storer B, Brown L, Vessella R, Nelson P,
Fang M. Methylation profiling identified novel differentially methylated markers including OPCML and FLRT2 in prostate cancer. Epigenetics. 2016; 11(4):247–58.
15. Shui IM, Wong CJ, Zhao S, Kolb S, Ebot EM, Geybels MS, Rubicz R, Wright JL, Lin DW, Klotzle B, Bibikova M, Fan JB, Ostrander EA, Feng Z, Stanford JL. Prostate tumor DNA methylation is associated with cigarette smoking and adverse prostate cancer outcomes. Cancer. 2016;122(14):2168–77. 16. Kobayashi Y, Absher D. DNA methylation profiling reveals novel biomarkers
and important roles for DNA methyltransferases in prostate cancer.Genome Res. 2011;21(7):1017–27.
17. Fraga A, Ribeiro R, Vizcaíno JR, Coutinho H, Lopes JM, Príncipe P, Lobato C, Lopes C, Medeiros R. Genetic polymorphisms in key hypoxia-regulated downstream molecules and phenotypic correlation in prostate cancer. BMC Urol. 2017;17:12.
18. Aryee MJ, Jaffe AE, Corrada-Bravo H, Ladd-Acosta C, Feinberg AP, Hansen KD, Irizarry RA. Minfi: a flexible and comprehensive Bioconductor package for the analysis of Infinium DNA methylation microarrays. Bioinformatics. 2014;30(10):1363–9.
19. Chen YA, Lemire M, Choufani S, Butcher DT, Grafodatskaya D, Zanke BW, Gallinger S, Hudson TJ, Weksberg R. Discovery of cross-reactive probes and polymorphic CpGs in the Illumina Infinium HumanMethylation450 microarray. Epigenetics. 2013; 11:8(2).
20. Ritchie ME, Phipson B, Wu D, Hu Y, Law CW, Shi W, Smyth GK. Limma powers differential expression analyses for RNA-sequencing and microarray studies. Nucleic Acids Res. 2015;43(7):289–300.
21. Benjamini Y, Hochberg Y. Controlling the false discovery rate: a practical and powerful approach to multiple testing. J R Stat Soc B. 1995;57(1):289–300.
22. Morris TJ, Butcher LM, Feber A, Teschendorff AE, Chakravarthy AR, Wojdacz TK, Beck S. ChAMP: 450k chip analysis methylation pipeline. Bioinformatics. 2014;30(3):428–30.
23. Wang D, Yan L, Hu Q, Sucheston LE, Higgins MJ, Ambrosone CB, Johnson CS, Smiraglia DJ, Liu S. IMA: an R package for high-throughput analysis of Illumina’s 450K Infinium methylation data. Bioinformatics. 2012;28(5):729–30.
24. Chen EY, Tan CM, Kou Y, Duan Q, Wang Z, Meirelles GV, Clark NR, Ma'ayan A. Enrichr: interactive and collaborative HTML5 gene list enrichment analysis tool. BMC Bioinformatics. 2013;14:128.
25. Xia J, Gill EE, Hancock REW. NetworkAnalyst for statistical, visual and network-based meta-analysis of gene expression data. Nat Protoc. 2015; 10(6):823–44.
26. Jones PA, Takai D. The role of DNA methylation in mammalian epigenetics. Science. 2001;293(5532):1068–70.
27. Dick KJ, Nelson CP, Tsaprouni L, Sandling JK, Aïssi D, Wahl S, Meduri E, Morange PE, Gagnon F, Grallert H, Waldenberger M, Peters A, Erdmann J, Hengstenberg C, Cambien F, Goodall AH, Ouwehand WH, Schunkert H, Thompson JR, Spector TD, Gieger C, Trégouët DA, Deloukas P, Samani NJ. DNA methylation and body-mass index: a genome-wide analysis. Lancet. 2014;383(9933):1990–8.
28. Rönn T, Volkov P, Gillberg L, Kokosar M, Perfilyev A, Jacobsen AL, Jørgensen SW, Brøns C, Jansson PA, Eriksson KF, Pedersen O, Hansen T, Groop L, Stener-Victorin E, Vaag A, Nilsson E, Ling C. Impact of age, BMI and HbA1c levels on the genome-wide DNA methylation and mRNA expression
patterns in human adipose tissue and identification of epigenetic biomarkers in blood. Hum Mol Genet. 2015;24(13):3792–813.
29. Zhang B, Zhou Y, Lin N, Lowdon RF, Hong C, Nagarajan RP, Cheng JB, Li D, Stevens M, Lee HJ, Xing X, Zhou J, Sundaram V, Elliott G, Gu J, Shi T, Gascard P, Sigaroudinia M, Tlsty TD, Kadlecek T, Weiss A, O'Geen H, Farnham PJ, Maire CL, Ligon KL, Madden PA, Tam A, Moore R, Hirst M, Marra MA, Zhang B, Costello JF, Wang T. Functional DNA methylation differences between tissues, cell types, and across individuals discovered using the M&M algorithm. Genome Res. 2013;23(9):1522–40.
30. Dedeurwaerder S, Desmedt C, Calonne E, Singhal SK, Haibe-Kains B, Defrance M, Michiels S, Volkmar M, Deplus R, Luciani J, Lallemand F, Larsimont D, Toussaint J, Haussy S, Rothé F, Rouas G, Metzger O, Majjaj S, Saini K, Putmans P, Hames G, van Baren N, Coulie PG, Piccart M, Sotiriou C, Fuks F. DNA methylation profiling reveals a predominant immune component in breast cancers. EMBO Mol Med. 2011;3(12):726–41. 31. Wang X, Zhu H, Snieder H, Su S, Munn D, Harshfield G, Maria BL, Dong Y,
Treiber F, Gutin B, Shi H. Obesity related methylation changes in DNA of peripheral blood leukocytes. BMC Med. 2010;8:87.
32. Booth A, Magnuson A, Fouts J, Foster M. Adipose tissue, obesity and adipokines: role in cancer promotion. Horm Mol Biol Clin Investig. 2015;21(1):57–74. 33. Hefetz-Sela S, Scherer PE. Adipocytes: impact on tumor growth and potential
sites for therapeutic intervention. Pharmacol Ther. 2013;138(2):197–210. 34. Zeng XC, Ao X, Yang HF, Zhang GX, Li WH, Liu QL, Tang YL, Xie YC,
He WG, Huang YN, Zhang L, Li RJ. Differential expression of stromal aromatase in obese females is regulated by DNA methylation. Mol Med Rep. 2014;10(2):887–90.
35. To SQ, Takagi K, Miki Y, Suzuki K, Abe E, Yang Y, Sasano H, Simpson ER, Knower KC, Clyne CD. Epigenetic mechanisms regulate the prostaglandin E receptor 2 in breast cancer. J Steroid Biochem Mol Biol. 2012;132:331–8. 36. Tao MH, Marian C, Nie J, Ambrosone C, Krishnan SS, Edge SB, Trevisan M,
Shields PG, Freudenheim JL. Body mass and DNA promoter methylation in breast tumors in the Western New York Exposures and Breast Cancer Study. Am J Clin Nutr. 2011;94(3):831–8.
37. Zolochevska O, Shearer J, Ellis J, Fokina V, Shah F, Gimble JM, Figueiredo ML. Human adipose-derived mesenchymal stromal cell pigment epithelium-derived factor cytotherapy modifies genetic and epigenetic profiles of prostate cancer cells. Cytotherapy. 2014;16(3):346–56.
38. Serra D, Mera P, Malandrino MI, Mir JF, Herrero L. Mitochondrial fatty acid oxidation in obesity. Antioxid Redox Signal. 2013;19(3):269–84.
39. Maples JM, Brault JJ, Witczak CA, Park S, Hubal MJ, Weber TM, Houmard JA, Shewchuk BM. Differential epigenetic and transcriptional response of the skeletal muscle carnitine palmitoyltransferase 1B (CPT1B) gene to lipid exposure with obesity. Am J Physiol Endocrinol Metab. 2015;309(4):E345–56. 40. Wolfgang MJ, Kurama T, Dai Y, Suwa A, Asaumi M, Matsumoto S, Cha
SH, Shimokawa T, Lane MD. The brain-specific carnitine
palmitoyltransferase-1c regulates energy homeostasis. Proc Natl Acad Sci U S A. 2006;103(19):7282–7.
41. van Tienen FHJ, van der Kallen CJH, Lindsey PJ, Wanders RJ, van Greevenbroek MM, Smeets HJM. Preadipocytes of type 2 diabetes subjects display an intrinsic gene expression profile of decreased differentiation capacity. Int J Obes. 2011;35(9):1154–64.
42. Hara K, Tajima G, Okada S, Tsumura M, Kagawa R, Shirao K, Ohno Y, Yasunaga S, Ohtsubo M, Hata I, Sakura N, Shigematsu Y, Takihara Y, Kobayashi M. Significance of ACADM mutations identified through newborn screening of MCAD deficiency in Japan. Mol Genet Metab. 2016;118(1):9–14.
43. Grünert SC, Wehrle A, Villavicencio-Lorini P, Lausch E, Vetter B, Schwab KO, Tucci S, Spiekerkoetter U. Medium-chain acyl-CoA dehydrogenase deficiency associated with a novel splice mutation in the ACADM gene missed by newborn screening. BMC Med Genet. 2015;16(1):56–65. 44. Ji S, Yang R, Lu C, Qiu Z, Yan C, Zhao Z. Differential expression of PPARγ,
FASN, and ACADM genes in various adipose tissues and longissimus dorsi muscle from Yanbian yellow cattle and Yan yellow cattle. Asian-Australasian J Anim Sci. 2014;27(1):10–8.
45. Greco D, Kotronen A, Westerbacka J, et al. Gene expression in human NAFLD. 2008:1281–1287. doi:https://doi.org/10.1152/ajpgi.00074.2008. 46. Berquin IM, Edwards IJ, Kridel SJ, Chen YQ. Polyunsaturated fatty acid
metabolism in prostate cancer. Cancer Metastasis Rev. 2011;30(3–4):295–309. 47. Lattka E, Illig T, Koletzko B, Heinrich J. Genetic variants of the FADS1 FADS2
gene cluster as related to essential fatty acid metabolism. Curr Opin Lipidol. 2010;21(1):64–9.
48. Glaser C, Heinrich J, Koletzko B. Role of FADS1 and FADS2 polymorphisms in polyunsaturated fatty acid metabolism. Metabolism. 2010;59(7):993–9. 49. Suburu J, Chen YQ. Lipids and prostate cancer. Prostaglandins Other Lipid
Mediat. 2012;98(1–2):1–10.
50. Chen YQ, Edwards IJ, Kridel SJ, Thornburg T, Berquin IM. Dietary fat–gene interactions in cancer. Cancer Metastasis Reviews. 2007;26(3–4):535–51. 51. Schweitzer GG, Finck BN. Targeting hepatic glycerolipid synthesis and turnover
to treat fatty liver disease. Advances in Hepatology. 2014;2014:498369. 52. Glunde K, Bhujwalla ZM, Ronen SM. Choline metabolism in malignant
transformation. Nat Rev Cancer. 2011;11(12):835–48. 53. Snider S. Choline transport links phospholipid metabolism and
inflammation in macrophages. 2017.http://hdl.handle.net/10393/35715. Accessed 28 July 2017.
54. Traiffort E, O’Regan S, Ruat M. The choline transporter-like family SLC44: properties and roles in human diseases. Mol Asp Med. 2013;34(2–3):646–54. 55. Kouji H, Inazu M, Yamada T, Tajima H, Aoki T, Matsumiya T. Molecular and
functional characterization of choline transporter in human colon carcinoma HT-29 cells. Arch Biochem Biophys. 2009;483(1):90–8. 56. Nishiyama R, Nagashima F, Iwao B, Kawai Y, Inoue K, Midori A, Yamanaka T,
Uchino H, Inazu M. Identification and functional analysis of choline transporter in tongue cancer: a novel molecular target for tongue cancer therapy. J Pharmacol Sci. 2016;131(2):101–9.
57. Mattie M, Raitano A, Morrison K, Morrison K, An Z, Capo L, Verlinsky A, Leavitt M, Ou J, Nadell R, Aviña H, Guevara C, Malik F, Moser R, Duniho S, Coleman J, Li Y, Pereira DS, Doñate F, Joseph IB, Challita-Eid P, Benjamin D, Stover DR. The discovery and preclinical development of ASG-5ME, an antibody-drug conjugate targeting SLC44A4-positive epithelial tumors including pancreatic and prostate cancer. Mol Cancer Ther. 2016;15(11):2679–87.
58. Sutinen E, Nurmi M, Roivainen A, Varpula M, Tolvanen T, Lehikoinen P, Minn H. Kinetics of [11C]choline uptake in prostate cancer: a PET study. Eur J Nucl Med Mol Imaging. 2004;31(3):317–24.
59. Vlková V,Štěpánek I, Hrušková V, Šenigl F, Mayerová V, Šrámek M, Šímová J, Bieblová J, Indrová M, Hejhal T, Dérian N, Klatzmann D, Six A, Reiniš M. Epigenetic regulations in the IFNγ signalling pathway: IFNγ-mediated MHC class I upregulation on tumour cells is associated with DNA demethylation of antigen-presenting machinery genes. Oncotarget. 2014;5(16):6923–35. 60. Pedersen MH, Hood BL, Beck HC, Conrads TP, Ditzel HJ, Leth-Larsen R.
Downregulation of antigen presentation-associated pathway proteins is linked to poor outcome in triple-negative breast cancer patient tumors. Oncoimmunology. 2017;6(5):e1305531.
61. Ylitalo EB, Thysell E, Jernberg E, Lundholm M, Crnalic S, Egevad L, Stattin P, Widmark A, Bergh A, Wikström P. Subgroups of castration-resistant prostate cancer bone metastases defined through an inverse relationship between androgen receptor activity and immune response. Eur Urol. 2017;71(5):776–87. 62. Lucia Radici MB, Rita Crinelli, Mauro Magnani. Ubiquitin C gene: structure,
function, and transcriptional regulation. Adv Biosci Biotechnol 2013;4:1057–1062. 63. Song HM, Lee JE, Kim JH. Ubiquitin C-terminal hydrolase-L3 regulates EMT process and cancer metastasis in prostate cell lines. Biochem Biophys Res Commun. 2014;452(3):722–7.
64. Jang MJ, Baek SH, Kim JH. UCH-L1 promotes cancer metastasis in prostate cancer cells through EMT induction. Cancer Lett. 2011;302(2):128–35. 65. Hawkins PG, Santoso S, Adams C, Anest V, Morris KV. Promoter targeted
small RNAs induce long-term transcriptional gene silencing in human cells. Nucleic Acids Res. 2009;37(9):2984–95.
66. Wahl S, Drong A, Lehne B, et al. Epigenome-wide association study of body mass index, and the adverse outcomes of adiposity. Nature. 2017;541(7635):81–6. 67. Rahmioglu N, Drong AW, Lockstone H, Tapmeier T, Hellner K, Saare M,
Laisk-Podar T, Dew C, Tough E, Nicholson G, Peters M, Morris AP, Lindgren CM, Becker CM, Zondervan KT. Variability of genome-wide DNA methylation and mRNA expression profiles in reproductive and endocrine disease related tissues. Epigenetics. 2017;12(10):897–908.
68. Agha G, Houseman EA, Kelsey KT, Eaton CB, Buka SL, Loucks EB. Adiposity is associated with DNA methylation profile in adipose tissue. Int J Epidemiol. 2015;44(4):1277–87.
69. Turcot V, Tchernof A, Deshaies Y, Pérusse L, Bélisle A, Marceau S, Biron S, Lescelleur O, Biertho L, Vohl MC. LINE-1 methylation in visceral adipose tissue of severely obese individuals is associated with metabolic syndrome status and related phenotypes. Clin Epigenetics. 2012;4(1):10.