Universidade de Lisboa
Faculdade de Medicina
THE CONTRIBUTION OF ODOR INDUCED ACTIVITY TO
ADULT NEUROGENESIS
Behavioural and Morphological consequences of the different learning contexts
Faculdade de Medicina
THE CONTRIBUTION OF ODOR INDUCED ACTIVITY TO
ADULT NEUROGENESIS
Behavioural and Morphological consequences of the different learning contexts
Inês Sofia Silva Vieira
Mestrado em Neurociências, 2012
Dissertação orientada por:
Internal supervisor: Profª. Doutora Ana Sebastião1,2 Supervisor: Doutor Pierre-Marie Lledo, Institut Pasteur3,4
Co-supervisor: Doutor Gilles Gheusi, Institut Pasteur3,4
1.Institute of Pharmacology and Neuroscience, Faculty of Medicine; 2. Unit of Neuroscience, Institute of Molecular Medicine, University of Lisbon. 3. Institut Pasteur, Laboratory of Perception and Memory , Paris, France and 4. Centre National de la Recherche Scientifique(CNRS) Unité de Recherche Associée(URA) Paris, France
Todas as afirmações efectuadas no presente documento são de exclusiva responsabilidade do seu autor, não cabendo qualquer responsabilidade à Faculdade de Medicina da Universidade de Lisboa
pelos conteúdos nele apresentado.
A realização desta dissertação foi aprovada pela Comissão Coordenadora do Conselho Científico da Faculdade de Medicina da Universidade de Lisboa.
I would like, in this modest way, to mention and thank all of those that somehow contributed throughout this year to this master’s thesis for the degree of Master in Neuroscience:
First of all, to Dr. Pierre Marie Lledo, my supervisor, for giving me the chance to be in the laboratory and for the support and advices throughout this year.
To my co-supervisor, Dr. Gilles Gheusi, for introducing me into the field of behavior where all the evidences are questionable, for the good moments working, for his patience and for all the opinions, comments and help.
To Dr. Gabriel Lepousez not just for teaching me the hardest techniques, but also for generously finding rapid solutions to all the troubles faced.
To Julien Grimaud, for his great methodic collaboration in the cell counting, morphological analysis and image acquisition.
To Carine Moigneu for the help with the mice surgeries.
To Dr. M. M. Gabellec for helping with the immunohistochemistry.
To S. Wagner for ‘playing’ with the olfactometers and improving the behavioral boxes we used. Thanks to all the passionate researchers and students of the laboratory that, without exceptions, contributed to the exciting scientific discussions in the lab meetings, to the constructive critiques for this project, and finally to the great environment of work.
To Dr. Ana Sebastião, my internal co-supervisor, for the teaching, for coordinating the Master and for the help whenever it was necessary along this two years.
Lastly, to my family and friends, the ones that supported me in all the decisions and all the stages of my life, without them nothing would be possible.
The Olfactory Bulb (OB) is the first relay of the main olfactory system. In the OB, newborn neurons coming from the subventricular zone differentiate into interneurons and integrate mainly in the granule cell layer. Bulbar neurogenesis is an activity dependent process that is modulated by odors. Notably, odor learning in a critical time window is able to increase neurogenesis in the OB, but whether odor exposure or learning per se shape neurogenesis is not clearly understood. To clarify this question, we tested the effect on adult neurogenesis of olfactory associative learning versus auditory associative learning (i.e. a different sensory modality) versus passive exposure to odorants versus control animals. Using these four experimental contexts of sensory stimulation, we then investigated the consequences on the number and the cell morphology of a cohort of newborn cells labelled with BrdU and GFP. Using BrdU, no difference was observed between conditions whereas using GFP, the olfactory learning condition had a significant increase in the number of cells when compared with auditory learning. Modest increase in cell survival was also observed after odor exposure and auditory learning. Morphological analysis revealed a reduced main dendrite length after odor learning. This study suggests that olfactory exposure and the process of learning per se cooperate to boost the survival and the integration of newborn neurons into the OB.
No BO, os novos neurónios provenientes da zona subventricular diferenciam-se em interneurónios e são integrados principalmente na camada de células granulares. A neurogénese bulbar é um processo dependente de actividade e é modulado pela presença de odores. A aprendizagem de odores num período de tempo crítico é responsável por aumentar a neurogénese no BO, contudo, ainda está por clarificar de que forma a exposição a odores ou o processo de aprendizagem por si modula a neurogénese. Assim, foram testados os efeitos da aprendizagem associativa olfactiva versus da aprendizagem associative auditiva (i.e., de uma modalidade sensorial diferente) versus da exposição passiva a odores versus grupo controlo na neurogénese do adulto. Partindo destes quatro contextos experimentais de estimulação sensorial, foram investigadas as consequências no número e na morfologia celular de uma coorte de novos neurónios marcados com BrdU e GFP. Com BrdU, não foram observadas diferenças entre as condições enquanto que utilizando GFP, o grupo de aprendizagem olfactiva mostrou um aumento significativo no número de novos neurónios comparativamente ao grupo de aprendizagem auditiva. Um ligeiro aumento na sobrevivência celular foi observado após exposição passiva a odores ou a aprendizagem auditiva. A análise morfológica demonstrou que no grupo de aprendizagem olfactiva, o comprimento da dendrite principal é menor. Este estudo sugere que a exposição a odores e o processo de aprendizagem por si cooperam para aumentar a sobrevivência e a integração de novos neurónios no BO.
Palavras-chave: Bulbo olfactivo – neurogénese bulbar – novos neurónios - aprendizagem –
Introduction………...……….………..…. 1
Synaptic organization of the Olfactory Bulb ………..………2
Bulbar adult neurogenesis ………...……5
Synaptic plasticity of adult born neurons in the OB……….………..….. 6
Time and sensory experience dependent survival of Adult-Born Neurons in the OB………..………8
Functional role of adult born neurons in the OB ………9
Odor perception………...…..9
Odor discrimination ………10
Olfactory memory ………...…10
Experimental design ………...…11
Material and Methods ... 13
Animals ……….….13
Injections……….13
Behavioral apparatus, training, and odorants ………..15
Brain fixation and slices preparation ……….…20
Immunohistochemistry ………..………..20
Image acquisition ………..………...22
Image analysis ………...………..23
Statistical analysis ……….………..24
Time course of the behaviour experiments ……….………...………..26
Results.………...….28
BrdU positive cells - Olfactory discrimination learning does not crucially regulate survival of adult born neurons in the OB ………...……….30
Sparse colocalization was observed between GFP+ and BrdU+ cells……….………..………..31
GFP positivecells - The survival of adult born neurons is differentially regulated by different sensory experience………..32
Odor learning induces a decrease in the proximal dendritic length of the newborn granule cells ………..33
Discussion ………...………..36
1)Behavioural performance……….36
2)Effect of training in the cell density of adult born neurons in the OB ……….………..37
2.1) Counting of GFP+ cells ………..……….37
2.2) Counting of BrdU+ cells ………..37
2.3) Colocalization of BrdU+ and GFP+ cells ……….,……….39
3) Influence of training in the cell morphology ………..………..39
4) Future work………40
Conclusion ……….43
References ……….44 Supplemental data ……….a
Figure 1: General scheme of the connections of the main olfactory system and the accessory olfactory system.
Figure 2: Synaptic organization of the olfactory bulb. Figure 3: Different steps of adult neurogenesis in the OB. Figure 4: Stereotaxic injections.
Figure 5. Immunohistochemistry using two different techniques. Figure 6. Sholl analysis methodology.
Figure 7: Performance of the mice of the groups OL (Odor Learning, n=14) and AL (Auditory
Learning, n=16) in session 1 and 2.
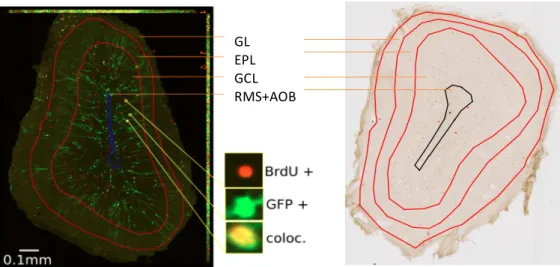
Figure 8: Representative images of 40µm coronal sections of the OB with the GL, EPL, GCL,
RMS and AOB delineated for cell counting with QUIA.
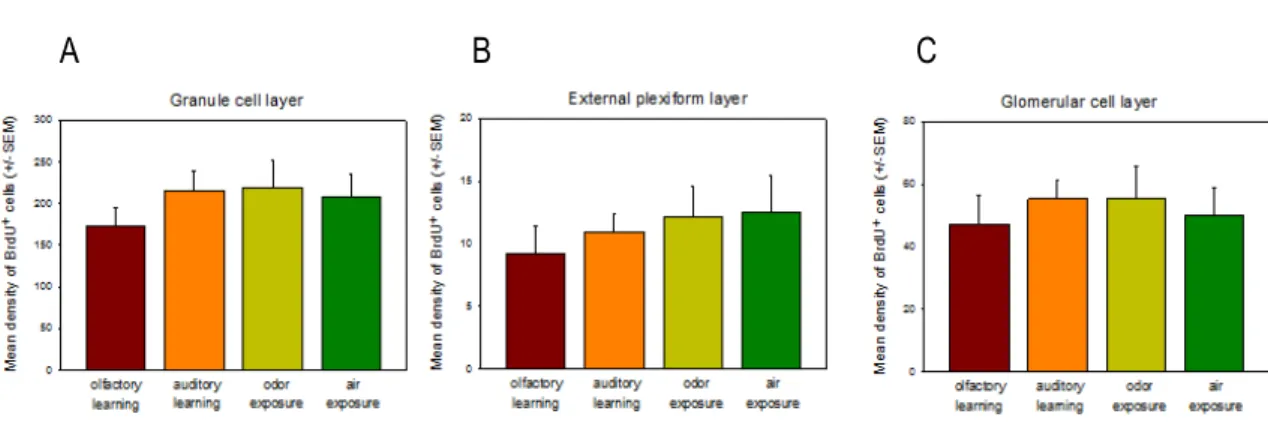
Figure 9: Graphics expressing the results of the counting of cells BrdU+ resulting from
immunohistochemistry with DAB.
Figure 10: Graphics expressing the results of the counting of cells BrdU+ resulting from
immunofluorescence.
Figure 11: Graphics expressing the results of the counting of cells GFP+ resulting from
immunofluorescence
Figure 12: Graphics expressing the results of the counting of cells double labelled GFP+ BrdU+.
Figure 13: Analysis of the different morphological parameters of the newborn GCs according to
the condition. The length is expressed in µm. The illustration above each graphic represents in red what was measured.
analysis of the groups OL (Odor Learning, n=6) and AL (Auditory Learning, n=8) in session 1 and 2.
Supplemental Figure 2: Analysis of the different morphological parameters of the newborn
GCs according to the condition.
Supplemental Figure 3: Terminal of the main dendrite of a granule cell of an AL mouse. Supplemental Figure 4: Performance of the mice in the first part of a span capacity working
memory test.
Index of Tables
Table 1. Different groups of study according to the sensory modality and the type of exposition
evolved.
Supplemental Table 1. Number of mice trained within session and within condition according
AE Air Exposure AL Auditory Learning
AOB Acessory Olfactory Bulb AON Anterior Olfactory Nucleus Ara–C Arabinofuranosyl Cytidine BrdU 5-bromo-2'-deoxyuridine CMV Cytomegalovirus
DAB 3,3′-Diaminobenzidine DAPI 4',6-diamidino-2-phenylindole
DPI Days Post Injection
DG Dentate Gyrus EC Enthorinal Cortex
EPL External Plexiform Layer GC Granule cell
GCL Granule Cell Layer GFP Green Fluorescent Protein GL Glomerular Layer
ITI Intertrial Interval LA Lateral Amygdala LOT Lateral Olfactory Tract MC Mitral Cell
MCL Mitral Cell Layer
MOE Main Olfactory Epithelium
NaCl Sodium chloride NaOH Sodium hydroxide OB Olfactory Bulb OE Odor Exposure OL Odor learning
ONL Olfactory Nerve Layer OSN Olfactory Sensory Neurons OT Olfactory Tubercle
PC Piriform Cortex
PBS Phosphate Buffered Saline PFA Paraformaldehyde
PGC Periglomerular cell
RMS Rostral Migratory Stream SAC Short Axon cell
SVZ Sub-ventricular zone TF Tufted cell
SEM Standard Error of the Mean VNO Vomeronasal Organ WM Working Memory
WPRE woodchuck hepatitis
Introduction
Humans and other animals share the capacity to learn. A decision to act is based on learning that a particular stimulus predicts a reward if a particular action is pursued (Salzman et al., 2005). How we react to a certain stimulus, to perform a task or how we learn a process by simple association and which brain areas are involved is still unclear. Once perceiving a sensory stimulus, such as an odorant, we are able to associate it automatically to events, persons or objects. This process requires specific forms of learning and memory.
The olfactory system is the component of the nervous system responsible for processing the millions of volatile molecules (odorants) present in the environment and mapping them onto a mental representation in the central nervous system.
In mice and mammals overall, this system is composed of two pathways, the main olfactory system and the accessory olfactory system. To each system belong respectively a sensory organ, the Main Olfactory epithelium (MOE) and the Vomeronasal Organ (VNO) (Figure 1).
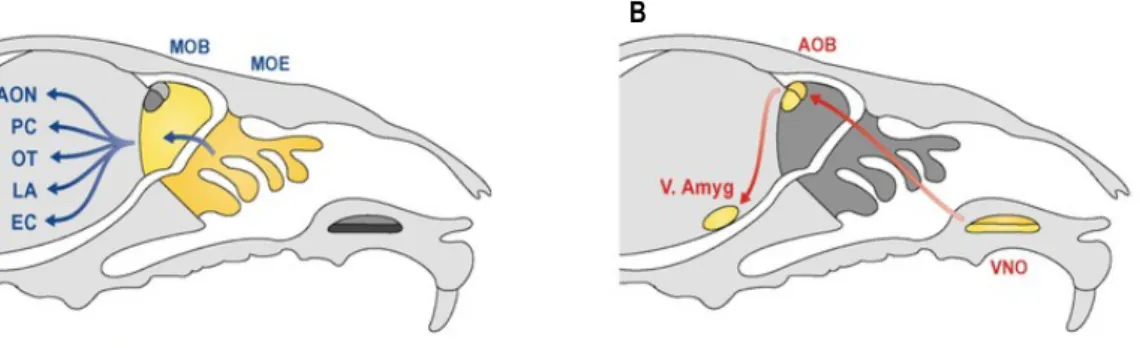
Figure 1: General scheme of the connections of the main olfactory system and the accessory olfactory system.
Representation of sagittal sections of a mouse brain. A. The axons present in the MOE project to the main olfactory bulb (MOB), forming the olfactory nerve. The projection neurons from the OB send their axons (the lateral olfactory tract, LOT) to the different structures of the olfactory cortex, among them the anterior olfactory nucleus (AON), the olfactory tubercle (OT), the piriform cortex (PC), the lateral amygdala (LA) and the entorhinal cortex (EC). B. The axons arising from the vomeronasal organ (VNO) form the vomeronasal nerve and project to the accessory olfactory bulb (AOB). The projection neurons send their axons mainly to the Ventral Amygdala.
The main olfactory system detects and processes the vast majority of chemical cues that enter the
nasal cavity while the accessory olfactory system is mainly responsible for integrating heavy-molecular-weight, non volatile molecules responsible for reproductive and defensive behavior. Over the past two decades the accessory olfactory system has drawn a great deal of attention because of its essential role in pheromone detection and social communication. However, the traditional opinion that the main olfactory system only detects volatile odorants and the accessory olfactory system only detects non-volatile pheromones is no longer valid (Brennan PA. and Zufall F. 2006; Baum MJ and Kelliher KR 2009).
The Olfactory Bulb (OB) is the principal component of the main olfactory system. With a very well described organization, connection to other brain structures, and ease of acessibility in the mouse, it provides an interesting model system for learning studies. In the adult brain, this organ is continuously supplied with newborn cells coming from the sub ventricular zone (SVZ). This process, bulbar neurogenesis, has a role in odor learning and processing of odor information. Synaptic organization of the Olfactory Bulb
In the main olfactory system, the information is processed from the periphery to the OB. The olfactory sensory neurons (OSN) located in the olfactory epithelium, are the first neurons in contact with the external environment. Those OSN will connect to the OB where each axon innervates mainly principal cells (Firestein, 2001). The odorants, composed of a mixture of volatile molecules in the air, bind to the olfactory receptors present on the cilia of the OSN. There are ~900 different olfactory receptors in mice, each OSN only expresses one receptor and all the OSN expressing the same receptor converge to the same spatial position on the surface of the OB, thus creating a spatial map of odor receptors (Buck and Axel, 1991). This chemical signal is then transduced into electric impulses, which propagate trough the axon of the OSN into the olfactory bulb.
Once in the bulb, this information goes to the output neurons (mitral and tufted cells), which receive sensory inputs from the OSN and inhibitory inputs from local interneurons. The major part of the
interneurons are Granule Cells (GCs, GABAergic) and Periglomerular cells (PGCs, GABAergic and dopaminergic). Those interneurons are the major neural population in the OB, GABAergic GCs outnumber the output neurons by a factor of more than 10 (Shepherd et al. 2004).
In response to sensory inputs, mitral and tufted cells release glutamate onto GCs spines, that in turn release GABA onto activated mitral and tufted cell dendrites. This dendrodendritic inhibition mediates also lateral inhibition between neighbouring mitral cells and synchronization during odor presentation (Rall and Shepherd 1968; Friedman and Strowbridge 2000; Schoppa 2006). Lastly, bulbar interneurons also receive inhibitory inputs from other types of local OB interneurons in the Granule Cell Layer (GCL) (Eyre et al. 2008) and excitatory inputs from axons collaterals of the mitral and tufted cells and from terminals of centrifugal projections (Balu et al. 2007) (Figure 2C). According to the different cell types present in the OB, it is possible to identify five different concentric layers with specific cells and connexions with afferent and efferent regions of the olfactory system (Shipley et Ennis, 1996; Shepherd, 2004).
The most external layer, the Olfactory Nerve Layer (ONL), is where the axons of the OSN coming from the olfactory epithelium are located. Then, the Glomerular Layer (GL) is composed by glomeruli and surrounded by juxtaglomerular neurons. A glomerulus is made up of a globular tangle of axons from the olfactory sensory neurons and dendrites from the mitral and tufted cells, as well as from cells that surround the glomerulus such as the external tufted cells, periglomerular cells, short axon cells and astrocytes. The cell bodies of the neurons and the astrocytes together make a physical barrier for the diffusion of the neurotransmitters to the outside of the glomeruli. Deeper in the bulb, the External Plexiform Layer (EPL) contains the dendrites of the principal neurons and the apical dendrites of granule cells (Shepherd, 2004). In a smaller proportion, we find also the cell bodies of short axon cells and tufted cells. A thinner layer deep to this one, the mitral cell layer (MCL), contains mainly the cell bodies of the mitral cells.
The internal plexiform layer is composed of axons of the mitral and tufted cells, the dendrites of the interneurons and centrifugal fibers. Finally, the GCL is the most internal layer and is composed by granule cell somas and axons of mitral cells, tufted cells and centrifugal fibers. In the deepest part of the GCL is situated the rostral migratory stream (RMS). This area contains the immature neuroblasts, which are migrating and will differentiate into GCs in the GCL or periglomerular cells in the GL (Figure 2A, 2B).
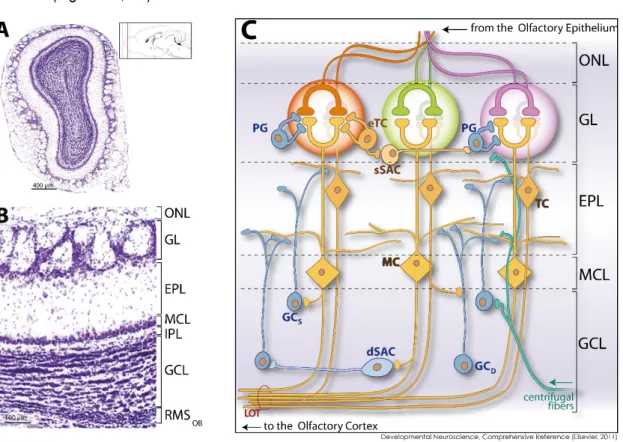
Figure 2: Synaptic organization of the olfactory bulb (OB). A. Coronal section of the OB B. Representation of the
different layers of the OB: Olfactory Nerve Layer (ONL), Glomerular Layer (GL), External Plexiform Layer (EPL), Mitral Cell Layer (MCL), Internal Plexiform Layer (IPL), Granule Cell Layer (GCL) and Rostral Migratory Stream (RMS). C. Schematic cellular organization in the OB: The olfactory epithelium (OE) located in the nasal cavity is composed of olfactory sensory neurons (OSN), which project to the OB through their axons located in the Olfactory Nerve Layer (ONL). OSNs responding to an odorant project their axons to the main olfactory bulb into one of the glomeruli that form the Glomerular Layer (GL). In the GL, sensory neuron terminals synapse onto the apical dendrites of output neurons - the mitral cells (MC) and the tufted cells (TC). In addition, periglomerular cells (PGC), superficial short-axon cells (sSAC), and external tufted cells (eTC.) act on glomerular synaptic transmission exerting diverse functional effects. In the external plexiform layer (EPL), the lateral dendrites of mitral and tufted cells interact with the dendrites of granule cells (GC). Granule cells can also be subdivided into distinct subpopulations: superficial granule cells (GCS) that target the superficial lamina of the external plexiform layer and synapse with tufted cells. Deep granule cells (GCD) targeting the deep lamina of the external plexiform layer are connected to mitral cells. The soma of mitral cells are aligned and delineate the Mitral Cell Layer (MCL), and the soma of tufted cells are scattered in the EPL. Granule cell somas and also some deep short-axon cells (dSAC) compose the granule cell layer (GCL). Centrifugal fibers from other brain
regions innervate specific layers of the olfactory bulb, with respect to their brain origin. Lastly, output neuron axons fasciculate to form the lateral olfactory tract (LOT). All the cell types colored in orange are glutamatergic, GABAergic cells are in blue.
Bulbar adult neurogenesis
The OB shares with the dentate gyrus (DG) of the hippocampus the ability to continually generate new neurons in the adult brain – adult neurogenesis. This cellular renewal is not static or merely restorative; adult neurogenesis represents an adaptive response to challenges imposed by the animal’s environment or its internal state. This fact raises some important questions about the role of neurogenesis in mature neuronal circuits.
While in the embryo bulbar interneurons are generated in the ganglionic eminence migrating to the developing OB (Wichterle et al. 2001), in the adult brain, those interneurons are derived from the sub-ventricular zone (SVZ), near the medial wall of the lateral ventricles of the forebrain where they give rise to neuroblasts and migrate in the rostral migratory stream (RMS) to the OB.
The adult SVZ neural stem cells are capable of producing the three major cell types of the central nervous system: neurons (about 95% GABAergic and 3% dopaminergic), astrocytes and oligodendrocytes. In the SVZ, four main cell types are present (Doetsch et al. 1997). A layer of ependymal cells (E) lines the lateral ventricle. Close to these cells, slow-dividing astrocytic stem cells (type B cells) divide asymmetrically to generate clusters of type C cells, transit amplifying cells, which in turn originate type A cells (neuroblasts), by symmetrical division, that start to migrate in chain to the rostral migratory stream (RMS), 5 days after birth (Figure 3). Sequentially, the neuroblasts coming from the RMS will differentiate into interneurons.
A question remaining to ask is how neuroblasts differentiate and integrate into fully functional circuits. Recently, some of the molecular and cellular events that govern the synapse formation, development and integration of the adult born neurons into the OB have begun to be elucidated.
The GC maturation comprises five stages, from migrating neuroblasts to GCs with a complex dendritic tree (Petreanu and Alvarez-Buylla, 2002).
Class-1 cells represent cells migrating in the RMS, once they reach the OB, newborn neurons (class 2) begin a radial migration and extend their apical dendrite through the GCL toward the mitral cell layer to the EPL. Ten days after birth, newborn neurons start receiving the GABAergic and glutamatergic synaptic inputs in the GCL (class 3) and then excitatory inputs in the EPL (class 4 cells). Ultimately, adult born neurons reach their final stage of development when they exhibit distal branches with full spine density (class 5).
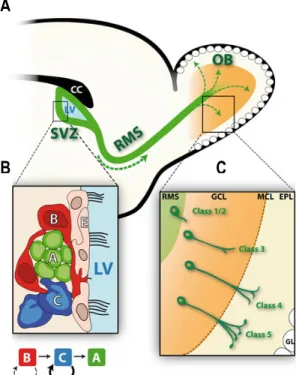
Figure 3: Different steps of adult neurogenesis in the OB. A. Representation of a sagittal slice of the adult mouse brain
displaying the areas where proliferation, migration and differentiation of the newborn cells occur. Germinal zone, SVZ (sub-ventricular zone), RMS (rostral migratory stream) containing the migrating neuroblasts, and the OB (Olfactory Bulb), final destination of newborn neurons. B. The SVZ contains the ependymal cells (E) lining the lateral ventricle. The first neural progenitors, type B cells will give rise to fast-dividing type C cells which will originate type A cells – neuroblasts C. The neuroblasts take a long time to differentiate into interneurons following a specific period of morphological maturation. The process is similar for Granule and Periglomerular cells.
Synaptic plasticity of adult born neurons in the OB
Even after the final stage of development, the neural network of adult born neurons in the OB is
A
highly dynamic and sensitive to changes at the level of sensory inputs. As an example, sensory deprivation decreases synaptic wiring of adult-born neurons and this activity-dependent change is restricted to a time window when adult-born neurons first develop their synapses (Kelsch et al. 2009). In addition, the different regions of the adult born GC dendrite are differentially affected by a reduction of sensory input, while the distal and basal parts of the GC dendrite show a reduction of excitatory inputs, the density of the glutamatergic synapses on the proximal region of the apical dendrite increases. This dual regulation could represent a compensatory mechanism to a variation in the sensory environment to preserve a minimal level of excitation on adult-born GCs and therefore for survival (Sagathelyan et al. 2005; Kelsch et al. 2009).
In contrast to the idea that adult born neurons plasticity is restricted to a specific period of time, Whitman and Greer (2007) have shown that between 28 and 56 days after birth, newborn GCs exhibit a transient overproduction of spines followed by a drastic elimination. Also supporting this idea, using time-lapse two-photon microscopy, both adult born GCs and PGCs demonstrates plasticity several months after their maturation and integration into the OB (Livneh and Mizrahi, 2011).
The potential for synaptic plasticity over time is a specific contribution of adult-born neurons. The comparison of the potential for synaptic organization of adult-born neurons with neurons generated during the neonatal period has shown that neonatal GCs are largely variable in the density of their synaptic inputs in contrast to the adult born interneurons which display stable synaptic connectivity over time (Kelsch et al. 2012). The adult born GCs exhibit specific patterns of neural activity, between 2 and 6 weeks after cell birth, GCs exhibit long-term potentiation of its proximal excitatory inputs (Nissant et al. 2009) playing a critical role in the formation and maintenance of synapses in newborn GCs.
Time and sensory experience dependent survival of Adult-Born Neurons in the OB
Sensory experience has a clear role for neuronal survival (Petreanu and Alvarez-Buylla 2002; Rochefort et al. 2002).
Odor experiences are responsible for increasing the rate of cell survival and integration of newborn neurons in the OB (Rochefort et al. 2002; Miwa and Storm 2005; Bovetti et al. 2009; Moreno et al. 2009; Veyrac et al. 2009), while sensory deprivation decreases the survival of newly generated neurons (Corotto et al. 1994; Petreanu and Alvarez-Buylla 2002; Yamaguchi and Mori 2005). Perceptual learning, a form of implicit memory, has been shown to increase the number of newborn GCs in the OB (Moreno et al., 2009). Olfactory associative learning also promotes the survival of adult-born neurons in the OB (Alonso et al. 2006; Mouret et al. 2008; Kermen et al. 2010; Sultan et al. 2010, Sultan et al. 2011a, b).
Even though synaptic plasticity is not strictly dependent on time, olfactory learning in different time periods is able to increase or decrease the BrdU cell density in the OB in the adult brain.Mouret et al. (2008) labeled adult born cells with BrdU and evaluated cell survival at different days post injection. Using the same training conditions (trained mice subjected to one week of olfactory training with a single odor nine days before perfusion) it was shown that learning increases cell survival in the bulb when learning occurs between 18 and 30 days post BrdU injection.
The elimination of adult born neurons is essential for odor exploration and discrimination, and blocking the elimination process disrupts olfactory discrimination (Mouret, et al. 2009). This elimination is modulated by memory; newborn neurons are removed from the network when the memory trace is no longer active, breaking the odor-reward association (Sultan et al, 2011). A combination of events and mechanisms may determine the survival and integration of adult born neurons. Three interrelated pathways mediate the survival of adult-born neurons: dendro-dendritic synaptic changes, top–down glutamatergic inputs originating from cortical regions and centrifugal
modulation by neuroamines and neuropeptides locally released in the OB. The increased or decreased survival of adult born neurons in the OB has distinct functional consequences.
Functional role of adult born neurons in the OB
Olfactory experience (odor enrichment and odor learning) can regulate the maturation and survival of adult-born neurons. Newborn neurons have different properties comparing to pre-existing interneurons, for example, enhanced synaptic plasticity during a critical time window (Nissant et al., 2009). Different studies have tested the hypothesis that adult neurogenesis contributes to improve the plasticity of neuronal networks.
By ablating neurogenesis, using techniques such as anti-mitotic drugs, irradiation or transgenic mouse models, it was possible to assess the functional contribution of adult neurogenesis.
Odor perception
The contribution of adult OB neurogenesis to odor detection thresholds has been examined in two recent studies. Using a sniffing attraction task that consisted of recording the time spent by a subject freely investigating an odorant, Breton-Provencher et al. (2009) reported that mice treated with Ara-C showed higher detection thresholds and thus a reduced sensitivity of their odorant perception. In contrast, Lazarini et al. (2009) did not find any impairment of odorant perception in SVZ-irradiated mice trained to detect odors during a nose poke based go/no-go odor-discrimination task.
Perceptual learning is an implicit (non associative) form of learning in which discrimination between sensory stimuli is improved by previous experience (Gilbert et al, 2001). Moreno and collaborators (2009) have shown that neurogenesis is necessary for perceptual learning by comparing animals treated with AraC to animals treated just with saline exposed to the same combination of odorants. In the AraC group, mice had a significant decrease of cell density in the GCL and no enrichment-induced improvement of discrimination that occurs in the saline group was observed.
Odor discrimination
The causal effect of adult neurogenesis on olfactory discrimination is not clear. Some studies have reported that reduced neurogenesis impairs odor discrimination (Gheusi et al. 2000; Enewere et al. 2004; Bath et al. 2008). In contrast, other studies showed that ablating neurogenesis in the OB did not interfere with odor discrimination, using similar protocols (Imayoshi et al. 2008; Breton-Provencher et al. 2009; Lazarini et al. 2009; Sultan et al. 2010).
Olfactory memory
There are some convergent experiments for the role of neurogenesis for memory. The short-term strength of the odor-cue fear-conditioned olfactory memory is dependent on adult bulbar neurogenesis (Valley et al. 2009). Long-term memory is reduced in SVZ-irradiated mice compared to controls (Lazarini et al. 2009) and it is required for long-term retention of reward-associated odors (Sultan et al. 2010).
Thus, these results provide evidence of a direct and immediate causal contribution of adult born olfactory neurons on the maintenance of the olfactory circuits and its behavioral outcomes.
Interestingly, not just olfactory stimuli are able to evoke a response in the olfactory system. Auditory-evoked responses have been recorded in the olfactory tubercule (Wesson and Wilson, 2010) but not in the OB. In addition, Cohen and collaborators (2011) have shown that response to pups’ body odor reshapes neuronal responses to pure tones and natural auditory stimuli. This olfactory-auditory interaction appeared naturally in lactating mothers shortly after parturition and was long lasting. Although auditory discrimination tests have been used to test the mice ability to discriminate between different tones, none has been used to study adult bulbar neurogenesis (Tsukano et al., 2011).
Experimental design
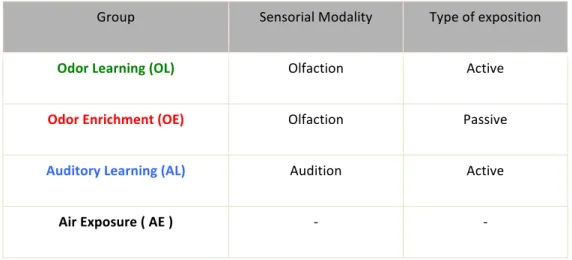
Learning is the formation of associations. During learning multiple brain areas support a large range of psychobiological processes such as selective attention, sensory processing, execution of motor responses, reward expectancy, decision making, action selection, evaluation of outcomes resulting from choices, etc. At a neurobiological level of analysis, all these processes are the source of a long list of molecular, cellular and wiring changes of the plastic nervous system that define a ‘brain learning state’. Some of these neurobiological events may non-specifically, but significantly, influence the production and/or survival of adult-born neurons. However, to date, no study has clearly examined what could be the relative contribution of the brain state associated with learning to the processes governing adult bulbar neurogenesis. In the present study we specifically addressed this question by comparing the rate of adult born neurons in the OB between animals trained in an odor discrimination learning task (OL group) and animals performing exactly the same task, except that they had to discriminate between different tones (auditory discrimination learning – AL group) instead of different odors. Four groups of mice were used in this study: a group of mice trained to discriminate between odorants (OL), a group of mice trained to discriminate between tones (AL), a group of mice passively exposed to the same odors (OE) as those used in the OL group (OL) and a group mice exposed to clean air (AE) (Table 1). Any changes observed in the OL vs AL training comparison will be likely to reflect the specific contribution of odor learning to the rate of survival of adult born neurons in the OB. Any changes observed in the number of surviving adult born neurons between the OL and OE groups will illustrate the effects of reward-driven odor conditioning vs passive odor exposure. Finally, any changes observed in the AL and AE comparison will reveal the non-specific contribution of learning to the rescue of newborn neurons from death.
Table 1. Different groups of study according to the sensorial modality and the type of exposition evolved.
By designing those experimental groups, we aimed to study how the different conditions were influencing the survival and morphology of the newborn neurons and, as a second goal, evaluate the performance of the different groups in a span capacity working memory task (Sup. Table 1).
Group Sensorial Modality Type of exposition
Odor Learning (OL) Olfaction Active
Odor Enrichment (OE) Olfaction Passive
Auditory Learning (AL) Audition Active
Material and Methods
1. Animals. We used adult male mice C57/BL6 (8 weeks old, n=60), housed under a 12h light/dark cycle at 22ºC with dry food and access to water ad libitum. During the experimental period the animals were water restricted (1ml H2O/day) or food restricted (2,5g food/day) according to the
body weight that should be about 85% of the original body-weight.
The experiments were performed in two sessions, using the same conditions of accommodation (4 animals/cage).
2. Injections BrdU injections.
5’-bromo-2’deoxyuridine (BrdU) is a halogenated thymidine analog that permanently integrated into the DNA of dividing cells during DNA synthesis in S-phase. BrdU can be immunohistochemically detected in vitro and in vivo, allowing the identification of cells that were dividing during the period of BrdU exposure. This marker was used to study neuronal survival. In particular, the type C progenitors are the main target of BrdU once they have a very fast cell cycle and they give birth to neuroblasts.
Mice were injected intraperitoneally with BrdU (75mg/kg, Sigma-Aldrich) in a solution with NaCl (0, 9%) and NaOH (0,4N). Mice received BrdU on the day before the LV injection, four injections, 2h apart (due to the length of the cell cycle).
Lentivirus injections.
To label the neuroblasts, a lentivirus-based lentiviral vector, plenty-CMV-GFP-WPRE, was used. This WPRE (woodchuck hepatitis post-transcriptional regulatory element) is an amplifying sequence (distal enhancer). This virus is non replicable and is driven by CMV which is a strong promoter. The GFP (Green Fluorescent Protein), driven by the CMV (cytomegalovirus promoter),
emits fluorescence for the entire cell. The virus was diluted 1/20 from an initial concentration of 138ng/µl of p24 (protein from the viral capsid) to a final concentration of 6,9ng/ µl of p24.
The LV injections were stereotaxic injections. They were done bilaterally in the RMS with a nanoliter injector (glass micropipette – rate of 23nl/s). The viral aliquots were stored at -80ºC and thawed before pipette loading. The microinjector (Nanoject II) was programmed for delivery of 50nl. The microinjector had to be attached onto a sterotaxic frame. The micropipette was loaded with 2µl of virus solution onto a sterile piece of Parafilm.
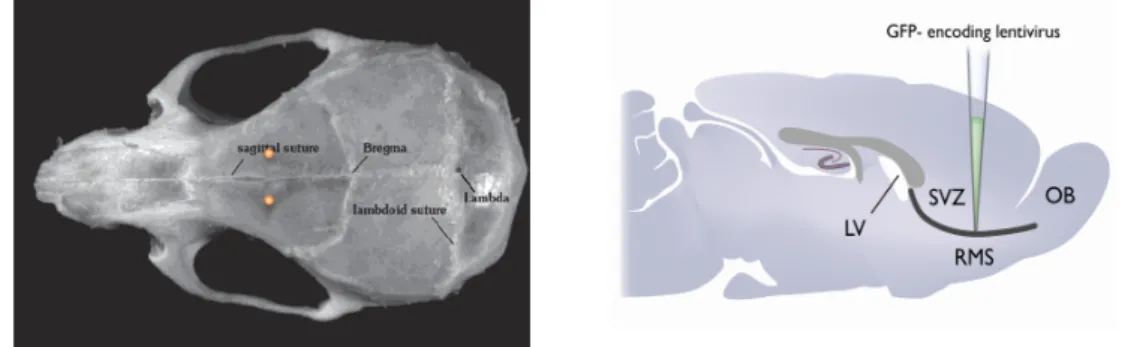
Each mouse was anesthethized with 100mg/kg Ketamine and 10mg/kg Xylazine, diluted in sterile saline. Before the injection, the hair was removed from the scalp of the animal using hair clippers and razors. All surgical instruments were autoclaved and then disinfected with 70% ethanol. The animal was placed in the stereotaxic frame with ear bars and nose bar. The eyes were hydrated with NaCl to prevent drying. With a scalpel, the scalp was cut from between the eyes to between the ears. The skin was pulled aside to expose the skull and then anchored with a pair of clamps. The surface of the skull was cleaned. The stereotaxic apparatus is zeroed with the tip of the glass pipette at bregma point. Then, the tip is positioned at the injection site (Antero-Posterior, +3.3mm; Medio-Lateral, ±0.82mm, for both right and left hemispheres, Dorso-Ventral, -2.9mm from brain surface) (Figure 4). The position of the nose bar was adjusted according to the calculation ofthe stereotaxic coordinates. In our experiment, the nose bar was adjusted until bregma and the injection site was aligned to the same height. After identifying the injection site, two holes were carefully drilled into the skull. The remnants of thin bone were removed to expose the dura mater. At this step, the pipette can be lowered and the Dorso-Ventral height set to zero when the tip of the pipette touched the surface of the brain. After lowering the pipette in the tissue to the target point, the virus were injected 4 times (50 nl of virus for a total of 200 nl) with a delay of 30s between each injection (pressure equilibrium). One minute after the last injection, the pipette was slowly
withdrawn and this procedure was repeated for the other hemisphere. At the last step, the animal was removed from the stereotaxic apparatus, the incision was cleaned and the skin stitched using surgical threads. For recovery, the animals were accommodated on a warming pad before returning to the cage and received a non-steroidal anti-inflammatory analgesic (Carprofen 4mg/kg).
Figure 4. Stereotaxic intections. On the left, representation of the coordinates of the stereotaxic injection in a mice
skull (yellow dots) and on the right, a sagittal section showing the point of injection, on the RMS (rostral migratory stream).
3. Behavioral apparatus, training, and odorants.
Six apparatuses were used to test four different conditions.
Behavioral apparatus. The OL mice were trained in computer-controlled eight-channel olfactometers (detailed description Bisulco and Slotnick, 2003). Briefly, solenoid pinch valves controlled air streams and odors were generated by passing a 50 cc/minute stream of air over the surface of mineral oil diluted odorants in disposable 50 ml centrifuge tubes. The 50 cc /minute odorant vapor from the saturator tube was mixed with 1950 cc/minute clean air before its introduction into an odor sampling tube in the mouse operant chamber.
The AL mice were trained in comparable olfactometers that were equipped with auditory stimuli generators. No odorants were released but it was installed a speaker (Farnell) for tone delivery in the cage for discrimination.
The OE mice were transported to a small cage where they were exposed to the same odorants as the OL group but they were not submitted to any learning task. The boxes were equipped with a fan so the odors were renewed every time a mouse received a different odorant (in a random order).
The AE mice were moved to a cage with the same dimensions of the one for the animals of the OE condition and no odorants were introduced. The tubes were filled with mineral oil without any odorants in solution.
Between mice, the olfactometers, the ‘audiometers’ and the boxes of enrichment were washed with 95% ethanol and air-dried. Each odorant was maintained in its own saturator tube and the liquid odorant/mineral oil solution was refreshed daily.
a) Training, odorants and tones
The odorants used and their rated purities were Anisole (99%), Cineole (98%), Linalool (97%) and β-ionone (96%), all from Sigma-Aldrich (St. Louis, MO, USA). The odorant sources were prepared in the odor saturation tubes, all the odorants were diluted on a per volume basis with odorless mineral oil to the desired concentration (10-2) for a final volume of 10 ml of solution. Odorant
concentrations are given as the liquid dilution of the odorant in the saturator tubes and the stimuli used in training were designated by the name of the odorant and its liquid dilution. The odor concentration delivered to the sampling port was 2.5% of the headspace above the liquid odorant. We did not check the odorant concentration of the headspace above the liquid solution, but gas chromatographic analyses have shown that the headspace concentrations of various hydrocarbons from mineral oil dilutions are proportional to their liquid dilution (Cometto-Muniz et al., 2003). For the auditory discrimination tasks, no odors were present in the saturators, those were replaced by tones and the delivery of the different tones was controlled by a ToneGenerator. The tones selected were 8kHz, 20kHz, 12kHz and 17kHz. The auditory discrimination tasks were run
identically to the olfactory discrimination tasks except that no odors were present in the saturators. Response requirements were exactly the same as for the olfactory tasks. Instead of the olfactory stimuli, each trial involved the presentation of a specific auditory stimulus.
The OE mice were exposed to the same odorants as the OL group.
The AE mice were exposed to air puffs of mineral oil at the same rate as the odorants for the OE group.
b) Protocol description Pre-discrimination test - shaping.
The training sessions were conducted during the light cycle between 9:00 and 20:00. The four animals housed in a same cage were belonging to a different condition. This was a way to avoid social deprivation. The mice were handled and four days later, before the shaping period, they started being partially water restricted. The amount of water given to the mice was adjusted to have at the end all the mice with 85% of their original body-weight. The animals were water restricted receiving 1ml of water/day.
In the period of shaping, firstly, mice were trained to lick on the water delivery tube to obtain a 3 μl drop of water, then they were trained for nose pokes into the odor samping port in order to get the reward in the water delivery tube. Then, obtaining a water reward became a more difficult task, mice had to keep their nose in the odor sampling port for increasing lengths of time (until 1.2s) has a condition to get the water reward. If the nose was kept in the odor port for the required amount of time, any subsequent lick by the mouse after this on the left side water tube was reinforced with 3 μl of water. An ITI of 5 seconds was imposed between trials. Once the mice reached 85% of correct responses, they started the go out discrimination test.
trials.
For the OE and AE groups the animals were just moved to the ‘box of enrichment’. Training
They were trained using an operant conditioning Go Out paradigm, as described by Slotnick B. (2007). Standard operant conditioning methods were used to train mice to insert their snouts into the odor sampling port. The presence of the positive stimulus (S+) was associated with a water reward obtained when the mouse licked the adjacent water delivery tube. In the presence of the negative stimulus (S-), the mouse received no water reward and had to refrain from licking the water tube. The first snout insertion after a 5 s intertrial interval (ITI) initiated a trial. At the beginning of the trial, the stimulus control valves and a valve directing the air stream away from the sampling tube were functional. This resulted in the odorant vapor being combined with the main air stream and the diversion of the main air stream to an exhaust path. The diversion valve relaxed 1 s later, and the odor stimulus was presented to the odor sampling port. The stimulus valves relaxed 2 s later, thus terminating the delivery of the odor. Reward delivery depended on the mouse licking the water delivery tube in the 2 s odor presentation period. Trials in which the mouse did not keep its snout in the odor sampling port for at least 1 s after odor onset, were aborted and counted as short sample trials. A 3μl water reward was delivered if the mouse satisfied the response criterion. Odor discrimination learning. In each trial, a single stimulus (S+ or S-) was presented. If the response criterion was met in S+ trials, a 3μl droplet of water was given as a reward and the trial was scored as a hit, whereas failing to meet the response criterion was scored as a miss. Meeting the response criterion in S- trials was scored as a false alarm and failing to make a criterion response was scored as a correct rejection. S+ and S- trials were presented in a modified random order, such that each block of 20 trials contained equal numbers of each type of trial and no one
type of trial was presented more than three times consecutively. The trial procedures were identical to those used in the initial pretraining sessions. The percentage of correct responses was determined for each block of 20 trials [(hits + correct rejections)/20 x 100]. Scores above 85% implied that mice had correctly learned to assign the reward value of the S+ and the non-reward value of the S-. The trained mice of the experiment had to perform two followed odor discrimination tasks with two different odorant combinations for 7 days. They were trained in discrimination tasks in which mice had to learn to discriminate between 1% Anisole and 1% Cineol solutions and then between 1% Linalool and 1% β-ionone. In those discriminations, for the two pairs of odorants, within the same group of mice, half had one of the odorants as S+ and the other half the same odorant as S-. With this procedure it was avoided any type of bias associated with the odorant that was S+.
Auditory discrimination learning. The same procedure was reproduced in this group; animals in an olfactometer were submitted in each trial to the presence of different auditory stimulus (S+ or S-) associated to a water reward, the tone was delivered every time the mouse did a nose poke in a random order and the percentage of correct responses was determined for each block of 20 trials. The first discrimination was between 8kHz and 20kHz and the second between 12kHz and 17kHz, again, different mice of the same group had different tones associated to S+ and S-, the auditory and odor discrimination tasks occurred in the same period of time, 7 days each.
Odor enrichment. The mice of this group stand on a box of enrichment during the same approximated period as the animals of the learning groups. In those boxes, the odor is delivered during 2 seconds and then a fan is activated to remove the odorant. Five seconds after, a new odorant is introduced. According to this protocol, all the mice of this group were submitted to the
same odorants in a random order, as in the odor learning group, but no procedure of instrumental learning occurred. They received 200 exposures (100 for each odorant) during each daily session. Air exposure. The protocol of odor enrichment was reproduced for the air exposure group. Water restricted animals which had to stay during approximately 40 min in a box of enrichment were submitted to the same conditions but without being exposed to any odorant, just mineral oil. 4. Brain fixation and slices preparation. Mice were deeply anesthetized with an intraperitoneal
injection of sodium pentobarbital (100 mg/kg, Sanofi). They should be totally immobilized before starting the transcardiac perfusion. Brains were dissected out after transcardiac perfusion (on the left ventricle) with 0.9% NaCl at 37ºC during 5 min followed by a solution of paraformaldehyde (PFA, 4% in a 0,1M phosphate buffer, pH=7,4) to fix the tissue, this takes approximately 15min with a flux of 10ml/min. After dissection, brains were stored at 4°C in 4% PFA overnight, and then transferred to phosphate buffer saline (PBS) containing 0.2% sodium azide. Forty-micron thick coronal sections were cut using a vibrating microtome (VT1000S, Leica).
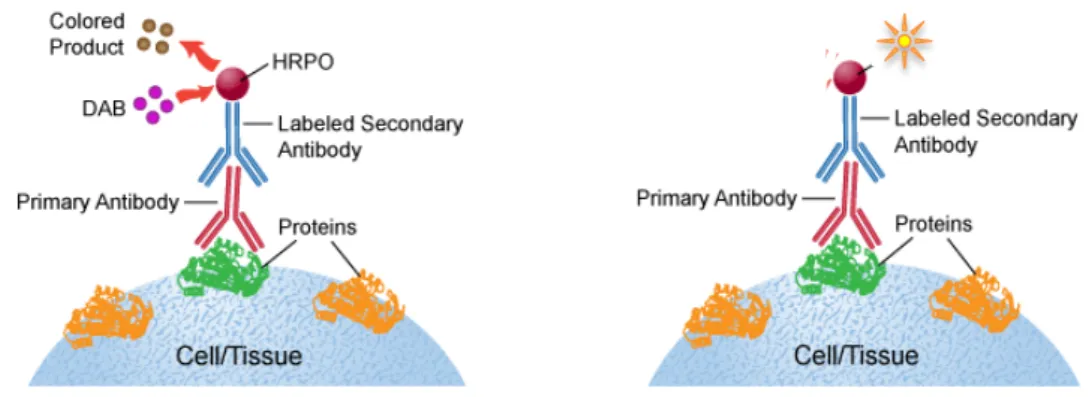
5. Immunohistochemistry. Immunostaining was performed on 40 µm coronal free-floating sections, and slices processed for BrdU-GFP, GFP and for BrdU-DAB (Figure 5).
BrdU/GFP immunohistochemistry in free-floating slices. BrdU and GFP immunohistochemistry were performed sequentially. All the steps were done in a shaker to allow soft movements to the slices, at room temperature and non-directly exposed to light. The first step consists of DNA denaturation by 30min incubation with HCl 2N solution at 37°C. After rinsing with PBS, we performed permeabilization of the slices and blocking the non-specific antigenic sites. The slices were floating in a solution of PBS Triton X-100 at 0,2% with a 10% goat serum (blocking solution). The slices were in this medium during 1h. Following this step, the primary antibodies were added. For this purpose, the slices were immersed into a solution of PBS
Triton 0,2% with goat serum 2%, a 4‰ polyclonal antibody solution of rat antibodies anti-BrdU (1:200; Oxford Biotech, Kidlington, UK) during two days at 4°C. After incubation, the slices were washed three times with PBS during 10 minutes. The third step consists of adding the secondary antibodies. The slices were immersed in a solution of PBS Triton (0,2%) with goat serum at 5% containing polyclonal A568-conjugated Goat anti-Rat (1:1000, Mol Probes). After a 2h period of incubation, they were washed with PBS 3 times during 10 min. After BrdU labeling, the slices were processed with the same protocol for GFP labeling using a polyclonal Chicken anti-GFP (1:1000, Invitrogen) and A488-conjugated goat anti-chicken (1:1000, Mol Probes). The slices were then incubated for 5min in a DAPI solution (4',6-diamidino- 2-phenylindole; 1:5000) in PBS. At a final step, the slices were washed in PBS one time during 10min.
Slices were mounted between slide and the coverslip within a mounting medium (Mowiol). Those slices were left drying in a slide until they change their color to translucid. The slides were kept at 4ºC avoiding direct contact with light.
GFP immunohistochemistry. GFP immunohistochemistry was performed as mentioned above with omission of the DNA denaturation treatment. The primary antibody was Chicken Anti-GFP (1:1000; Invitrogen) and the secondary antibody was Goat Anti-rabbit Alexa488 (Molecular Probes) (1/1000).
BrdU/DAB immunohistochemistry. For BrDU revelation with DAB, slices were processed as mentioned above for BrdU immunohistochemistry until the secondary antibody step. Following 3 rinses in PBS (1x), slices were incubated with biotin-conjugated goat anti-rat (1:1000; Chemicon) in PBS Triton 0.2% containing 5% Normal Goat Serum during 2 hours at room temperature. After 3 rinses in PBS (1x), the ABC complex (avidine-biotine-peroxydase, VECTASTAIN Elite ABC kit, Vector) was added and the slices were in this solution during one hour. After three new rinses in
PBS (1x) the revelation was done with DAB (a solution which as a chromogene which is oxidated by the peroxydase to produce a dark brown agregate) followed by three rinses in PBS (1x). The slices were mounted in slides and then they were left without coverslip until they were dry. Under the hood, the slices were dehydrated by followed immersion in different ethanol solution (70 %, 80 % and two times at 100 % during two minutes) and then they were immersed three times in a Xylene medium (30 seconds each). The slides were finally mounted with a hydrophobe mounting medium (DEPEX) and covered with a coverslip.
Figure 5. Immunohistochemistry using two different techniques. On the left, BrdU/DAB and on the right,
immunohistochemistry with fluorescence, used for GFP and for BrdU.
6. Image acquisition.
For light microscopy (BrdU/DAB staining), it was used a 20x objective to reconstruct images of each section (Compix Imaging; Hamamatsu Photonics).
For the acquisition of fluorescence images, for BrdU/GFP staining, a microscope was used (Zeiss, Germany) equipped with an Apotome. An oil objective of 25x was used to reconstruct images of each section, Z-sectioning was performed at 5μm intervals; those optical sections were fused to generate the final image. The light time of exposure was 50ms for GFP and 200ms for BrdU. For the reconstruction of the different Z-sectioned layers and for final light adjustments, we used Axovision 4.6 software.
For the acquisition of the fluorescence images for GFP staining, we used a confocal microscope (Zeiss, Germany) equipped with the Zen software (Zeiss). The objective used was of 20x for the cell analysis and for spines analysis a 40x oil objective. The parameters were adapted for each slice.
7. Image analysis.
To all the images analyzed was attributed a code which was just revealed at the time of the statistic analysis.
Analysis of BrdU/DAB labeled cells. For counting of BrdU+ cells, it was used a dedicated computer program using a B3 wavelet filtering approach (Quia, de Chaumont et al., 2008). The method enhances spots (corresponding to BrdU+ cells) while filtering out the background. For each animal, counts were made for one in every three coronal sections of the same bulb (120 µm apart, 10-14 slices per animals). Anatomical landmarks within the OB were used to align coronal sections across animals. The rostral landmark, defining the origin of the rostrocaudal axis, contained the first clear mitral cell and external plexiform layers. The accessory olfactory bulb (AOB) was used as the caudal landmark and the last section counted contained the first, clear AOB. The internal and external borders of the GL, EPL, GCL and the border of the rostral migratory stream of the OB (RMSOB) were outlined on the same image. The program then numbered cells detected in the GL,
EPL and GCL. Values were given as BrdU+ cell density (number of positive cells per mm2). The
same counting criteria were applied for all the light microscopy images of BrdU/DAB labeled cells. Analysis of BrdU/GFP labeled cells. BrdU and GFP positive cells were counted automatically using the same software (Quia, de Chaumont et al., 2008). For each animal, counts were made for one in every three coronal sections of the OB (120 µm apart) using the same program and procedure
as for BrdU/DAB labeled cells. The program counted the cells detected in the various layers, the same counting criteria were used for all the fluorescence images.
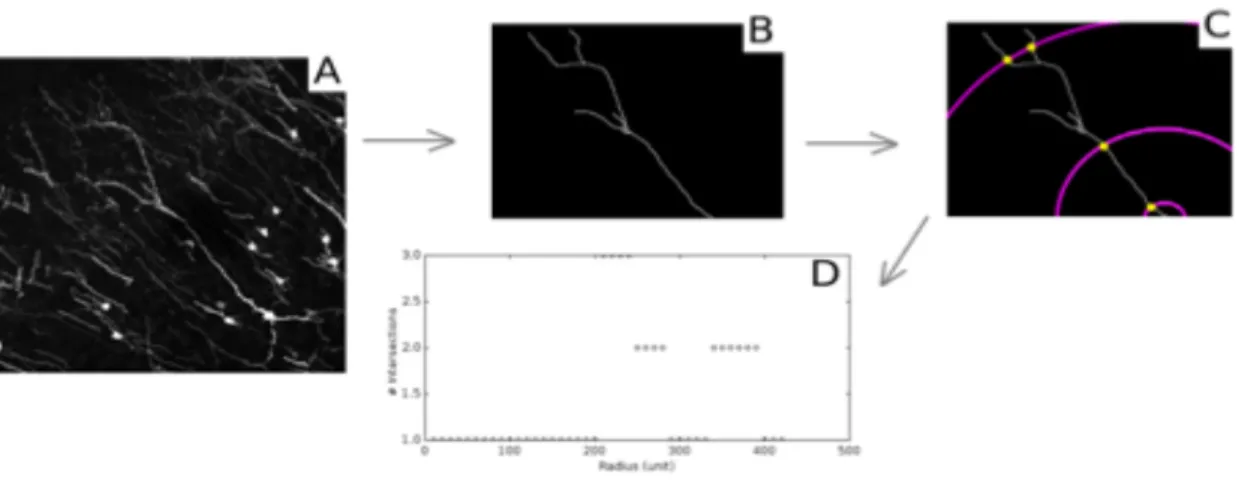
Analysis of GFP labeled cells. The pictures that were taken of the granule cells (n = 5-10 per animal) at the confocal microscope were used for morphological analysis of the granule cells. For this purpose, we used ImageJ software with two plugins, NeuronJ and Advanced Sholl Analysis. NeuronJ gave us the possibility to analyze different parameters such as the main dendrite length (from the soma to the first branch point), total dendritic length and number of branch points. After tracing the dendritic tree, from the soma to the most distal branch of the main dendrite, we did a Sholl analysis to analyze the complexity of the dendritic tree. Using the scale of 10µm, the software draws, for each circle, concentric circles starting in the soma and calculates the number of crossings between branches. The result gives us the number of branches in function of the distance from the soma (Figure 6). Those tools allow us to visualize the configuration of the dendritic tree and the level of complexity.
Figure 6. Sholl analysis methodology. A. Confocal picture of the granule cell for analysis; B. Traces of the GC. C. The
software draws concentric circles to count the number of intersections of the tracing for each of the concentric circle starting from the soma. D. The data then is transferred for a graphic.
independence of distributions between conditions (OL, AL, OE, AE), a Kruskal-Wallis test (non-parametric ANOVA) was performed. We thus tested for each layer (GCL, EPL, GL), the following parameters: surface area, density of BrdU/DAB + cells, density of GFP+ cells, density of BrdU+ cells, percentage of colocalization/number of BrdU+ cells, percentage of colocalization/ number of GFP+ cells and percentage of colocalization given the total number of immunostained cells. When the test indicated a significant difference, the value of the decision variable were reported in the corresponding graph of the form: H ([number of samples] -1, N = [size of all samples]) = [value of the decision variable], p = probability associated. We then tested two by two population distributions within each condition with a post-hoc test - Wilcoxon-Mann-Whitney.
The same approach was applied to the results of morphology: proximal dendrite length, total length of the dendritic tree and the number of branch points. For the Scholl analysis, it was done a two-factor ANOVA (condition as independent variable and distance as a dependent variable) to analyze the effect of the two factors, conditions and radius of the circle for the different means.
The statistical analysis was performed in all cases for the four conditions of training (OL, AL, OE and AE) not taking into consideration mice from behavioral session 1 and 2 separately. Data were expressed as mean values ± SEM.
Time course of the behaviour experiments
The behavioural experiments were performed in two sessions due to the high number of mice belonging to each condition; the following steps were executed in the exact same way and the time course of the experiments was reproducible between sessions.
At the beginning of the experiments, the mice were aged 8 weeks. Two days after the arrival of the mice in the animal facility, all mice were injected with BrdU to label the dividing cells in the SVZ. On the following day, half of the mice (the mice used for cell survival and morphological studies) were injected with the lentivirus GFP in the RMS to label the neuroblasts in migration to the OB. One day is approximately the time necessary for the cells coming from the SVZ arrive into the RMS (Petreanu & Alvarez-Buylla, 2002, Carleton et al., 2003). Therefore, this delay between BrdU and LV injections was important to make sure we labelled the same neuronal population.
After three days of recovery from the surgery, the mice were moved to the behaviour animal facility where they were marked with a different tail colour according to the condition. Within a cage there was one animal of each condition, OL, AL, OE and AE. Those animals were handled during two days. Thirteen days after BrdU injection, mice started the behavioural interventions. The first five days corresponded to the shaping period (essential to habituate the mice to the new apparatus and the rules of the tasks they had to execute). Afterwards, they started the first discrimination (Anisol vs Cineol, OL group and 8kHz vs 20kHz, AL group) and then the second discrimination (Linalool vs β-ionone, OL group and 12khz vs 17khz, AL group), each discrimination task occurred during seven days. Simultaneously, OE mice were exposed on the first 7 days to Anisol and Cineol and
then the last 7 days to Linalool and β-ionone while the AE mice were exposed to clean air during the 14 days. Two days after the behavioural conditioning, 34 days post injection (dpi) of BrdU, half of the mice were isolated in different cages with water ad libitum to recover to the original body weight for a working memory test and the other half were perfused. After perfusing, slicing and sorting, the immunohistochemistry was done, the slices were kept on the fridge and once we had the slices of both sessions, we did the acquisition of the pictures and the counting for the slices immunolabelled with DAB (BrdU+) and the ones with immunofluorescence for BrdU+ and GFP+. For morphological analysis we used slices GFP+ (due to the BrdU+ treatment, the slices BrdU+
GFP+ were not used for morphology).
Results
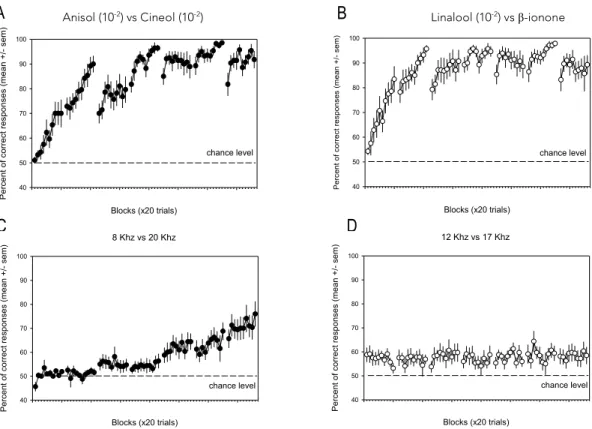
The mice of the four conditions, OL, AL, OE and AE were submitted to different training conditions during the same period. On the first discrimination task, the mice of the Odor Learning group had to discriminate between Anisol and Cineol and after two days they reached a performance of 95% of correct responses. For the AL group, the mice had to discriminate between 8kHz and 20kHz, but in contrast to the OL group, they couldn’t discriminate after two days, the best performance was only achieved at the last day of training - 75% of correct responses (Figure 7), as reported in others studies (e.g. Bathelier et al., 2012).
For the second discrimination task, we expected to see a better performance for OL and AL once they were already habituated to the test (Slotnick BM and Katz H, 1974; Slotnick BM et al., 2000). However, even though the OL group easily distinguished between those two odorants after two days of training, reaching 95% of performance, the AL mice were slower and in fact there was almost no progress in the performance achieved. After 7 days, the percentage of correct responses was about 60%.
Figure 7: Performance of the mice of the groups OL (Odor Learning, n=14) and AL (Auditory Learning, n=16) in
session 1 and 2. Each dot corresponds to the mean +/- sem of all the mice in that block (20 trials), to remind 10 blocks were performed within a day. The dashed line represents chance level (50%). A. First odor discrimination task of the OL group, Anisol (10 -2 ) vs Cineol(10 -2 ) . B. Second discrimination task of the OL group, Linalool (10-2) vs β-ionone
(10 -2 ). C. First auditory discrimination task of the AL group, 8kHz vs 20kHz. D. Second discrimination task of the AL
group, 12kHz vs 17kHz.
From the mice of the AL and OL group, we repeated the analysis just for the OL and AL cohort of mice used to study cell survival and morphology. The performances obtained for this cohort of mice in the first and the second discrimination for OL and AL conditions were similar (Sup. Fig. 1). The main purpose of this project was to study how learning affects neurogenesis. To evaluate it, it was necessary to count the number of cells within different conditions. As we labelled with different cell markers, we did the counting for BrdU and for GFP. For BrdU, we counted in two different ways, according to the immunohistochemistry we did on the slices (Figure 8).
D C Anisol (10 ) vs Cineol (10) Blocks (x20 trials) P e rc e n t o f co rr e ct re sp o n se s ( m e a n +/ - se m ) 40 50 60 70 80 90 100 Linalool (10) vs b-damascenone (10 ) Blocks (x20 trials) P erc en t of c orr ec t res po ns es (m ea n +/ - sem ) 40 50 60 70 80 90 100 8 Khz vs 20 Khz Blocks (x20 trials) P e rc e n t o f co rr e ct re sp o n se s ( m e a n +/ - se m ) 40 50 60 70 80 90 100 12 Khz vs 17 Khz Blocks (x20 trials) P e rc e n t o f co rr e ct re sp o n se s ( m e a n +/ - se m ) 40 50 60 70 80 90 100
chance level chance level
chance level chance level
Anisol (10-2) vs Cineol (10-2) Blocks (x20 trials) P e rc e n t o f co rr e ct re sp o n se s ( m e a n +/ - se m ) 40 50 60 70 80 90 100 Linalool (10-2) vs b-damascenone (10-2) Blocks (x20 trials) P erc en t of c orr ec t res po ns es (m ea n +/ - sem ) 40 50 60 70 80 90 100 8 Khz vs 20 Khz Blocks (x20 trials) P e rc e n t o f co rr e ct re sp o n se s ( m e a n +/ - se m ) 40 50 60 70 80 90 100 12 Khz vs 17 Khz Blocks (x20 trials) P e rc e n t o f co rr e ct re sp o n se s ( m e a n +/ - se m ) 40 50 60 70 80 90 100
chance level chance level
chance level chance level
Anisol (10-2) vs Cineol (10-2) Linalool (10-2) vs β-ionone
(10-2)
A B
Figure 8: Representative images of 40μm coronal sections of the OB with the GL, EPL, GCL, RMS and AOB
delineated for cell counting with QUIA. A. Slice treated with immunofluorescence for BrdU+(red) and GFP+(green) cell
counting. B. Slice treated for BrdU/DAB for BrdU counting. BrdU positive cells
- Olfactory discrimination learning does not crucially regulate survival of adult born neurons in the OB.
Eighteen days before the period of training the mice were injected with BrdU. By quantifying BrdU+
cells in the OB, we investigated whether adult neurogenesis might be affected by this training using the same software for counting and analyzing the three layers, the GL, EPL and GCL (not the RMS). Even though previous studies have shown that in this period the cell survival is increased (Mouret et al. 2008), the difference in the cell density within different layers is not significant between conditions. However, as already reported (Alonso et al. 2006), the cell density within the granule cell layer is significantly higher when compared to other layers.
The cell density of BrdU +cells between conditions was around 180 cells/mm2 (average of the four
conditions in the GCL) and the different sensory experiences did not affect neuronal survival. Thus, there was no significant difference in the BrdU+ cell density between groups (Figure 9), for the GCL (H (3,28) =1,80; p=0,614), for the EPL (H (3,28)=0,42; p=0,936) and for the GL (H
GL EPL GCL RMS+AOB
(3,28)=0,90;p=0,824).
Figure 9: Graphics expressing the results of the counting of cells BrdU+ resulting from immunohistochemistry with
DAB. In each graphic, the four conditions were separated and for each, it is indicated the mean (+- SEM) density (nº of cells/mm2) of BrdU+ cells. A. Density of BrdU+ cells by condition in the Granule Cell Layer (GCL). B. Density of BrdU+
cells by condition in the External Plexiform Layer (EPL). C. Density of BrdU+ cells by condition in the Glomerular cell layer(GL).
Those results were in contrast with previous publications (Mouret et al., 2008; Alonso et al., 2006; Moreno et al., 2012). The similar results between conditions in the three layers were not just observed with DAB, it was also confirmed when the slices were counted using a different treatment - BrdU+ fluorescence, indeed, the density of BrdU+ cells were similar between techniques (Figure 10).
Figure 10: Graphics expressing the results of the counting of cells BrdU+ resulting from immunofluorescence. In each
graphic, the four conditions were separated and for each, it is indicated the mean (+- SEM) density (nº of cells/mm2) of
BrdU+ cells. A. Density of BrdU+ cells by condition in the Granule Cell Layer (GCL). B. Density of BrdU+ cells by condition in the External Plexiform Layer (EPL). C. Density of BrdU+ cells by condition in the Glomerular Cell Layer (GL).
GFP positivecells
- The survival of adult born neurons is differentially regulated by different sensory
experience.
A B C
B