CHAPTER
3
*Independent and opposite associations of hip and waist circumference
with metabolic syndrome components, inflammatory and
atherothrombotic risk factors in overweight and obese women
Paulo M. Rocha, José T. Barata, Pedro J. Teixeira, Robert Ross and Luís B. Sardinha (PMR,
JTB, PJT, LBS) from the Exercise and Health Laboratory, Faculty of Human Movement,
Technical University of Lisbon, Portugal; (RR) from the School of Physical and Health
Education, Queen’s University, Kingston, Ontario, Canada
Supports and grants:
This research was supported by the Portuguese Foundation for Science and Technology
grant (Sapiens 358007/99). The Oeiras City Council, Becel Portugal, Roche Pharmaceuticals
Portugal, and Compal Portugal have also contributed with small grants.
Correspondence author:
Luis Bettencourt Sardinha, PhD
Exercise and Health Laboratory, Faculty of Human Movement,
Technical University of Lisbon, Estrada da Costa,
1495-688 Cruz-Quebrada, Portugal,
Tel: +351 21 414 91 92, Fax: +351 21 414 91 93, lsardinha@fmh.utl.pt
Running title: Hip and waist circumference and metabolic syndrome
Disclaimers:
The authors have no conflicts of interest to report in this research.
*Rocha, P.M., Barata, J.T., Teixeira, P.J., Ross, R. & Sardinha, L.B. (2007). Independent
components, inflammatory and atherothrombotic risk factors in overweight and obese
women. Submitted.
ABSTRACT
Recent studies have shown independent and opposite associations of hip circumference (HC)
and waist circumference (WC) with glucose intolerance, insulin resistance (IR), and type 2
diabetes mellitus. However, no studies have simultaneously considered the independent
contributions of both markers to metabolic proinflammatory and atherosclerotic risk factors.
In this study we investigated the independent associations of WC and HC with metabolic
syndrome, pro-inflammatory and atherothrombotic features. Independent associations of
thigh adipose and muscle tissue compartments with metabolic features were also examined.
Abdominal and thigh adipose and muscle tissue distribution were assessed by computed
tomography in 140 overweight and obese women. Blood lipids, inflammatory and
atherothrombotic markers were also measured. For a given, a larger HC was inversely
associated with fasting insulin, plasminogen activator inhibitor-1 (PA1-1), and hemoglobin
A1c (Hb A1c) concentrations. Contrarily, WC was associated with an unfavourable
metabolic profile. For a given WC, higher TTAT and TTSAT mass were associated with
lower Hb A1c concentrations and LDL-C/HDL-C ratio. Additionally, TTAT was inversely
related with leptin, revealing TTSAT opposite associations with insulin and HDL-C
concentrations. TTMT was related with lower PAI-1 and fibrinogen concentrations. In
conclusion, HC revealed independent and opposite associations with IR markers and
atherothrombotic disturbances. Contrarily, WC was related with a higher metabolic risk.
These contrasting effects in diabetogenic and atherothrombotic risk factors were,
respectively, mediated by gluteofemoral adipose tissue and thigh muscle tissue. In addition
to BMI and WC screening relevance, HC can contribute to additionally predict health risk in
Keywords: Waist circumference, hip circumference, metabolic syndrome, proinflammatory
INTRODUCTION
Central and peripheral fat accumulation defines two different phenotypes of body
composition. When trunk fatness is taken into account, fat accumulation within the hips and
legs independently protect against impaired glucose metabolism (1-5), and development of
type 2 diabetes mellitus (DM) (1,6,7) and cardiovascular disease (CVD) related mortality
(7-9). Additionally, it was recently observed, both in a cross-sectional and prospective
follow-up studies, that a greater fat deposition in the legs protects against insulin resistance (IR) and
aortic calcification (10,11). Most population studies employ waist circumference (WC) to
determine health risk because it is a well-established marker of several metabolic syndrome
outcomes and CVD such as coronary artery disease (CAD) (12,13).
On the other hand, for a given WC, age and body mass index (BMI), a larger hip
circumference (HC) is associated with enhanced glucose tolerance (2,4), better blood lipid
profile, lower incidence of some CVD endpoints (8,9) as well as type 2 DM risk (1,2). These
associations seem to be present not only in Caucasian individuals but are also present across
different ethnic groups (14,15). Regarding the independent and opposite associations and the
potential protective role of a larger HC, if WC is taking into account, it has been suggested
that both thigh adipose and muscle tissue seem to contribute to the decreased risk observed
(1,14).
Additionally, it has been proposed that both anthropometric markers may play
different metabolic roles (4). Previous studies that have investigated the independent
associations of central and peripheral fat mass or WC and HC with glucose intolerance (1-5),
type 2 DM (1,2,14), CVD, and atherogenic risk profile (10-12) and mortality (9,11), have
employed measuring techniques that do not allow separate quantification of trunk visceral
and subcutaneous fat as well as thigh subcutaneous and intermuscular adipose tissue (AT).
to health-related effects are based in large measure on fat mass determination using
dual-energy X-ray absorptiometry (DXA), which is unable to distinguish different abdominal and
thigh AT and muscle compartments. However, evidence using advanced imagiologic
methods, such as computed tomography and magnetic resonance imaging has been
suggesting that these body composition compartments are differentially related with
metabolic disturbances and thus, with health risk (16).
In this context, we investigated the independent associations of WC and HC to
metabolic syndrome features, and proinflammatory and atherothrombotic disturbances, in a
large sample of overweight and obese premenopausal women. Furthermore, we also
examined the relevance of each thigh adipose and muscle tissue compartments to the
selected metabolic syndrome risk factors.
SUBJECTS AND METHODS
Subjects
The participants in this investigation were recruited from the community for a 2-year
weight loss program as previously described (17). The study population included 140
Caucasian sedentary women. Inclusion criteria required that the subjects were older than 24
years, had a BMI greater than 24.9 kg/m2, were pre-menopausal, not currently pregnant, not
under medication that affected weight or body composition, no history of cancer in the last
five years, and no clinical evidence of liver disease. Diabetes mellitus was also an exclusion
criterion as well as hormonal dysfunction, Cushing syndrome, hypertension, CVD, stroke,
CHD, and resting and exercise electrocardiograms abnormalities. Subjects taking oral
medication to treat hyperglycemia, hypercholesterolemia, or hypertriacylglycerolemia were
also excluded. All volunteers were informed about the research design and gave written
Declaration and was approved by the Human Subjects Institutional Review Board of the
Faculty of Human Movement, Technical University of Lisbon.
Body composition assessments
Anthropometric variables.
Body mass was measured to the nearest 0.01 kg on a calibrated scale after removing
shoes and heavy clothing. Height was measured to the nearest 0.1 cm with a stadiometer
(Seca, Hamburg, Germany). WC and HC measurements were taken using standard
procedures (18). BMI was calculated as weight divided by height squared (kg/m2).
Measurement of thigh adipose tissue distribution.
Cross-sectional computed tomography (CT) (Siemens, Somaton Plus) thigh images
were obtained using standard procedures described elsewhere (19). All images were obtained
using 120kV, 480 mA, 512 × 512 matrix with a 48-cm field of view. With the subjects
supine and arms extended above their head, contiguous 7-mm-thick cross-sectional images
of both legs were obtained between the inferior ischial tuberosity and the superior border of
the patella. Several compartments of thigh adipose tissue (total, subcutaneous, and subfascia
lata) and muscle tissue cross-sectional areas were measured.
The tissue volume (cm3) identified in each image was calculated by multiplying the
tissue area (cm2) by the image thickness (7 mm). Thigh adipose tissue volume (litters) were
converted to mass units (kilograms) by multiplying the volume by the assumed constant fat
density (0.92 kg/L) (20). Total thigh muscle mass was also obtained multiplying volume (L)
by the constant density assumed for adipose tissue-free skeletal muscle (1.04 kg/L) (20).
A 7-mm cross-sectional image of both mid-thighs, located at the mid-point distance
between the anthropometric markers previously described, was selected from the thigh scans
Abdominal adipose tissue distribution.
Abdominal adipose tissue was determined by acquisition of a single axial image at
the L4-L5 inter-vertebral space (19,21). Total abdominal adipose tissue (TAAT), visceral
adipose tissue (VAT), abdominal subcutaneous adipose tissue (Ab SAT) and superficial and
deep subcutaneous adipose tissue areas were measured. The boundary between visceral and
subcutaneous AT was defined using the abdominal and oblique wall muscles in continuity
with the deep fascia of the paraspinal muscles and the anterior aspect of the vertebral body
(22).
Measurement reliability.
The reliability for both thigh and abdominal body composition compartments was
calculated in 30 women, with intra-observer analyses performed on same images separated
by 3 months. The same technician made all segmentation measurements, thus only
intra-observer error was calculated. Regarding mid-thigh adipose tissue, subfascial adipose tissue
(SFAT) and mid-thigh muscular tissue, the intra-observer coefficient of variation (CV) were,
0.4%, 2.5% and 0.1%, respectively.
The intra-observer CV for TAAT was 0.7% and 0.9% for VAT. For Ab SAT,
superficial and deep Ab SAT the intra-observer CV were, 0.8%, 3.1% and 2.8%,
respectively.
Image analysis.
Once obtained CT data was analyzed (Slice-O-matic, Version 4.2, Tomovision,
Montreal, Canada) based on image morphology. A combination of edge detection filters and
watershed techniques was employed (23). Tissue segmentation was computed using standard
Hounsfield units (HU) ranges: -190 to –30 HU for adipose tissue and -29 to +150 HU for
skeletal muscle (23). Thigh fascia lata was used to subdivide the subcutaneous adipose tissue
Blood analysis
Venous blood samples were collected at the antecubital vein, after a 12-hour
overnight fast. Total cholesterol (TC), high-density lipoprotein cholesterol (HDL-C),
low-density lipoprotein cholesterol (LDL-C), triglycerides (TG) and uric acid were measured by
enzymatic colorimetric methods. Insulin was determined by electrochemiluminescence
immunoassay (ECLIA), interleukin-6 (IL-6) by chemiluminescence immunoassay and
glycemia was assessed by a hexoquinase method.
Plasma apolipoprotein A1 (apo A1), apolipoprotein B100 (apo B100) and C-reactive
protein (CRP) concentrations were measured by a high-sensitivity particle-enhanced
turbidimetric assay. Tumor necrosis factor-alpha (TNF-α) was measured using a
high-sensitivity enzyme-linked immunosorbent assay (ELISA) principle. Plasminogen activator
inhibitor-1 (PAI-1) was measured in iced citrated plasma using the Coatest PAI method
(enzyme immuno assay - EIA) and fibrinogen was measured by clotting time. Hemoglobin
A(1c) (Hb A1c) was determined by high-pressure liquid chromatography (HPLC).
Adiponectin, leptin, and urinary cortisol were measured by radioimmunoassay (RIA).
Blood pressure
Diastolic and systolic blood pressures were measured in seated position after at least
5-minute rest with a Dinamap semiautomatic oscillometric recorder (Dinamap, Critikon,
Tampa, FL). A suitable cuff size was applied to the participant’s upper arm, at the heart
level. The mean of three measurements in each arm was calculated.
Statistical analysis
Data are presented as mean ± SD, unless otherwise is indicated. Normality and
transformation was used to normalize distributions when necessary. Pearson correlation
coefficients between both waist and hip circumference and metabolic syndrome features
studied were calculated. Multiple linear regressions, adjusted for age and BMI, were
performed to study the independent associations of continuous HC and WC with major
metabolic syndrome components, proinflammatory and atherothrombotic metabolic
disturbances (all entered as continuous variables). Independent contributions of WC and HC
to abdominal and thigh body composition compartments, adjusted for age and BMI, were
also studied. Further multiple linear regressions were developed to examine the associations
of each thigh body composition compartment with metabolic syndrome features,
independently of age, BMI, and WC.
Standardized beta values are presented for direct comparisons of the multiple linear
regression models results. Multicolinearity was studied by statistic tolerance, which
determines how much the independent variables are linearly related to each another. The
tolerance is calculated as 1-R2 for an independent variable when it is predicted by the other
independent variables already included in the model. If tolerance is inferior to 0.1, the
stability of the regression model is disturbed by multicolinearity. Statistical significance was
set as p<0.05. All statistical analyses were performed using SPSS version 12.0 (SPSS,
Chicago, IL, USA).
RESULTS
The body composition and metabolic syndrome characteristics of the study
population are presented in Table 1 and Table 2. Despite some variation in the degree of
obesity (25<BMI≤45 kg/m2), the majority of the sample was obese, with an average BMI of
Table 1. Characteristics of the study population (n=140)
mean±SD Range
Anthropometric data
Age, y 38.3±0.5 25.0-49.0
Weight, kg 78.1±1.0 59.1-107.8
BMI, kg/m2 30.4±0.3 25.1-45.2
WC, cm 87.2±0.8 71.1-123.4
HC, cm 111.4±0.7 94.7-134.6
Abdominal adipose tissue
TAAT, cm2 470.9±12.1 211.9-910.8
VAT, cm2 111.3±4.3 24.9-266.8
Ab SAT, cm2 353.6±9.1 145.0-633.4
Thigh Compartments
Thigh AT, cm2 270.7±6.9 132.9-509.1
Thigh SAT, cm2 261.6±6.8 129.4-501.6
Thigh SFAT, cm2 3.5±0.2 1.0-11.9
Muscle area, cm2 234.3±2.6 176.3-324.7
TTAT mass, kg 8.4±2.1 4.0-14.8
TTSAT mass, kg 7.9±2.1 3.8-14.0
TTSFAT mass, kg 0.6±0.2 0.3-1.5
TTMT mass, kg 6.1±0.9 4.4-10.3
Table 2. Metabolic syndrome characteristics of the study population (n=140)
mean±SD Range
Triacylglycerols, mg/dL 101.48±4.86 32.00-329.0
Fasting insulin, µIU/mL 8.22±0.32 2.40-17.9
Fasting glycemia, mg/dL 89.48±0.65 73.00-113.0
Total cholesterol, mg/dL 194.74±3.86 101.00-307.0
HDL cholesterol, mg/dL 54.09±1.05 29.00-91.0
LDL cholesterol, mg/dL 123.50±3.54 45.00-255.0
TC/HDL-C ratio 3.74±1.11 2.04-9.55
LDL-C/HDL-C ratio 2.38±0.08 0.94-6.13
Apo A1, mg/dL 139.05±2.33 77.00-195.0
Apo B100, mg/dL 86.68±2.43 38.00-156.0
Apo A1/Apo B100 ratio 1.74±0.05 0.78-3.31
Systolic BP, mmHg 1 20.65±1.43 90.00-175.0
Diastolic BP, mmHg 75.83±0.93 50.00-101.0
CRP, mg/dL 0.45±0.03 0.03-1.14
IL-6, pg/mL 10.32±0.56 0.80-31.5
TNF-α, pg/mL 3.87±0.23 0.90-14.1
PAI-1, ng/mL 21.18±2.01 1.00-100.0
Fibrinogen, mg/dL 369.38±6.48 201.00-552.0
Adiponectin, ng/mL 9.18±6.44 2.93-41.0
Hb A1c, % 4.87±0.04 4.00-7.0
Cortisol, ug/day 41.04±1.69 6.00-105.0
Uric acid, mg/dL 4.39±0.97 2.40-8.5
Leptin, ng/mL 32.92±43.33 0.90-167.4
Subcutaneous adipose tissue was the major constituent of both abdominal and thigh
adipose tissue area (75.1% and 93.9%, respectively) while visceral adipose tissue
represented 23.6% of abdominal adipose tissue area. On the other hand, total thigh adipose
tissue mass represented ~57.9% of the total thigh mass. In our sample, 9.3% of the women
met the ATP III criteria for metabolic syndrome (24).
In bivariate models, WC showed positive associations with several metabolic
syndrome features, while HC was positively correlated with PAI-1 and systolic BP (data not
shown). However, after adjustment for each other, WC and HC revealed opposite
associations with risk factors, being elevations in HC associated with improvements
metabolic profile, whereas elevations in WC were related to metabolic deterioration.
The results of simultaneously adding waist and hip circumference, adjusting for age
and BMI, to predict metabolic syndrome components, and proinflammatory and
atherothrombotic risk factors for CVDare shown in Table 3. A large WC was associated
with increased TG, fasting glycemia, apo A1 and PAI-1 concentrations, as well as with a
higher TC/HDL-C ratio. Additionally, a larger WC was inversely related with and lower
concentrations of HDL-C, IL-6, and leptin.
On the contrary, for a given WC, a large HC was inversely associated with fasting
insulin, Hb A1c and PAI-1concentrations. The explained variance for each metabolic risk
Table 3. Independent contributions (standardized beta coefficients) of waist and hip circumference to metabolic syndrome components, adjusted for age and BMI.
Waist
Circumference
Hip
Circumference
Percentage
of variance
explained**(%)
Triacylglycerols, mg/dL 0.337* -0.062 17.3#
Fasting insulin, µIU/mL 0.125 -0.288† 24.5#
Fasting glycemia, mg/dL 0.490‡ -0.067 16.3#
TC/HDL-C ratio 0.347* -0.149 19.0#
LDL-C/HDL-C ratio 0.267 -0.215 15.4#
Apo A1/Apo B100 ratio -0.137 0.197 7.8#
Systolic BP, mmHg 0.170 0.227 8.6#
CRP, mg/dL -0.063 0.030 9.7#
IL-6, pg/mL -0.396* -0.163 5.2
TNF-α, pg/mL 0.123 -0.049 9.4#
PAI-1, ng/mL 0.349* -0.241* 26.7#
Fibrinogen, mg/dL -0.037 -0.183 8.4#
Adiponectin, ng/mL -0.186 -0.025 3.6
Hb A1c, % 0.202 -0.246* 13.0#
Cortisol, ug/day 0.272 0.004 3.8
Uric acid, mg/dL -0.273 -0.111 15.9#
Leptin, ng/mL -0.327* -0.094 12.3#
All variables were entered in the regression models as continuous variables. TC, total cholesterol; HDL-C, high-density lipoprotein cholesterol; LDL-C, low-density lipoprotein cholesterol; Apo A1, apolipoprotein A1; Apo B100, apolipoprotein B100; BP, blood pressure; CRP, C-reactive protein; IL-6, interleukin-6; TNF-α, tumor necrosis factor-alpha; PAI-1, plasminogen activator inhibitor-1; Hb A1c, hemoglobin A(1c); Age had only independent significant contribution in PAI-1 and uric acid.
** Variance explained by age, BMI, and waist and hip circumference.
# Independent significant contribution of BMI, P < 0.001.
WC TTAT WC TTSAT WC TTMT
Triacylglycerols, mg/dL 0.297 -0.124 0.280 -0.142 0.321* 0.029
Fasting insulin, µIU/mL 0.172 -0.227 0.150 -0.239* 0.255 -0.023
Fasting glycemia, mg/dL 0.502† -0.100 0.503† -0.088 0.468† 0.147
TC/HDL-C ratio 0.308* -0.188 0.308* -0.172 0.374* 0.001
LDL-C/HDL-C ratio 0.228 -0.252* 0.221 -0.245* 0.334* -0.034
Apo A1-Apo B100 ratio -0.133 0.218 -0.120 0.228 -0.234 0.050
Systolic BP, mmHg 0.169 0.104 0.156 0.066 0.069 0.126
CRP, mg/dL -0.015 0.233 -0.016 0.192 -0.058 -0.072
IL-6, pg/mL -0.314 0.146 -0.318 0.122 -0.314 -0.122
TNF-α, pg/mL 0.223 0.232 0.212 0.168 0.158 -0.028
PAI-1, ng/mL 0.362* -0.129 0.338* -0.157 0.478‡ -0.164*
Fibrinogen, mg/dL -0.018 -0.020 -0.029 -0.042 0.092 -0.222*
Adiponectin, ng/mL -0.245 -0.085 -0.250 -0.084 -0.247 0.062
Hb A1c, % 0.221 -0.244* 0.210 -0.233* 0.266 0.071
Cortisol, ug/day 0.258 0.118 0.237 0.132 0.168 0.101
Uric acid, mg/dL -0.275 -0.028 -0.287 -0.051 -0.244 -0.048
Leptin, ng/mL -0.211 0.310* -0.225 0.225 -0.297 -0.035
All variables were entered in the regression models as continuous variables. WC, waist circumference; TTAT, total thigh adipose tissue; TTSAT, total thigh subcutaneous adipose tissue; TTSFAT, total thigh subfascial adipose tissue; TTMT, total thigh muscular tissue; TC, total cholesterol; HDL, high-density lipoprotein; LDL-C, low-density lipoprotein; Apo A1, apolipoprotein A1; Apo B100, apolipoprotein B100; BP, blood pressure; CRP, C-reactive protein; IL-6, interleukin-6; TNF-α, tumor necrosis factor-alpha; PAI-1, plasminogen activator inhibitor-1; Hb A1c, hemoglobin A(1c).
*P < 0.05. †P < 0.01. ‡
The associations of each thigh adipose and muscle tissue compartments with
metabolic risk factors, independently of age, BMI and WC are presented in Table 4. For a
given WC, a higher TTAT and TTSAT mass were both associated with lower Hb A1c
concentrations, as well as with a lower LDL-C/HDL-C ratio. Additionally, while TTAT
mass was inversely related with leptin, TTSAT mass revealed independent and opposite
associations with fasting insulin and HDL-C concentrations. On the contrary, TTSFAT did
not revealed associations with any of the metabolic syndrome features studied. Furthermore,
for a given WC, a higher TTMT mass was associated with lower PAI-1 and fibrinogen
concentrations.
DISCUSSION
This study demonstrates the opposite associations between both WC and HC and
atherogenic and prothrombotic features of metabolic syndrome and CVD, extending the
previous knowledge about the separate contributions of each anthropometric marker to
health risk (Figure 1). To our knowledge, it is the first study that has observed independent
and opposite effects of WC and HC not only with major metabolic syndrome components,
but also with specific metabolic risk factors, which are relevant for diabetogenic and
atherogenic risk assumption (2,3,8). Furthermore, in this context of the opposite
contributions of WC and HC to metabolic risk, as a unique feature of this paper, it is the first
time that it is addressed the contribution of abdominal and thigh adipose tissue
compartments, and muscle tissue distribution, measured by CT, to the observed associations.
It was already reported that, for a given WC, a larger HC was related with a lower risk for
metabolic syndrome disturbances (1,2,14), type 2 DM (1,3,6,9), and CVD morbidity and
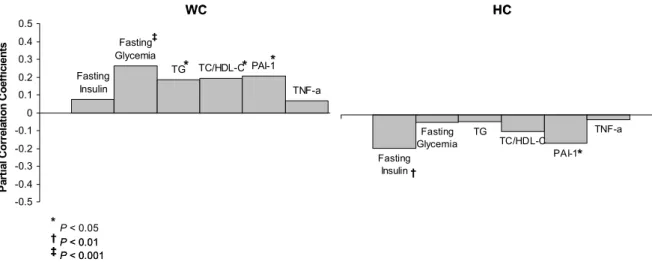
Figure 1. Partial correlations, controlling for age and BMI, between both WC and HC and
the metabolic syndrome features studied.
However, this independent and relative HC protective contribution to disease risk
disappeared when WC was not taken into account. Indeed, in our study, bivariate models
revealed that larger WC and HC were both associated with an unfavourable metabolic
profile and a higher CVD risk.
On the other hand, consistently with previous observations (26), we observed that
WC was related with increased VAT and Ab SAT areas, reflecting a morbidogenic body
composition phenotype and metabolic profile, while a larger HC was inversely associated
with both abdominal AT compartments (data not shown). After adjustment for age and BMI,
multiple regression analyses between both anthropometric markers and the metabolic risk
factors revealed positive associations between WC and glucose metabolism markers,
hypercholesterolemia, hypertriacylglycerolemia, and PAI-1, a specific indicator of impaired
fibrinolysis and atherothrombotic state (27).
In addition, WC was also inversely associated with leptin and apo A1 concentrations
(data not shown). In this context, it was recently proposed a synergistic effect promoted by a
combination of hyperinsulinemia, hyperglycemia and hypercholesterolemia in obese TG TC/HDL-C PAI-1
TNF-a Fasting Insulin Fasting Glycemia -0.5 -0.4 -0.3 -0.2 -0.1 0 0.1 0.2 0.3 0.4 0.5 WC P a rt ia l C o rr e la ti on C o ef fi ci ent s Fasting Glycemia TC/HDL-C TNF-a Fasting Insulin TG PAI-1 HC WC HC * * P< 0.05
†
†
P< 0.01
‡
‡
P< 0.001
* * * * * * ‡ ‡ † † Fasting Glycemia TC/HDL-C TNF-a Fasting Insulin TG PAI-1 HC † † * * TG TC/HDL-C PAI-1
TNF-a Fasting Insulin Fasting Glycemia -0.5 -0.4 -0.3 -0.2 -0.1 0 0.1 0.2 0.3 0.4 0.5 WC P a rt ia l C o rr e la ti on C o ef fi ci ent s Fasting Glycemia TC/HDL-C TNF-a Fasting Insulin TG PAI-1 HC WC HC * * P< 0.05
†
†
P< 0.01
‡
‡
P< 0.001
individuals to enhance plasma PAI-1 concentrations, which could explain the verified
association between this atherothrombotic marker and WC (28). However, previous evidence
have shown that hyperinsulinemia alone is also related with increased PAI-1 concentrations
in obese and type 2 DM subjects, suggesting a direct link between IR and PAI-1 (27).
However, it is still unclear whether insulin acts directly or via IR to enhance PAI-1
concentrations. PAI-1 has been associated with dyslipidemia, abdominal adiposity and
hypertension (28). Moreover, it is known that AT is also an important source of angiotensin
II, which might link the PAI-1 increase to renin-angiotensin system, and hence, to
hypertension (29). Despite the controversial opinions about regional AT differences in PAI-1
secretion, it was recently suggested that VAT, rather than Ab SAT, could be responsible for
the raised PAI-1 values and IR observed in metabolic syndrome patients (30).
On the contrary, in our study, for a given WC, a large HC was associated with lower
fasting insulin, Hb A1c and PAI-1 concentrations. These results reinforce the protective
effect of relatively larger hips to glucose metabolism and IR markers, and further extend this
notion to specific atherogenic and prothrombotic disturbances. Similarly, other studies have
also reported that a larger HC (or a higher peripheral fat mass) was independently associated
with a more favourable plasma glucose and lipid profile (1,7,10), and a lower type 2 DM
(3,4,14,31), and CVD risk (1,9,11). These protective contributions of a larger HC to
morbidity seem also to be present with risk of premature mortality, after adjustment for BMI
(9,25).
A larger WC, reflecting central obesity, has been associated with a chronic
inflammatory state, promoted by a low-grade plasma elevation of some adipokines and
acute-phase reactants, such as TNF-α, IL-6 and CRP (32). These inflammatory markers have
been associated with type 2 DM (33), atherogenesis and CVD (34). Although not significant,
but also with some inflammatory risk factors, such as TNF-α, which seem to play an
important mechanistic role in IR, down-regulating GLUT-4, and inhibiting insulin receptor
activity (35). Since TNF-α can induce IL-6 release, it has been suggested that TNF-α may be
the “driver” behind metabolic syndrome (36). In abdominal obese women, the
concentrations of these adipokines are increased, while adiponectin, produced by both
visceral and peripheral adipocytes, is commonly decreased (37). Adiponectin present
anti-atherogenic, anti-inflammatory, and insulin sensitising effects (38), which seem to be
relevant to counteract the diabetogenic and atherogenic risk associated with obesity. In
previous studies which have examined the contrasting contributions of both central fat mass
(CFM) and peripheral fat mass (PFM) to atherogenic glucose and lipid markers, as well to
aortic calcification (7,10,11,14), the verified PFM protection against type 2 DM and
atherosclerosis seemed to be mediated by insulin sensitization effects associated with
adiponectin physiological metabolism (39).
It is well recognized that HC variations can be explained by skeletal frame size,
gluteofemoral muscle mass or AT accumulation (3,4). Moreover, it has been postulated that
relatively narrow hips due to lack of thigh muscle mass are associated with a lower muscle
insulin clearance (40) and an impaired muscle fatty acid oxidation capacity (6,8). However,
authors have been suggesting that HC seems to be more closely associated with leg fat mass
in women (4). In our study, contrarily to WC, a larger HC was not only independent and
inversely related with both VAT and Ab SAT areas, but revealed also additional associations
with gluteofemoral AT and thigh muscle tissue compartments (data not shown).
Therefore, further analyses were developed to highlight the relevance of each thigh
AT and muscle tissue compartment to the observed relative HC protective role to metabolic
risk. For a given WC, higher TTAT and TTSAT mass were both associated with lower Hb
inversely related with both fasting insulin and HDL-C concentrations, being a higher TTAT
mass associated with lower leptin concentrations. In contrast, TTSFAT did not reveal any
association with the metabolic syndrome features studied. Furthermore, for a given WC, a
higher TTMT mass was a significant predictor of lower PAI-1 and fibrinogen
concentrations.
These observations suggest that, in overweight or obese women, the verified
protective HC role in dyslipidemia and IR, when WC is taken into account, could be
mediated by subcutaneous gluteofemoral AT. Indeed, it was already observed that, for a
given amount of abdominal fat, low subcutaneous fat in the legs was associated with an
unfavourable lipid profile (16). In this context, it has been proposed that underlying
hormonal factors, such as estrogens concentrations may regulate preferential thigh AT
accumulation (41). In addition, gluteofemoral adipocytes are relatively less sensitive to
catecholamine-stimulated lipolysis, being more sensitive to anti-lipolytic stimuli, when
compared to VAT adipocytes (42). These metabolic differences combined with a relatively
higher activity of lipoprotein lipase (LPL) in these thigh adipocytes promote the uptake of
free fatty acids from circulation, providing a “buffer” which may carry out an
anti-diabetogenic and anti-atherogenic effect, as well as a protection against liver, pancreas and
muscle ectopic fat storage (43).
Conversely, our results also suggest that thigh muscle tissue seem to be relevant for
the observed protection against prothrombotic and atherosclerotic abnormalities. Despite
evidence has been highlighting the contribution of muscle tissue to a better metabolic profile
(44), and lower insulin metabolism (40) and fatty acid oxidation capacity disturbances (6,8),
these are novel observations that need further research. Furthermore, it is noteworthy that
factors, such as physical activity and diet may underlie and confound these associations,
needing therefore to be taken in consideration in future studies (45).
In summary, we found that, for a given WC, HC was inversely associated with IR
markers and atherothrombotic disturbances. On the contrary, a larger WC was associated
with a higher metabolic risk. The protective effect of relatively larger HC, when WC is taken
into account, was extended to novel and specific metabolic syndrome features, being these
contrasting effects in diabetogenic markers mediated by gluteofemoral AT, while thigh
muscle tissue seemed to mediate the protection against atherothrombotic risk factors.
Therefore, in addition to BMI and WC screening relevance, HC can also contribute to
additionally predict cardiovascular disease risk in overweight and obese women.
ACKNOWLEDGMENTS
The authors are very grateful to Health and Exercise Laboratory (Faculty of Human
Movement) staff for all support and technical assistance in laboratory assessments. We also
REFERENCES
(1). Snijder MB, Zimmet PZ, Visser M, Dekker JM, Seidell JC, Shaw JE. Independent
and opposite associations of waist and hip circumferences with diabetes,
hypertension and dyslipidemia: the AusDiab Study. Int J Obes Relat Metab Disord 2004;28:402-9.
(2). Snijder MB, Dekker JM, Visser M, et al. Larger thigh and hip circumferences are
associated with better glucose tolerance: the Hoorn study. Obes Res 2003;11:104-11.
(3). Snijder MB, Dekker JM, Visser M, et al. Associations of hip and thigh
circumferences independent of waist circumference with the incidence of type 2 diabetes: the Hoorn Study. Am J Clin Nutr 2003;77:1192-1197.
(4). Snijder MB, Dekker JM, Visser M, et al. Trunk fat and leg fat have independent and
opposite associations with fasting and postload glucose levels: the Hoorn study. Diabetes Care 2004;27:372-7.
(5). Pouliot MC, Despres JP, Nadeau A, et al. Associations between regional body fat
distribution, fasting plasma free fatty acid levels and glucose tolerance in premenopausal women. Int J Obes 1990;14:293-302.
(6). Seidell JC, Han TS, Feskens EJ, Lean ME. Narrow hips and broad waist
circumferences independently contribute to increased risk of non-insulin-dependent diabetes mellitus. J Intern Med 1997;242:401-6.
(7). Tatsukawa M, Kurokawa M, Tamari Y, Yoshimatsu H, Sakata T. Regional fat
deposition in the legs is useful as a presumptive marker of antiatherogenesity in Japanese. Proc Soc Exp Biol Med 2000;223:156-62.
(8). Seidell JC, Perusse L, Despres JP, Bouchard C. Waist and hip circumferences have
independent and opposite effects on cardiovascular disease risk factors: the Quebec Family Study. Am J Clin Nutr 2001;74:315-21.
(9). Lissner L, Bjorkelund C, Heitmann BL, Seidell JC, Bengtsson C. Larger hip
circumference independently predicts health and longevity in a Swedish female cohort. Obes Res 2001;9:644-6.
(10). Tanko LB, Bagger YZ, Alexandersen P, Larsen PJ, Christiansen C. Peripheral adiposity exhibits an independent dominant antiatherogenic effect in elderly women. Circulation 2003;107:1626-31.
(11). Tanko LB, Bagger YZ, Alexandersen P, Larsen PJ, Christiansen C. Central and peripheral fat mass have contrasting effect on the progression of aortic calcification in postmenopausal women. Eur Heart J 2003;24:1531-7.
(12). Rexrode KM, Carey VJ, Hennekens CH, et al. Abdominal adiposity and coronary artery disease in women. JAMA 1999;281:2284-2285.
(13). Seidell JC, Oosterlee A, Deurenberg P, Hautvast JG, Ruijs JH. Abdominal fat depots measured with computed tomography: effects of degree of obesity, sex, and age. Eur J Clin Nutr 1988;42:805-15.
(14). Snijder MB, Zimmet PZ, Visser M, Dekker JM, Seidell JC, Shaw JE. Independent association of hip circumference with metabolic profile in different ethnic groups. Obes Res 2004;12:1370-1374.
(15). Sakai Y, Ito H, Egami Y, et al. Favourable association of leg fat with cardiovascular risk factors. J Intern Med 2005;257:194-200.
(17). Teixeira PJ, Palmeira AL, Branco TL, et al. Who will lose weight? A reexamination of predictors of weight loss in women. Int J Behav Nutr Phys Act 2004;1:12.
(18). Lohman TG, Roche AF, Martorell R, eds. Anthropometric standardization reference manual. Champaign, IL: Human Kinetics Publishers, 1988.
(19). Goodpaster BH, Kelley DE, Wing RR, Meier A, Thaete FL. Effects of weight loss on regional fat distribution and insulin sensitivity in obesity. Diabetes 1999;48:839-47.
(20). Snyder WS, Cook MJ, Nasset ES, Karhausen LR, Howells GP, Tipton IH. Report on the task group on reference man. Oxford: Paergamon Press, 1984.
(21). Kelley DE, Thaete FL, Troost F, Huwe T, Goodpaster BH. Subdivisions of subcutaneous abdominal adipose tissue and insulin resistance. Am J Physiol Endocrinol Metab 2000;278:E941-948.
(22). Ferland M, Després J-P, Tremblay A, et al. Assessment of adipose tissue distribution by computed axial tomography in obese women: Association with body density and anthropometric measurements. Br J Nutr 1989;61:139-148.
(23). Mitsiopoulos N, Baumgartner RN, Heymsfield SB, Lyons W, Gallagher D, Ross R. Cadaver validation of skeletal muscle measurement by magnetic resonance imaging and computed tomography. J Appl Physiol 1998;85:115-122.
(24). Expert Panel on the Detection E, and Treatment of High Blood Cholesterol in Adults. Executive Summary of the Third Report of the National Cholesterol Education Program (NCEP) Expert Panel on Detection, Evaluation, and Treatment of High Blood Cholesterol in Adults (Adult Treatment Panel III). JAMA
2001;285:2486-2497.
(25). Heitmann BL, Frederiksen P, Lissner L. Hip circumference and cardiovascular morbidity and mortality in men and women. Obes Res 2004;12:482-7.
(26). Pouliot MC, Despres JP, Lemieux S, et al. Waist circumference and abdominal sagittal diameter: best simple anthropometric indexes of abdominal visceral adipose tissue accumulation and related cardiovascular risk in men and women. Am J Cardiol 1994;73:460-8.
(27). Bastard JP, Pieroni L, Hainque B. Relationship between plasma plasminogen activator inhibitor 1 and insulin resistance. Diabetes Metab Res Rev 2000;16:192-201.
(28). Calles-Escandon J, Mirza SA, Sobel BE, Schneider DJ. Induction of
hyperinsulinemia combined with hyperglycemia and hypertriglyceridemia increases plasminogen activator inhibitor 1 in blood in normal subjects. Diabetes
1998;47:290-293.
(29). Schling P, Mallow H, Trindl A, Loffler G. Evidence for a local renin angiotensin system in primary cultured human preadipocytes. Int J Obes Relat Metab Disord 1999;23:336-41.
(30). Yudkin JS, Coppack SW, Bulmer K, Rawesh A, Mohamed-Ali V. Lack of evidence for secretion of plasminogen activator inhibitor-1 by human subcutaneous adipose tissue in vivo. Thromb Res 1999;96:1-9.
(31). Abate N, Garg A, Peshock RM, Stray-Gunderson J, Grundy SM. Relationships of generalized and regional adiposity to insulin sensitivity in men. J Clin Invest 1995;96:88-98.
(32). Festa A, D'Agostino R, Jr., Williams K, et al. The relation of body fat mass and distribution to markers of chronic inflammation. Int J Obes Relat Metab Disord 2001;25:1407-15.
(34). Yudkin JS, Stehouwer CD, Emeis JJ, Coppack SW. C-reactive protein in healthy subjects: associations with obesity, insulin resistance, and endothelial dysfunction: a potential role for cytokines originating from adipose tissue? Arterioscler Thromb Vasc Biol 1999;19:972-8.
(35). Hotamisligil GS. The role of TNF-alfa and TNF receptors in obesity and insulin resistance. Intern Med 1999;245:621-625.
(36). Bruunsgaard H, Pedersen M, Pedersen BK. Aging and pro-inflammatory cytokines. Curr Opin Hematol 2001;8:131-136.
(37). Yamauchi T, Kamon J, Waki H, et al. Globular adiponectin protected ob/ob mice from diabetes and ApoE-deficient mice from atherosclerosis. J Biol Chem
2003;278:2461-8.
(38). Yamauchi T, Kamon J, Waki H, et al. The fat-derived hormone adiponectin reverses insulin resistance associated with both lipoatrophy and obesity. Nat Med
2001;7:941-6.
(39). Tanko LB, Bruun JM, Alexandersen P, et al. Novel associations between
bioavailable estradiol and adipokines in elderly women with different phenotypes of obesity: implications for atherogenesis. Circulation 2004;110:2246-52.
(40). Yki-Jarvinen H, Koivisto VA, Karonen SL. Influence of body composition on insulin clearance. Clin Physiol 1985;5:45-52.
(41). Hunter GR, Kekes-Szabo T, Snyder SW, Nicholson C, Nyikos I, Berland L. Fat distribution, physical activity, and cardiovascular risk factors. Med Sci Sports Exerc 1997;29:362-369.
(42). Rebuffe-Scrive M, Eldh J, Hafstroem L-O, al. e. Metabolism of mammary, abdominal, and femoral adipocytes in women before and after menopause. Metabolism 1986;35:792-797.
(43). Ravussin E, Smith SR. Increased fat intake, impaired fat oxidation, and faillure of fat cell proliferation result in ectopic fat storage, insulin resistance, and type 2 diabetes mellitus. Ann N Y Acad Sci 2002;967:363-378.
(44). Chowdhury B, Lantz H, Sjostrom L. Computed tomography-determined body composition in relation to cardiovascular risk factors in Indian and matched Swedish males. Metabolism 1996;45:634-644.