CHAPTER
5
*Opposite associations of abdominal and thigh adiposity with liver fat in
overweight and obese women
Paulo M. Rocha1, José T. Barata1, Claudia S. Minderico1, Analiza M. Silva1, Pedro J.
Teixeira1 and Luís B. Sardinha1
1
Exercise and Health Laboratory, Faculty of Human Movement, Technical University of
Lisbon, Lisbon, Portugal
Running Head: Body fat distribution and liver fat
Correspondence author:
Luis Bettencourt Sardinha, PhD
Exercise and Health Laboratory, Faculty of Human Movement,
Technical University of Lisbon, Estrada da Costa,
1495-688 Cruz-Quebrada, Portugal, Tel: (351) 21 414 91 60
Fax: (351) 21 414 91 93, lsardinha@fmh.utl.pt
*Rocha, P.M., Barata, J.T., Minderico, C.S., Silva, A.M., Teixeira, P.J. & Sardinha, L.B.
(2007). Opposite associations of abdominal and thigh adiposity with liver fat in overweight
ABSTRACT
Our purpose was to analyze the independent associations of abdominal and thigh AT
compartments with liver fat. We further investigate the relations of proinflammatory and
atherothrombotic metabolic syndrome features with liver fat. Abdominal and thigh adipose
and muscle tissue distribution, and liver and spleen attenuation were assessed by computed
tomography in 140 overweight and obese women. Blood lipids and insulin resistance
markers, as well as atherothrombotic and proinflammatory risk factors were also measured.
Thigh subfascial AT (TSFAT) was inversely associated with liver fat (p<0.05),
independently of age and BMI. Contrarily, a higher sagittal diameter and a larger visceral
adipose tissue (VAT) area were related with liver fat (p<0.05). Additionally, increased
fasting insulin, triglycerides, plasminogen activator inhibitor-1, liver transaminases, and uric
acid concentrations, as well as higher total-cholesterol/HDL-cholesterol and
LDL-cholesterol/HDL-cholesterol ratios were independently associated with liver fat (p<0.05).
These associations remained significant after adjustment for VAT (p<0.05). We conclude
that thigh subfascial AT was inversely associated with liver fat, suggesting that this thigh AT
depot may play a protective role against hepatic ectopic fat storage in overweight and obese
women. Furthermore, these results reinforce the contribution of an abdominal obesity
phenotype associated with a diabetogenic, inflammatory and an atherothrombotic metabolic
profile to liver lipotoxicity.
INTRODUCTION
Obesity-related comorbidities seem to be more closely related to body fat distribution
rather than the total amount per se (19). Abdominal obesity is a predictor of a higher
metabolic risk, assuming insulin resistance (IR) the common link between visceral adiposity
and dyslipidemia (10, 22, 35), type 2 diabetes mellitus (DM) (7, 18), liver fat (4),
hypertension (33), and other cardiovascular diseases (CVD) (23, 30, 33). Two major
pathophysiological hypotheses have been advanced to explain metabolic disturbances in
abdominal obese individuals. It has been proposed that neuroendocrine perturbations,
mediated by hypothalamic-pituitary-adrenal (HPA) axis stimulation, also known as stress,
are responsible for IR and abdominal obesity (8, 9). Moreover, alterations in cortisol
secretion, inhibition of steroid and growth hormones production, and stimulation of
sympathetic nervous centers are some of the dysfunctions which may precipitate metabolic
disturbances (8). Conversely, according to the “portal” hypothesis, the increased lipolytic
activity in visceral adipocytes, lead to an augmented release of free fatty acids (FFA) into
portal circulation, promoting liver fat storage, which is accompanied by hepatic metabolism
disturbances and IR (6, 18, 48).
In this context, abdominal obesity has been associated with ectopic fat storage,
defined as fat accumulation outside “classical” AT depots, such as heart, skeletal muscle,
pancreas, and liver (47). Moreover, liver fat seems to be associated with obesity, increased
concentrations of plasma FFA, as well as with the IR degree, both in obese and type 2 DM
patients (21, 40, 48). Furthermore, liver-to-spleen ratio (LSR), a reliable index of liver fat
(31), has been independently associated not only with visceral adiposity (4, 37, 38), but also
with hepatic IR (18, 21, 27, 38), dyslipidemia, and several other metabolic syndrome
features (4, 18, 29, 38). Emerging from a combination of several disturbances, including
lipoprotein (VLDL) secretion, and a low chronic inflammatory state, hepatic steatosis has
also been related with IR and major CVD risk factors (3, 27).
However, although evidence has been highlighting the independent contributions of
both visceral adiposity and liver fat to an increased metabolic risk in obese or type 2 DM
patients, it is not totally clear if liver fat is additionally associated with other specific
inflammatory and atherothrombotic metabolic syndrome features. On the other hand, despite
the recognized relevance of abdominal obesity to ectopic liver fat storage, little is known
about the relationships of both specific abdominal and thigh AT compartments and liver fat.
Moreover, one study developed in type 2 DM patients has reported that thigh subfascial AT
was correlated with both liver fat and IR (18). Therefore, based on previously defined
criteria (31), the current study examined the separate contributions of abdominal and thigh
AT compartments to liver fat in overweight and obese women. Additionally, it was further
investigated the independent associations of liver fat with metabolic syndrome
proinflammatory and atherothrombotic clinical features.
MATERIALS AND METHODS
Subjects
Participants in this investigation were 140 pre-menopausal Caucasian women,
recruited from community by public advertisement for a 2-year weight management
program, as described earlier in detail (44). Study inclusion criteria required that the subjects
were no currently pregnant, older than 24 years, had a body mass index (BMI)>24.9 kg/m2,
were not under any medication that could affected weight, body composition or liver
metabolism, had no clinical or laboratory evidence of liver or spleen disease, and had no
history of cancer in the last five years. Ongoing hormonal medication, history of CVD,
resting and exercise abnormal electrocardiograms were defined as exclusion criteria.
Subjects that were undertaking oral medication to treat hypertriglyceridemia, hyperglycemia
or hypercholesterolemia were also excluded. All subjects were informed about the purpose,
nature and study design before giving their fully written consent to participate. The study
protocol was performed according to the principles of the Helsinki Declaration and was
approved by The Human Subjects Institutional Review Board of the Faculty of Human
Movement, Technical University of Lisbon.
Body Composition Assessments
Anthropometric variables.
Height was measured to the nearest 0.1 cm with a stadiometer (Seca, Hamburg,
Germany). Body mass was measured to the nearest 0.01 kg on a previous calibrated scale
after removing shoes and clothes. Abdominal sagittal diameter (SD), waist circumference
(WC) and hip circumference (HC) measurements were obtained by standard procedures (24).
BMI was calculated as weight divided by height squared (kg/m2) and waist-to-hip ratio
(WHR) was defined as the WC divided by HC.
Dual energy X-ray absorptiometry (DXA).
Trunk fat mass (TFM), TBFM, and total body lean mass (TBLM) were measured by
DXA (QDR-1500 Hologic, Inc. Waltham, MA). The intra-observer coefficient of variation
(CV) for TBFM and TBLM was 2.0% and 1.7%, respectively. A 0.5% technical error for
%TBFM was obtained as calculated in 2 repeated measures performed on 10 subjects.
Measurement of abdominal adipose tissue distribution.
With the subjects supine and arms extended above their head, a single cross-sectional
CT (Siemens, Somaton Plus) image at L4-L5 inter-vertebral space was acquired to measure
120kVp, 480 mA, 512×512 matrix with a 48-cm field of view. Total abdominal adipose
tissue (TAAT), abdominal subcutaneous adipose tissue (Ab SAT), superficial and deep Ab
SAT, and VAT areas were measured. The boundary between VAT and Ab SAT was defined
using the abdominal and oblique muscles in continuity with the deep fascia of the paraspinal
muscles and the anterior aspect of the vertebral body (12). The subcutaneous fascia was used
to differentiate Ab SAT into its superficial and deep compartments (19).
Measurement of thigh adipose tissue and muscle distribution.
Using same scan parameters, contiguous 7-mm-thick cross-sectional images of both
legs were obtained between the inferior ischial tuberosity and the superior border of the
patella. Total thigh adipose tissue (TTAT), total thigh subcutaneous AT (TTSAT), thigh
subfascial AT (TTSFAT,) and muscle tissue areas and attenuations were measured. The
tissues volumes (cm3) identified in each image were calculated by multiplying the image
thickness (7 mm) by the tissue area (cm2). Thigh AT volume (litters) were than converted to
mass units (kilograms) multiplying the volume by the assumed constant fat density (0.92
kg/L) (41). Total thigh muscle mass was also calculated multiplying volume by the constant
density assumed for adipose tissue-free skeletal muscle (1.04 kg/L) (41). From the thigh
scans performed, it was selected a single slice located at the mid-point distance between both
anthropometric markers described to image mid-thigh AT and muscle tissue distribution.
Measurement of liver fat.
A 7-mm-thick cross-sectional image at T11-T12 vertebral space was acquired to
measure both liver and spleen CT attenuations, which were determined by calculating the
mean Hounsfield units (HU) of three regions of interest (ROI) (liver ROI had ~120 mm2,
located 2 in right lobe and 1 in left lobe; spleen ROI had ~75 mm2). All ROI were
consistently selected in peripheral parenchyma areas, as previously described (18), away
liver to spleen attenuation values, defined as liver-to-spleen ratio (LSR) is a reliable index of
liver fat (31). Fatty liver is defined when LSR<1 (18).
Measurements reliability.
The reliability for abdominal and thigh adipose and muscle tissue compartments was
calculated in 30 women chosen randomly from all subjects. Same technician performed the
repeated analyses on same images, separated by 3 months. The intra-observer coefficient of
variation (CV) for VAT and TAAT were, respectively, 0.9% and 0.7%. For Ab SAT, deep
and superficial Ab SAT, the intra-observer CV were, respectively, 0.8%, 2.8% and 3.1%.
For mid-thigh muscle tissue, total mid-thigh AT and subfascial AT (SFAT) the
intra-observer CV were 0.1%, 0.4% and 2.5%, respectively. Reliability for liver and spleen
measurements was also examined, being the CV for LSR 2.2%.
Image analysis.
Based on image morphology, CT data was analyzed by specific analysis software
(Slice-O-matic, Version 4.2, Tomovision, Montreal, Canada). It was used a combination of
watershed techniques and edge detection filters (28). Standard HU ranges for adipose tissue
(-190 to -30 HU) and skeletal muscle (-29 to 150 HU) were used to compute the tissue
segmentation (36). It was also measured, in both legs, the high-density (31 to 150 HU) and
low-density muscle areas (-29 to 30 HU) (15). Thigh fascia was used as boundary to
demarcate the subcutaneous AT from SFAT (18).
Blood Analysis
After a 12-hour overnight fast, venous blood samples were obtained from antecubital
vein. Measurement of triglycerides (TG), uric acid, total cholesterol (TC), low-density
lipoprotein cholesterol (LDL-C), and high-density lipoprotein cholesterol (HDL-C) were
electrochemiluminescence immunoassay (ECLIA), glycemia was assessed by hexoquinase
method and interleukin-6 (IL-6) was measured by chemiluminescence immunoassay. Tumor
necrosis factor-alpha (TNF-α) was measured using a high-sensitivity enzyme-linked
immunosorbent assay (ELISA) principle. Plasminogen activator inhibitor-1 (PAI-1) was
measured in iced citrated plasma using the Coatest PAI method (enzyme immunoassay -
EIA).
Hemoglobin A1c (Hb A1c) was determined by high-pressure liquid chromatography
(HPLC). Adiponectin, leptin and urinary cortisol were measured by radioimmunoassay
(RIA). Microalbuminuria and C-reactive protein (CRP) plasma concentrations were
measured by a high-sensitivity particle-enhanced turbidimetric assay. Alanine
aminotransferase (ALT) and aspartate aminotransferase (AST) were determined by a kinetic
method.
Blood Pressure
After a 5-minute rest, systolic and diastolic blood pressures (BP) were measured in
seated position with a semiautomatic oscillometric recorder (Dinamap, Critikon, Tampa,
FL). A suitable cuff size was applied to participant’s upper arm and the mean of three
measurements in each arm was calculated.
Statistical Analysis
Unless otherwise is indicated, data are presented as means±SD. It was studied the
variables normality and homocedasticity. When necessary, log transformations were used to
normalize distributions. Multiple linear regressions, adjusted for age and BMI, were
performed to study the independent associations of liver-to-spleen ratio with major
Adjusting for the same variables, independent associations of LSR with anthropometric
markers, abdominal and thigh adipose and muscle tissue compartments were also studied.
In order to facilitate the comparisons of the results obtained in the multiple linear
regression models, standardized beta values were presented. To determine how much the
independent variables were linearly related to one another, it was studied the multicolinearity
by statistic tolerance (1-R2), being the stability of the regression model disturbed by
multicolinearity if tolerance is inferior to 0.1. Statistical significance was set at p<0.05.
Statistical analyses were performed using the SPSS version 13.0 for Windows (SPSS,
Chicago, IL, USA).
RESULTS
Subject’s anthropometric and body composition characteristics are presented in
Table 1. Most of the subjects were obese, revealing BMI, as well as abdominal and thigh AT
compartments wide variation ranges. An increased WC was observed in 43.9% of the
subjects (11). VAT was the minor constituent of abdominal AT area (23.6%). Superficial
and deep Ab SAT areas were similar, comprising each one, approximately half of total Ab
SAT depot. While TTAT mass represented 57.9% of total thigh mass, LDM was the smallest
compartment (19.8%) of mid-thigh muscle area. The fatty liver prevalence observed was
2.9%.
In Table 2 are presented the metabolic syndrome clinical outcomes. Accordingly to
the ATP III criteria (11), hypertriglyceridemia was found in 22.3% of the subjects, while
hypertension assumed 21.4% prevalence. Despite lower HDL-C concentrations were found
Table 1. Subject characteristics (n=140)
Mean±SD Range
Anthropometric data
Age, y 38.3±0.5 25.0-49.0
Weight, kg 78.1±1.0 59.1-107.8
BMI, kg/m2 30.4±0.3 25.1-45.2
WC, cm 87.2±0.8 71.1-123.4
Waist-to-hip ratio 0.78±0.01 0.64-0.99
Sagittal diameter, cm 20.5±0.2 16.3-31.0
Fat mass
TFM, kg 18.0±0.4 9.4-32.3
TBFM, kg 36.1±0.7 23.5-60.3
TBLM, kg 41.2±4.62 29.7-55.6
Abdominal adipose tissue
TAAT, cm2 470.9±12.1 211.9-910.8
VAT, cm2 111.3±4.3 24.9-266.8
Ab SAT, cm2 353.6±9.1 145.0-633.4
Superficial, cm2 192.2±5.0 90.6-384.2
Deep, cm2 161.8±5.4 54.7-344.9
Thigh compartments
Thigh AT, cm2 270.7±6.9 132.9-509.1
Thigh SAT, cm2 261.6±6.8 129.4-501.6
Thigh SFAT, cm2 3.5±0.2 1.0-11.9
Muscle, cm2 234.3±2.6 176.3-324.7
HDM, cm2 189.3±2.3 145.7-264.4
LDM, cm2 32.8±0.9 15.7-80.0
TTAT, kg 8.4±2.1 4.0-14.8
TTSAT, kg 7.9±2.1 3.8-14.0
TTSFAT, kg 0.6±0.2 0.3-1.5
TTMT, kg 6.1±0.9 4.4-10.3
Liver and spleen variables
Liver attenuation, HU 59.8±0.8 -5.6-71.0
Spleen attenuation, HU 46.4±0.4 34.0-57.5
LSR 1.30±0.02 -0.11-1.82
Table 2. Subject metabolic syndrome characteristics (n=140)
Mean±SD Range
Fasting insulin, µIU/mL 8.22±0.32 2.40-17.9
Fasting glycemia, mg/dL 89.48±0.65 73.0-113.0
Triglycerides, mg/dL 101.48±4.86 32.0-329.0
TC, mg/dL 194.74±3.86 101.0-307.00
HDL-C, mg/dL 54.09±1.05 29.0-91.0
LDL-C, mg/dL 123.50±3.54 45.0-255.0
TC/HDL-C ratio 3.74±1.11 2.04-9.55
LDL-C/HDL-C ratio 2.38±0.08 0.94-6.13
Systolic BP, mm Hg 120.65±1.43 90.0-175.0
Diastolic BP, mm Hg 75.83±0.93 50.0-101.0
ALT, IU/L 18.16±0.46 9.0-43.0
AST, IU/L 16.18±0.60 5.0-44.0
CRP, mg/dL 0.45±0.03 0.03-1.14
IL-6, pg/mL 10.32±0.56 0.80-31.50
TNF-α, pg/mL 3.87±0.23 0.90-14.10
PAI-1, ng/mL 21.18±2.01 1.0-100.0
Fibrinogen, mg/dL 369.38±6.48 201.0-552.0
Hb A1c, % 4.87±0.04 4.0-7.0
Uric acid, mg/dL 4.39±0.97 2.40-8.50
Microalbuminuria, µg/min 2.73±0.70 0.50-89.80
Cortisol, ug/day 41.04±1.69 6.0-105.0
Leptin, ng/mL 32.92±43.33 0.90-167.40
Adiponectin, ng/mL 9.18±6.44 2.93-41.00
Apo A1/Apo B100 ratio 1.74±0.05 0.78-3.31
Values are presented as means ± SD. TC, total cholesterol; HDL-C, high-density lipoprotein cholesterol; LDL-C, Low-density lipoprotein cholesterol; BP, blood pressure; ALT, alanine aminotransferase; AST, aspartate aminotransferase;CRP, C-reactive protein; IL-6, interleukin-6; TNF-α, tumor necrosis factor-alpha; PAI-1, plasminogen activator inhibitor-1; Hb A1c, hemoglobin A(1c); Apo A1, apolipoprotein A1; Apo B, apolipoprotein B100.
Age was not associated with LSR (β=0.118, p>0.05). However, both weight and BMI
were inversely associated with LSR, even when adjusting for age (β=-0.235, p<0.01; β
=-0.225, p<0.01, respectively). The results of simultaneously entering each anthropometric and
body composition marker to predict LSR, adjusting for age and BMI, are shown in Table 3.
an increased liver fat storage. Similar associations were observed when using liver
attenuation as dependent variable. Despite not significant, WHR, as well as total body and
trunk fat mass revealed an inverse association tendency with liver fat. In further analysis,
after adjusting for HC, a larger WC was related with a lower LSR (β=-0.203, p<0.05).
Table 3. Independent contributions (standardized betas) of anthropometric and body composition markers to liver-to-spleen ratio, adjusted for age and BMI.
Liver-to-spleen ratio Percentage of
variance explained**
(%)
WC, cm -0.229 7.7#
HC, cm 0.125 7.0#
WHR -0.145 7.9#
SD, cm -0.383* 10.1#
TFM, kg -0.221 7.4#
TBFM, kg -0.111 6.5#
TBLM, kg -0.077 6.7#
BMI, body mass index; WC, waist circumference; HC, hip circumference; WHR, waist-to-hip ratio; SD, sagittal diameter; TFM, trunk fat mass; TBFM, total body fat mass; TBLM, total body lean mass. Age did not have any independent significant contribution to the anthropometric studied variables. ** Variance explained by age, BMI and the studied variable.
#
Independent significant contribution of BMI, P < 0.01. *
P < 0.05. †P < 0.01. ‡P < 0.001.
In Table 4 are presented the independent contributions of abdominal AT depots and
thigh body composition compartments to LSR, after adjustment for age and BMI. Higher
VAT areas were associated with a lower LSR. On the contrary, a higher thigh SFAT area
was related with a higher LSR. These associations remained significant when using liver
attenuation as dependent variable and adjusting for the same confounders. Furthermore,
thigh SFAT remained positively associated with LSR, independently of WC (β=0.166,
Table 4. Independent contributions (standardized betas) of abdominal adipose tissue depots and thigh body composition compartments to liver-to-spleen ratio adjusted for age and BMI.
Liver-to-spleen ratio Percentage of
variance explained**
(%)
TAAT, cm2 -0.234 8.4
Ab SAT, cm2 -0.136 6.8
Superficial, cm2 0.014 6.3
Deep, cm2 -0.133 7.3
VAT, cm2 -0.241*
9.2
Mid-thigh AT, cm2 0.148 7.1
Mid-thigh SAT, cm2 0.129 7.1
Mid-thigh SFAT, cm2 0.295†
12.5
Muscle, cm2 0.005 6.2
HDM, cm2 -0.036 6.4
LDM, cm2 0.145 7.3
TTAT, kg 0.136 8.2
TTSAT, kg 0.040 6.8
TTSFAT, kg 0.089 7.2
TTMT, kg -0.051 6.9
TAAT, total abdominal adipose tissue; Ab, abdominal; SAT, subcutaneous adipose tissue; VAT, visceral adipose tissue; AT, adipose tissue; SAT, subcutaneous adipose tissue; SFAT, mid-thigh subfascial adipose tissue; HDM, high-density muscle; LDM, low-density muscle; TTAT, total thigh adipose tissue; TTSAT, total thigh subcutaneous adipose tissue; TTSFAT, total thigh subfascial adipose tissue; TTMT, total thigh muscular tissue. While BMI revealed an independent contribution to all body composition variables (P < 0.01), age did not have any independent contribution to the studied variables. ** Variance explained by age, BMI and the studied variable.
*P < 0.05. †P < 0.01. ‡P < 0.001.
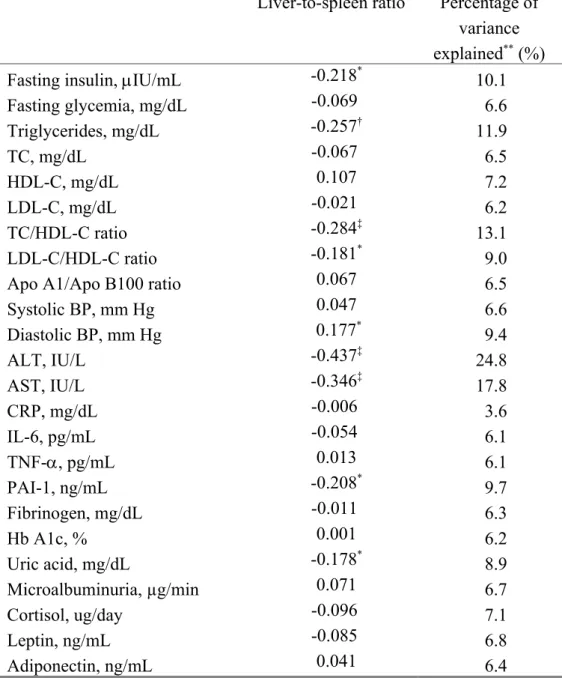
Independent associations of metabolic syndrome components, and inflammatory and
atherothrombotic risk factors to liver fat, adjusting for age and BMI, are presented in Table
5. Higher fasting insulin, TG, liver transaminases, PAI-1 and uric acid concentrations, as
well as higher TC/HDL-C and LDL-C/HDL-C ratios were associated with lower LSR
Table 5. Independent contributions (standardized betas) of metabolic syndrome features, proinflammatory and atherothrombotic risk factors to liver-to-spleen ratio, adjusted for age and BMI.
Liver-to-spleen ratio Percentage of
variance
explained** (%)
Fasting insulin, µIU/mL -0.218* 10.1
Fasting glycemia, mg/dL -0.069 6.6
Triglycerides, mg/dL -0.257† 11.9
TC, mg/dL -0.067 6.5
HDL-C, mg/dL 0.107 7.2
LDL-C, mg/dL -0.021 6.2
TC/HDL-C ratio -0.284‡ 13.1
LDL-C/HDL-C ratio -0.181* 9.0
Apo A1/Apo B100 ratio 0.067 6.5
Systolic BP, mm Hg 0.047 6.6
Diastolic BP, mm Hg 0.177* 9.4
ALT, IU/L -0.437‡ 24.8
AST, IU/L -0.346‡ 17.8
CRP, mg/dL -0.006 3.6
IL-6, pg/mL -0.054 6.1
TNF-α, pg/mL 0.013 6.1
PAI-1, ng/mL -0.208* 9.7
Fibrinogen, mg/dL -0.011 6.3
Hb A1c, % 0.001 6.2
Uric acid, mg/dL -0.178* 8.9
Microalbuminuria, µg/min 0.071 6.7
Cortisol, ug/day -0.096 7.1
Leptin, ng/mL -0.085 6.8
Adiponectin, ng/mL 0.041 6.4
All variables were entered in the regression models as continuous variables. TC, total cholesterol; HDL-C, high-density lipoprotein cholesterol; LDL-C, low-density lipoprotein cholesterol; AST, aspartate aminotransferase; ALT, alanine aminotransferase; CRP, C-reactive protein; IL-6, interleukin-6; TNF-α, tumor necrosis factor-alpha; PAI-1, plasminogen activator inhibitor-1; Hb A1c, hemoglobin A(1c). While age did not have any independent contribution to the studied variables, BMI revealed an independent contribution to all metabolic syndrome features (P < 0.01).
**
Variance explained by age, BMI and the studied variable. *
P < 0.05. †
P < 0.01. ‡
These metabolic risk factors remained significantly associated with LSR,
independently of VAT (p<0.05). The explained variance for each metabolic risk factor
studied to LSR varied between 3.6% and 24.8%, showing higher values for liver
transaminases, TC/HDL-C ratio and fasting insulin. When adjusting for age and BMI and
using liver attenuation as dependent variable, similar associations were found, excepting
fasting insulin and uric acid (p>0.05).
DISCUSSION
Our primary findings were that a higher thigh SFAT area was associated with either a
higher LSR or a lower liver attenuation, representing a lower liver fat storage, independently
of age and BMI. Furthermore, we found that for a given WC, increased thigh SFAT areas
were also significantly related with a higher LSR. To our knowledge, these associations
between thigh SFAT and both LSR and liver attenuation are novel observations that may
suggest an indirect preventive role of this thigh AT depot against ectopic liver fat storage in
overweight or obese women. Moreover, it has been suggested that femoral-gluteal AT may
function as a “sink” for circulating FFA (13). When compared with visceral adipocytes,
these thigh adipocytes are less sensitive to stimulated lipolysis and reveal a relatively high
lipoprotein lipase activity, important in FFA uptake from the circulation (32). Hence, these
metabolic characteristics may prevent liver lipotoxicity and counteract the inevitable
physiologic cascade observed in abdominal obese subjects, responsible for IR and other
secondary metabolic disturbances, such as multiple proinflammatory cytokine response.
Interestingly, several studies have been reporting that peripheral fat mass (PFM) is an
independent predictor of a lower health risk (42, 43). This protective PFM role in metabolic
disturbances and atherogenesity may be, in part, explained by adiponectin insulin sensitizing
adiponectin, may mediate these counteracting effects (20). However, rather than thigh SAT,
our observations support the notion that that TTSFAT may confer a metabolic protection
against detrimental ectopic fat storage in the liver.
However, previous studies have been associating mid-thigh SFAT not only with liver
fat (18), but also with IR (15, 18). In fact, in a recent study developed with 83 type 2 DM
patients, it was observed that fatty liver was not only inversely related with subfascial AT of
skeletal muscle but also with visceral adiposity (18), independently of the effects of VAT
and BMI. In this context, more than interpreting these results as an evidence suggesting a
causative role of thigh SFAT in fatty liver pathogenesis, the authors have proposed that,
SFAT together with fatty liver are special adiposity depots related with IR pathogenicity in
type 2 DM. Therefore, these results obtained in type 2 DM patients contrast with our results
verified in overweight and obese women, suggesting that this body composition area
warrants more research.
The role of abdominal obesity on ectopic liver fat storage and consequent metabolic
abnormalities has been a purpose of several studies. Indeed, in a study with 144 patients with
hepatic steatosis, clinically characterized by hepatocyte fat infiltration and often described as
fatty liver, BMI was the unique independent predictor of the steatosis degree (2).Another
two studies have also reported that, both in obese patients (25) and in living liver donors
(34), BMI was associated with the steatosis severity. Conversely,we found that,
independently of age, a higher weight and BMI were associated, in this sample of
overweight and obese women, with a lower LSR. On the other hand, in a study with 221
chronic hepatitis C patients (1), VAT rather than BMI, was a significant predictor of hepatic
steatosis. Indeed, abdominal obesity markers, such as WC (21, 37), WHR (16, 37), VAT (4),
VAT/TAAT ratio (4), and Ab SAT (37) seem to be highly correlated with liver fat. In our
adjusting for age and BMI, higher VAT areas, as well as an increased SD were significantly
associated with liver fat, emphasizing the abdominal obesity relevance to liver lipotoxicity
(47). This relevance already suggested in previous observations (18), was clinically
reinforced in a recent study which reported that surgical VAT removal could reverse hepatic
IR (5). The link between abdominal adiposity and liver fat storage may be explained by the
fact that FFA are more easily mobilized from visceral AT rather than Ab SAT depots,
draining directly into the liver via portal circulation (17). The increased FFA liver influx
may induce hepatic steatosis, which might be responsible for other metabolic disturbances,
such as increased liver FFA and TG-rich lipoproteins synthesis, adipocyte proliferation
failure, insufficient hepatocyte FFA oxidation (26, 38, 47). In addition, liver lipotoxicity may
be accompanied by a low chronic inflammatory state, which can promote the future
progression to non-alcoholic steatohepatitis (NASH) (26). Despite evidence has been
demonstrating the VAT-derived FFA contribution to these pathophysiologic cascade, a
recent overview have also highlighted the role of FFA released from abdominal
subcutaneous adipocytes into systemic circulation to these hepatic disturbances (14). In this
context, the results of our study are consistent with some emerging observations (4),
suggesting that liver fat is associated not only with abdominal obesity, but can also reflect an
unfavourable metabolic syndrome profile.
Indeed, we observed that higher insulin, TG, liver transaminases, uric acid and PAI-1
concentrations were independently associated with a lower LSR. Furthermore, higher
TC/HDL-C and LDL-C/HDL-C ratios were also related with a lower LSR. These metabolic
markers remained significantly associated with liver fat, independently of VAT (data not
shown). Despite some evidence has been proposing that liver fat storage is normally
preceded by VAT accumulation, our results are consistent with other observations reporting
visceral adiposity (29, 45). In this sense, our results suggest that hyperinsulinemia,
hypertriglyceridemia and hypercholesterolemia are relevant to the metabolic cascade that
mediates liver disturbances in overweight and obese women. Other studies developed with
both insulin sensitive and insulin resistant subjects have also reported that liver fat was
associated with IR (4) and TG concentrations (4, 7). Another study with type 2 DM patients
reported that the presence of fatty liver was associated with higher degree of IR and
dyslipidemia (18). Hepatic steatosis has also been associated with dyslipidemia,
hyperinsulinemia, and IR, not only in obese subjects but also in lean subjects without
glucose intolerance (27). Although the role of diabetes in hepatic steatosis and in its
progression to NASH still remains unclear (26), the National Health and Nutrition
Examination Survey (NHANES-III) has reported that simple IR features, such as fasting
insulin, Hb A1c and C-peptide concentrations, as well as abdominal obesity markers were
independently associated with ALT concentrations, the most sensitive indicator of liver cell
integrity. In fact, increased liver transaminases concentrations are not only associated with
obesity severity, but can also predict the liver injury degree (25, 39). On the other hand, it is
noteworthy that hyperinsulinemia seems to play a key role in FFA metabolism and may
inhibit hepatocyte mitochondrial beta-oxidation, which can additionally contribute to liver
lipotoxicity. Furthermore, the inverse associations of both PAI-1 and uric acid with LSR
observed in our study emphasize the ectopic liver fat storage relevance to inflammatory and
atherothrombotic metabolic syndrome disturbances in overweight and obese women.
The role of some adipocytokines, such as leptin and TNF-α in hepatic steatosis has
been also increasingly study. Recent studies have reported that leptin can mediate lean body
tissues protection against lipotoxic damage (46), being also relevant in lipogenesis blocking,
and in muscle insulin-sensitization and fatty acid oxidation enhancement (46). However,
promote liver fat storage. On the other hand, inflammatory endotoxins, such as TNF-α and
IL-6, often overexpressed in obese patients or overweight subjects with type 2 DM, have
also been associated with liver fat and NASH pathogenesis (26). Contrarily to the observed
in a previous study with type 2 DM patients (18), in our study, nor LSR nor liver attenuation
were independently associated with leptin, IL-6, TNF-α, and any other inflammatory and
thrombotic risk factors studied.
The CT abdominal and thigh adipose and muscle tissue assessments, as well as the
broad list of metabolic features measured are some of the strengths of this study.
Additionally, participants were counseled to refrain from exercise at least 48 hours prior to
blood sampling, avoiding metabolic acute exercise interferences. However, there are some
limitations in our study that warrant reference. First, it is noteworthy that liver attenuation
obtained by CT cannot quantify absolute liver fat because attenuation of each voxel is a
function of its lipid, lean tissue and water composition. Therefore, variations in each one of
the components may change the resultant attenuation, adding difficulties in data
interpretation. Second, despite the rigorous protocol to obtain fasting blood samples, being
controlled the stage of menstrual cycle to avoid lipid profile variations induced by phase
changes, we did not control diet composition prior blood sampling.
In summary, contrarily to previous observations in type 2 DM patients, thigh
subfascial AT was independent and inversely associated with liver fat in overweight and
obese women, suggesting that this thigh AT compartment may play a preventive role against
detrimental ectopic liver fat storage. Conversely, our results emphasize the contribution of a
higher BMI and visceral AT, especially if associated with hyperinsulinemia, dyslipidemia,
and an inflammatory and atherothrombotic profile to the metabolic cascade that mediates
ACKNOWLEDGMENTS
The authors are indebted to the staff from Health and Exercise Laboratory (Faculty of
Human Movement) for their assistance. A special thank to Dr. Alexandra Rodrigues for her
expertise, as well as to all the volunteers who participated in the research program.
GRANTS
This research was supported by the Portuguese Foundation for Science and
Technology grant (Grant Sapiens 358007/99). The Oeiras City Council, Becel Portugal,
Roche Pharmaceuticals Portugal, and Compal Portugal have also contributed with small
grants.
DISCLOSURES
REFERENCES
1. Adinolfi LE, Gambardella M, Andreana A, Tripodi MF, Utili R and Ruggiero G. Steatosis accelerates the progression of liver damage of chronic hepatitis C patients
and correlates with specific HCV genotype and visceral obesity. Hepatology 33:
1358-1364, 2001.
2. Angulo P, Keach JC and Batts KP. Independent predictors of liver fibrosis in
patients with nonalcoholic steatohepatitis. Hepatology 30: 1356-1362, 1999.
3. Bacon BR, Farahvash MJ, Janney CG and Neuschwander-Tetri BA.
Non-alcoholic steatohepatitis: an expanded clinical entity. Gastroenterology 107:
1103-1109, 1994.
4. Banerji MA, Buckley MC and Chaiken RL. Liver fat, serum triglycerides and visceral adipose tissue in insulin-sensitive and insulin-resistant black man with
NIDDM. Int J Obes 19: 846-850, 1995.
5. Barzilai N, Liu BQ and Vuguin P. Surgical removal of visceral fat reverses hepatic
insulin resistance. Diabetes 48: 94-98, 1999.
6. Bergman RN. Non-esterified fatty acids and the liver: why is insulin secreted into the
portal vein? Diabetologia 43: 946-952., 2000.
7. Bergstrom RW, Newell-Morris LL, Loeonetti DL, Shuman WP, Wahl PW and Fujimoto WY. Association of elevated fasting C-peptide level and increased intra-abdominal fat distribution with development of NIDDM in Japanese-American men.
Diabetes 39: 104-111, 1990.
8. Bjorntorp P. Do stress reactions cause abdominal obesity and comorbidities? Obes
Rev 2: 73-86, 2001.
9. Bjorntorp P and Rosmond R. Neuroendocrine abnormalities in visceral obesity. Int J Obes Relat Metab Disord 24 Suppl 2: S80-85, 2000.
10. Despres JP. The insulin resistance-dyslipidemic syndrome of visceral obesity: effect
on patients' risk. Obes Res 6 Suppl 1: 8S-17S, 1998.
11. Expert Panel on the Detection E, and Treatment of High Blood Cholesterol in Adults. Executive Summary of the Third Report of the National Cholesterol
Education Program (NCEP) Expert Panel on Detection, Evaluation, and Treatment of
High Blood Cholesterol in Adults (Adult Treatment Panel III). JAMA 285: 2486-2497,
2001.
12. Ferland M, Després J-P, Tremblay A, Pinault S, Nadeau A, Moorjani S, Lupien PJ, Thériault G and Bouchard C. Assessment of adipose tissue distribution by computed axial tomography in obese women: Association with body density and
anthropometric measurements. Br J Nutr 61: 139-148, 1989.
13. Frayn KN. Insulin resistance, impaired postprandial lipid metabolism and abdominal
obesity. A deadly triad. Med Princ Pract 11 Suppl 2: 31-40, 2002.
14. Frayn KN. Visceral fat and insulin resistance-causative or correlative? Br J Nutr 83: S71-S77, 2000.
15. Goodpaster BH, Thaete FL and Kelley DE. Thigh adipose tissue distribution is
associated with insulin resistance in obesity and in type 2 diabetes mellitus. Am J Clin
Nutr 71: 885-892, 2000.
16. Guzzaloni G, Grugni G and Minocci A. Liver steatosis in juvenile obesity: correlations with lipid profile, hepatic biochemical parameters and glycemic and
insulinemic responses to an oral glucose tolerance test. Int J Obes 24: 772-776, 2000.
between visceral adiposity and hepatic insulin resistance. Am J Physiol Endocrinol Metab 288: E454-461, 2005.
18. Kelley DE, McKolanis TM, Hegazi RA, Kuller LH and Kalhan SC. Fatty liver in type 2 diabetes mellitus: relation to regional adiposity, fatty acids, and insulin
resistance. Am J Physiol Endocrinol Metab 285: E906-916, 2003.
19. Kelley DE, Thaete FL, Troost F, Huwe T and Goodpaster BH. Subdivisions of
subcutaneous abdominal adipose tissue and insulin resistance. Am J Physiol
Endocrinol Metab 278: E941-948, 2000.
20. Kirschner MA and Samojlik E. Sex hormone metabolism in upper and lower body
obesity. Int J Obes 15: 101-108, 1991.
21. Knobler H, Schattner A and Zhornicki T. Fatty liver - an adittional and treatable
feature of the insulin resistance syndrome. Q J Med 92, 1999.
22. Lemieux I, Pascot A, Couillard C, Lamarche B, Tchernof A, Almeras N,
Bergeron J, Gaudet D, Tremblay G, Prud'homme D, Nadeau A and Despres JP. Hypertriglyceridemic waist. A marker of the atherogenic metabolic triad
(hyperinsulinemia; hyperapolipoprotein B, small, dense LDL) in men? Circulation
102: 179-184, 2000.
23. Lemieux S, Despres JP, Moorjani S, Nadeau A, Theriault G, Prud'homme D, Tremblay A, Bouchard C and Lupien PJ. Are gender differences in cardiovascular
disease risk factors explained by the level of visceral adipose tissue? Diabetologia 37:
757-764, 1994.
24. Lohman TG, Roche AF and Martorell R. Anthropometric standardization reference manual. Champaign, IL: Human Kinetics Publishers, 1988.
25. Luyckx FH, Desaive C and Thiry A. Liver abnormalities in severely obese subjects:
effects of drastic weight loss after gastroplasty. Int J Obes 22: 222-226, 1998.
26. Luyckx FH, Lefebvre PJ and Scheen AJ. Non-alcoholic steatohepatitis: association
with obesity and insulin resistance, and influence of weight loss. Diabetes Metab 26:
98-106, 2000.
27. Marchesini G, Brizi M, Morselli-Labate A, Bianchi G, Bugianesi E, McCullough AJ, Forlani G and Melchionda N. Association of nonalcoholic liver disease with
insulin resistance. Am J Med 107: 450-455, 1999.
28. Mitsiopoulos N, Baumgartner RN, Heymsfield SB, Lyons W, Gallagher D and Ross R. Cadaver validation of skeletal muscle measurement by magnetic resonance
imaging and computed tomography. J Appl Physiol 85: 115-122, 1998.
29. Nguyen-Duy TB, Nichaman MZ and Church TS. Visceral fat and liver fat are
independent predictors of metabolic risk factors in men. Am J Physiol Endocrinol
Metab 284: E1065-E1071, 2003.
30. Nicklas BJ, Penninx BW and Ryan AS. Visceral adipose tissue cutoffs associated
with metabolic risk factors for coronary heart disease in women. Diabetes Care 26:
1413-1420, 2003.
31. Pierkarski JGHI, Royal SA, Axel L and Moss AA. Difference between liver and spleen CT numbers in the normal adult: its usefulness in predicting the presence of
diffuse liver disease. Radiology 137: 727-729, 1980.
32. Rebuffe-Scrive M, Enk L, Crona N, Lonnroth P, Abrahamsson L, Smith U and Bjorntorp P. Fat cell metabolism in different regions in women. Effect of menstrual
cycle, pregnancy, and lactation. J Clin Invest 75: 1973-1976, 1985.
33. Rexrode KM, Carey VJ, Hennekens CH, Walters EE, G.A. C, Stampfer MJ, Willet WC and Manson JE. Abdominal adiposity and coronary artery disease in
34. Rinella ME, Alonso E and Rao S. Body mass index as a predictor of hepatic
steatosis in living liver donors. Liver Transpl 7: 409-414, 2001.
35. Ross R, Aru J, Freeman J, Hudson R and Janssen I. Abdominal adiposity and
insulin resistance in obese men. Am J Physiol Endocrinol Metab 282: E657-E663,
2002.
36. Ross R, Goodpaster B, Kelley D and Boada F. Magnetic resonance imaging in human body composition research. From quantitative to qualitative tissue
measurement. Ann N Y Acad Sci 904: 12-17, 2000.
37. Sabir N, Sermez Y, Kazil S and Zencir M. Correlation of abdominal fat
accumulation and liver steatosis: importance of ultrasonographic and anthropometric
measurements. Eur J Ultrasound 14: 121-128, 2001.
38. Scheen AJ and Luyckx FH. Obesity and liver disease. Best Pract Res Clin Endocrinol Metab 16: 703-716, 2002.
39. Schindhelm RK, Diamant M, Dekker JM, Tushuizen ME, Teerlink T and Heine
RJ. Alanine aminotransferase as a marker of non-alcoholic fatty liver disease in
relation to type 2 diabetes mellitus and cardiovascular disease. Diabetes Metab Res
Rev, 2006.
40. Smith S and Ravussin E. Emerging paradigms for understanding fatness and diabetes
risk. Curr Diab Rep 2: 223-239, 2002.
41. Snyder WS, Cook MJ, Nasset ES, Karhausen LR, Howells GP and Tipton IH.
Report on the task group on reference man. Oxford: Paergamon Press, 1984.
42. Tanko LB, Bagger YZ, Alexandersen P, Larsen PJ and Christiansen C. Central and peripheral fat mass have contrasting effect on the progression of aortic
calcification in postmenopausal women. Eur Heart J 24: 1531-1537, 2003.
43. Tatsukawa M, Kurokawa M, Tamari Y, Yoshimatsu H and Sakata T. Regional fat deposition in the legs is useful as a presumptive marker of antiatherogenesity in
Japanese. Proc Soc Exp Biol Med 223: 156-162, 2000.
44. Teixeira PJ, Palmeira AL, Branco TL, Martins SS, Minderico CS, Barata JT, Silva AM and Sardinha LB. Who will lose weight? A reexamination of predictors of
weight loss in women. Int J Behav Nutr Phys Act 1: 12, 2004.
45. Tiikainen M, Tamminen M and Hakkinen AM. Liver-fat accumulation and insulin
resistance in obese women with previous gestational diabetes. Obes Res 10, 2002.
46. Unger RH. Leptin physiology: a second look. Regul Pept 92: 87-95, 2000.
47. Unger RH. Weapons of lean body mass destruction: the role of ectopic lipids in the
metabolic syndrome. Endocrinology 144: 5159-5165, 2003.
48. Van Steenbergen W and Lanckmans S. Liver disturbances in obesity and diabetes
mellitus. Int J Obes 19: S27-S36, 1995.
49. Yamauchi T, Kamon J, Minokoshi Y, Ito Y, Waki H, Uchida S, Yamashita S, Noda M, Kita S, Ueki K, Eto K, Akanuma Y, Froguel P, Foufelle F, Ferre P, Carling D, Kimura S, Nagai R, Kahn BB and Kadowaki T. Adiponectin stimulates glucose utilization and fatty-acid oxidation by activating AMP-activated protein