A Work Project, presented as part of the requirements for the Award of a Masters Degree in Finance from the NOVA – School of Business and Economics.
Capital Requirements and Loan Market Conditions Insight into the Portuguese Banking System (2004-2011)
Mariana Almeida Escada da Costa Student Number #332
A Project carried out on the Financial Management course, under the supervision of: Professor Leonor Ferreira
Title:
Capital Requirements and Loan Market Conditions Insight into the Portuguese Banking System (2004-2011)
Abstract:
Capital Requirements have been gaining importance in the current macroeconomic and financial environment and Portugal is no exception. Nonetheless, despite the several
media articles on this subject, the associations with Loan Market Conditions, namely
availability and pricing are still unstudied. Thus, this project adds to the existing literature a characterization of Portuguese four biggest banks on capital reporting and requirements fulfillment. It is concluded that banks under analysis need to increase capital and that there is an association between the variables under study: Share Capital is negatively correlated with Credit Volume, and it is positively correlated with Net Commercial Income.
Key words:
1. Introduction
The capitalization of banks, following Basel III and more recently Troika’s Memorandum of Understanding (MoU), is a subject of major relevance for Portuguese Banking System (BS). On June 2011 earnings release1, none of the Portuguese Financial Institutions (FI) was able to accomplish the announced Capital Requirements, which foresees that banks will have to act in order to achieve the required ratios. Indeed, due to the higher costs associated with issuing equity rather than debt2, FI’ managers prefer to hold less equity as possible, implying that the amount of bank equity is established by the bank Capital Requirements (Mishkin, 2000). Therefore, the aim of this project is to evaluate if banks’ response will transfer the cost of increasing Own Funds to customers, through Loan Market Conditions, namely availability and pricing, rather than be supported by shareholders, as in a full competitive market. Furthermore, despite the alternatives, this project’s focus is made on increasing capital ratios through new shares, since this is the alternative that most reflects shareholders’ interests. Additionally, this project focuses a hypothetical analysis of banks being required to accomplish Capital Requirements on the date of the last available results (June 2011). As such, this project consists on evaluating the capital needs of Portuguese FI and on the assessment of its associations with Loan Market Conditions. To the best of our knowledge, in Portugal, there is still no study regarding Solvency and FI’ needs of
1According to 2011’s semi-annual results, released by Portuguese Financial Institutions. 2
Cost of capital is a term used to refer to the cost of a firm’s financing. If computed through the
Weighted Average Cost of Capital (WACC), it weights both equity and debt on its cost of equity and cost of debt, respectively. The formula of WACC is described below:
capital. Nevertheless, it is undeniable the interest this issue has been raising given the current economic and financial environment.
Regarding the structure of this project, Section 2 presents the definition of key concepts and the review of legal framework, while Section 3 presents the review of the literature. Section 4 provides the research questions and the methodology used. Section 5 includes the discussion of the results. Finally, Section 6 abridges the conclusions, addresses contributions to banks’ stakeholders and adds suggestions for possible future research. 2. Theoretical and Legal Framework
2.1. Theoretical Framework
This section defines the key concepts relevant for this research. Figure 1 aims to present a summary of how this project is constructed and how key concepts are related.
Share Capital as the major Own Funds’ component Basel III and Troika’s
Capital Requirements Increase Own Funds
Is Credit Volume associated to Share Capital? Is Net Commercial Income
associated to Share Capital? Decrease
RWA
Capital Requirements are the standardized prerequisites established for FI with
regards to capital ratios of Own Funds over Risk-Weighted Assets (RWA)3. The capital ratios defined by Basel Committee are derived from Own Funds’ decomposition: Solvency Ratio (Own Funds/RWA), Tier 1 ratio (Tier 1 capital/RWA), Tier 2 ratio (Tier 2 capital/RWA) and Core Tier 1 ratio (Core Tier 1 capital/RWA). The main goal for imposing a minimum level is to safeguard such institutions from operational losses and from increasing the risk of default associated with holding certain investments. To accomplish higher Capital Requirements, it is possible to issue extra shares (in order to
3
Risk Weighted Assets measures the amount of a financial institution’s assets, adjusted for risk.
raise additional money), to diminish their balance sheets’ size or to decrease their loans’ riskiness (Lilico, 2011). The scope of this project is made on the former, meaning that, when necessary, it is assumed a non-decreasing RWA.
Own Funds of a FI shall be the amount of equity like instruments that it is required to
maintain in order to be able to meet its creditors’ obligations even in the most extreme occurrences. Own Funds are equal to the sum of Primary Capital (Tier 1 capital) and Complementary Own Funds (Tier 2 capital minus Deductions)4. Within Tier 1 capital, Core Tier 1 capital has to be referred, since it is the top-quality capital a FI may hold; it is mainly constituted by Share Capital and Retained Earnings, whereas Tier 1 capital, besides those components, integrates also preferred stocks. A strong and stable bank, with an adequate capitalization, should have its Own Funds mainly constituted by Tier 1 funds. Solvency ratio determines the capacity of an institution to meet its commitments over the medium term, reflecting the risk that creditors run, by weighting the institution’s Own Funds on its RWA.
Share Capital corresponds to a company’s total shares that are held by shareholders,
being the main component of Core Tier 1 capital. Being so, it is the portion of Own Funds that better reflects shareholders’ interests, risk and return of agents with control over the banks’ strategy. For the purpose of this project, Share Capital Requirements refer to the Capital Requirements that entails shareholder to increase Share Capital.
Loan Market Conditions refers to the price and availability of credit granted by FI.
The former corresponds to Net Commercial Income5 a measure of banks’ profitability,
which comprises both the net result of interest paid and received and the net result of commissions paid and received. In this sense, since banks can directly affect the prices
4According to Notification 6/2010 issued by the Bank of Portugal (BdP). For a more detailed description
of Own Funds’ composition, see Appendix 1.
5
supported by customers, in interests and commissions, it can be considered as the best proxy to understand the impact on customers and a powerful tool to control shareholders’ costs6
. The later refers to Credit Volume7, the amount of loans granted to
customers. It is expected that when banks are required to raise capital, the credit volume decreases (Ackerman, 2011), either because banks desire to decrease their balance sheets, either because they aim to diminish the riskiness of their loans and, for that reason, are more strict when granting credit to customers.
Agents (or stakeholders) refer to parties that influence or are influenced by the actions
of a financial institution. Given the extent of this project, the interest will fall on two categories of agents, namely customers and shareholders. The former refers to people using banks’ services and consequently are indirectly exposed to changes within the bank, such as the accomplishment of Capital Requirements of the Banking International Authorities. On the other hand, the later are the ones legally owning part of the financial institution and having a residual claim on the firm’s assets. For that reason, are the ones exposed to major risks and should be the ones gaining more when FI are performing better, as well as the ones incurring in higher losses when FI face more complicated situations8, as will be the case when dealing with the required capital increases.
2.2. Regulatory Framework
The Regulatory Framework described in this section comprehends both Supranational and National regulations.
6The choice for Net Commercial Income rather than Net Income is related to the fact that it is only
relevant to assess the variables which are associated to the bank core-activity as well as those that may be influenced by shareholders. For instance, trading activities are affected by market, not by shareholders.
7Credit Volume may also be referred as availability of credit or availability of banking products.
8Accordingly to Capital Asset Pricing Model (CAPM), in which potential return augments with
In order to avoid deficiencies in the financial system, an unstable channel of contagion exposed by the global financial crisis, Basel III framework (2010), developed by the Basel Committee on Banking Supervision, materializes as an improvement of the previous Basel I (1988) and Basel II (2004). The different frameworks’ evolution and their characteristics is described in Appendix 2.
Regulators believe that reinforcing banks’ capital, rather than paying out earnings, is the right thing to do to build a solid and robust financial system. Yet, this framework is being criticized since it might compromise several issues of the economy: the most important of all regards the increase of FI’ marginal cost of capital, since banks benefit from being highly leverage as they can deduct debt interest. The Institute of International Finance goes further and estimates that Basel III’s Capital Requirements will lead to the major economies being 3% smaller than they otherwise would be in five years and will cost 7.5 million jobs (Elliot, 2010). Different arguments suggest that Basel III will destroy any emerging economy recovery. Indeed, some of the critics appointed are making success: concerning the liquidity rules, the eurozone sovereign debt crisis is redefining and adjusting the concept of safe assets (i.e. Greece’s bonds). Nonetheless, and accordingly to the Basel Committee, the lower growth rate during non-crisis years will be more than offset by a more stable and committed financial system, capable of avoiding truly stern recessions during financial crises.
At a supranational level, it is also important to mention the Capital Requirements Directive (CRD), officially adopted in June 2006, by the European Parliament and Council, which comprises Directive 2006/48/EC and Directive 2006/49/EC. The former regards credit risk, whereas the later determines the rules related to market risk and to the supervision of market and operational risks. CRD establishes that FI should disclose
the amount of Tier 1 capital resources, Tier 2 capital resources, Tier 39 capital resources, separate deductions from Tier 1 and Tier 2 and total Own Funds. Under CRD II10, an amendment of the previous directive which entered into force in the beginning of 2011, the disclosure of additional information is required, namely the amount of Core Tier 1 capital, with is composition’s desegregation11.
Not only Supranational regulation influences Capital Requirements, policies and information disclosure. Indeed, in the following of the external help request in April 2011 and the MoU signed between Portuguese Government and IMF12, ECB13 and EC14 (Troika), Portuguese FI are also entitled to accomplish additional and more austere Capital Requirements. Indeed, banking groups supervised by BdP will have to reach a Core Tier 1 capital ratio of 9% by the end of 2011 and a 10% ratio by the end of 2012, maintaining it thereafter15.
On the other hand, concerning information disclosure, CMVM16 plays an important role on corporate laws’ supervision and enforcement. CMVM Regulation 1/201017
compels companies to deliver a Corporate Governance Report, in which the disclosure of capital structure and dividend policy is required; for firms issuing shares, it is also required the
9Under Basel II, Tier 3 consisted mainly of subordinated debt and undisclosed reserves making part of
Own Funds’ composition. In the following of Basel III, Tier 3 was extinguished, being Own Funds only constituted by Tier 1 and Tier 2 capital.
10CRD II is composed by Directives 2009/11/EC, 2009/27/EC and 2009/83/EC.
11Furthermore, FI are also required to hold minimum reserves by the European Central Bank within the
framework of the Eurosystem’s minimum reserve system. The minimum amount of reserves is established in relation to its reserve basis. These requirements aim to stabilize money market interest rates as well as create/enlarge a structural liquidity shortage.
12International Monetary Fund 13European Central Bank 14European Commission
15 According to BdP’s notificaton 3/2011.
16Comissão do Mercado de Valores Mobiliários, which is the Portuguese Stock Market Authority. 17For a complete detail of CMVM regulation 1/2010 see Appendix 3.
availability of annual reports and accountability documents in the company’s website of at least the past five years18.
3. Literature Review
This section reviews the existing literature on possible associations between Loan Market Conditions and Capital Requirements, which is mainly constituted by articles, given the raising interest on the topic. On the contrary, given its current relevance, the papers regarding the subject are almost inexistent. Studies under review are grouped according to some criteria: first, the literature refers to the studies regarding the instability of financial markets with its intrinsic exposures and risks of contagion; secondly, to those concerning banks inadequate capitalization; and finally, to those related to the cost of bank equity and to the advantages and disadvantages of increasing FI’ capital ratios.
FI’ efficiency, particularly banks’, is crucial to maintain the stability of financial markets (Berger, 2009). Nonetheless, in a financial system genuinely connected throughout an opaque network of financial exposures, where debt is growing at a faster pace than equity and leverage is harshly increasing all over the world, even a small decrease in asset value can lead to distress and potential in Solvency (Adrian and Shin, 2009). The financial crisis of the recent years proved that no country is an island. Indeed, cross-border capital raisings contributed not only for augmenting the economies’ exposure, but also for the risk of contagion, an unknown reality until some years ago (Hale, 2011). Nocera (2011) advocates that one possible explanation for this crisis relies in the banks’ lack of adequate Capital Requirements and in the holding of so much catastrophic debt. In fact, Salmon’s (2010) confirms that, if left to their own
18According to Decree Law Nr. 35/2005 of the Portuguese Companies Business Law (Código das
judgment, FI will always hold as much debt as possible, as they tend to trust each other to a great extent, having faith in being able to exit any given interbank position overnight in case of something going wrong. This crisis diverges from such perspective; in order to increase banks’ stability, more equity is needed, despite constraining their ability to grant loans to the rest of the economy (Ackerman, 2009).
Nonetheless, Elliot (2010) contradicts this perspective by stating that even a sizeable increase of Capital Requirements will imply only a 0.2% increase on the average loan pricing. Additionally, Admati et. al. (2010) sustain that bank equity is not expensive: as a matter of fact, although equity has a higher required return than debt, using a greater proportion of equity will reduce the riskiness of a bank’s equity. These authors also support that Capital Requirements do not force banks to stop lending; indeed, they only entail banks to fund with a higher proportion of equity, improving the economy, since lower leverage banks create better incentives and fewer distortions and, as they state, more private ownership of downside risk. Miles (2011) corroborates this perspective, by stating that better-capitalized banks are more robust as well as more capable to withstand losses on their assets. Moreover, replacing debt with equity can actually be much more straightforward than it seems, since holders of existing bank equity and debt may desire to preserve the underlying characteristics of their initial portfolios. As a result, reallocating the way that risk is borne by different investors need not have any direct effects on the overall funding cost of the bank, except if securities are mispriced. Regardless of the several perspectives highlighted, it is irrefutable that equity and debt do not entail the same cost and, despite all the potential benefits, shifting debt to equity always implies incurring in some expenses. Regarding the existing literature, while some studies are more descriptive, others present a more detailed analysis; while some
stress the quantity (either absolute or relative) of debt held by FI, others focus in the cost of financing; finally, while some are national based, others are focused in international financial system or in international comparisons. However, and to the better of our knowledge, concerning Portuguese BS, despite the existing studies19, those focusing on Capital Requirements and on the existing relationships between Loan Market Conditions and required capital increases are nonexistent. Nonetheless, it is undeniable the interest this issue has been rising, especially throughout the current worldwide financial crisis and all the Capital Requirements FI have been entailed to accomplish. As a result, aiming to fill the existent gap, this project emerges, being the first empirical research to study Capital Requirements within the Portuguese BS, namely FI’ response regarding Loan Market Conditions when shareholders are required to reinforce capital ratios, for the period between June 2004 to June 2011.
4. Methodology and Data
This section states the research questions to be answered, discusses methodological issues as well as the procedures used to collect data for this project. Finally, it characterizes the banks under analysis.
4.1. Research Questions
The main purpose of this project is to give a greater insight into the key Portuguese FI, perceiving the capital needed to accomplish both Basel and Troika’s requirements and if price and availability of banking products is related to capital needs, the Fundamental
Research Question being as follows:
Do Loan Market Conditions and Capital Requirements Relate?
19For instance, BONFIM, Diana, DAI, Qinglei, FRANCO, Francesco, 2010, “Banking relationships and
In this sense, the first four research questions (RQ) aim to consolidate and gather raw data from the reports. Afterwards, the variables will be combined to develop some relationships. In order to depict FI, their levels of capitalization and their capital needs to accomplish the established requirements, univariate analysis of these variables is discussed below. Following a brief characterization of the Portuguese banks under analysis, through its Size, Core Profitability and Solvency20’s breakdown during the period of study (June 2004-June 2011), five questions are addressed, as follows:
RQ1: What capital ratios are banks disclosing? RQ2: Are banks fulfilling Capital Requirements? RQ3: Do sources of Own Funds diverge among banks?
RQ4: How much would be the necessary capital increase of banks to accomplish
Capital Requirements?
These four questions serve the purpose of depicting the Portuguese FI.
Aiming to extend the study and to improve the knowledge on Portuguese FI, bivariate analysis is performed: correlation coefficients21 are computed in order to verify the existence of associations between some variables. The first analysis regards changes in Credit Volume and changes in Share Capital, aiming to confirm the existing literature, which suggests that Capital Requirements constrains the availability of credit. Furthermore, in order to understand the extent to which the price of banking products is related to capital increases, it is computed the correlation coefficient between changes in Net Commercial Income and changes in Share Capital, suggesting that, if positively
20
For this analysis, Net Assets, Net Commercial Income and Own Funds were considered and maximums, minimums, averages and standard deviations were computed. The main results are presented in Section 4.2.
21The correlation coefficient
x,ybetween two variables (X and Y) is defined as x,y
cov( x, y)
xy
, where cov is the covariance between the two variables andxandyare the standard deviations.
correlated, shareholders are able to transfer part of its costs to customers22. As a result, two additional research questions which support the fundamental research question are:
RQ5: Is Credit Volume associated to Share Capital in banks?
RQ6: Is Net Commercial Income associated to Share Capital in banks?
4.2. Data
Out of the 49 banks in the Portuguese FI23 this research analysis the four biggest: BCP24, BES25, BPI26 and CGD27, the first three being public companies, whereas CGD is a State-owned company., The banks’ financial reports were gathered in two sources: at the CMVM’s website and at APB’s website and the same information was checked for validity purposes28. The analysis covers the period between June 2004 and June 2011, and annual and semi-annual information reported. Bearing in mind the unavailable information regarding capital ratios, it was not possible to extend this study to data prior to June 2004. Furthermore, IFRS29 accounting standards have only been mandatorily implemented in 2005, making backwards data not appropriate for comparative purposes.
This project analyzes the four biggest Portuguese banks. The rationale behind this narrowness is that these banks are a good proxy of the Portuguese BS, since they
22See Appendix 5, for the evolution of Share Capital, Credit Volume and Net Commercial Income. 23
In December 2010, according to Associação Portuguesa dos Bancos (APB), which is the main body representing the Portuguese BS.
24Banco Comercial Português, S.A. 25Banco Espírito Santo, S.A. 26Banco Português de Investimento, 27Caixa Geral de Depósitos, S.A.
28When collecting the data, a database was created, in Excel format, with the relevant data collected from
the reports, related to the variables under analysis. This database is a contribution of this research.
29
International Financial Accounting Standards (IFRS) are the guidelines established by the International Accounting Standard Board (IASB) in order to allow international comparisons between financial statements. Concerning the use of IFRS for the Portuguese case, the Decree Law Nr. 35/2005 states that all companies listed in a regulated European market will prepare their consolidated accounts according to IFRS from 2005 onwards, following EU Regulation 1606/2002.
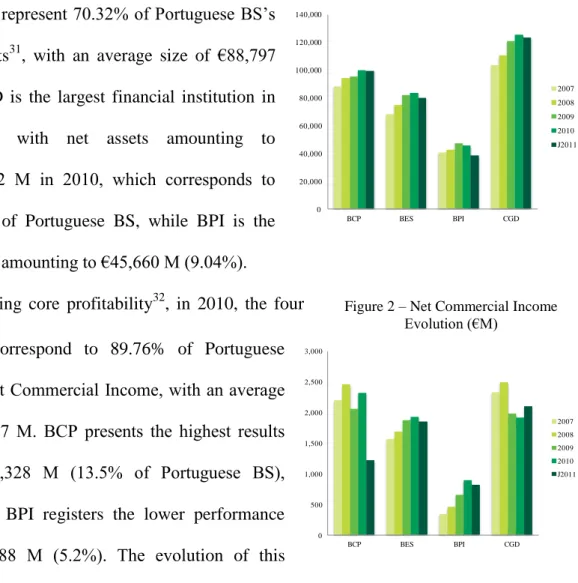
Figure 1 – Net Assets Evolution (€M) 0 20,000 40,000 60,000 80,000 100,000 120,000 140,000 BCP BES BPI CGD 2007 2008 2009 2010 J2011
Figure 2 – Net Commercial Income Evolution (€M)
represent the majority of its composition (see the analysis below)30. A note should be made that the scope of this project focus healthy banks and those capable of issuing capital by themselves, meaning that capital increases supported by the Government and consequently by taxpayers are not considered. On the other hand, Portuguese BS is not considered for the purpose of this study, since one of the goals is to discover and analyze possible differences among the different institutions. This section compares the composition of the four banks, regarding its Size, Core Profitability and Solvency. Regarding size, in 2010, the four banks under
analysis represent 70.32% of Portuguese BS’s net assets31, with an average size of €88,797 M. CGD is the largest financial institution in Portugal with net assets amounting to €125,862 M in 2010, which corresponds to 24.92% of Portuguese BS, while BPI is the smallest amounting to €45,660 M (9.04%).
Concerning core profitability32, in 2010, the four banks correspond to 89.76% of Portuguese BS’s Net Commercial Income, with an average of €1,767 M. BCP presents the highest results with €2,328 M (13.5% of Portuguese BS), whereas BPI registers the lower performance with €888 M (5.2%). The evolution of this
30Although being significant within the context of Portuguese BS, Santander was excluded from this
study, since it is a Spanish bank.
31The data concerning Portuguese BS was gathered from APB. The analysis is made for December 2010,
since, APB had not yet published Portuguese BS’ data for June 2011.
0 500 1,000 1,500 2,000 2,500 3,000 BCP BES BPI CGD 2007 2008 2009 2010 J2011
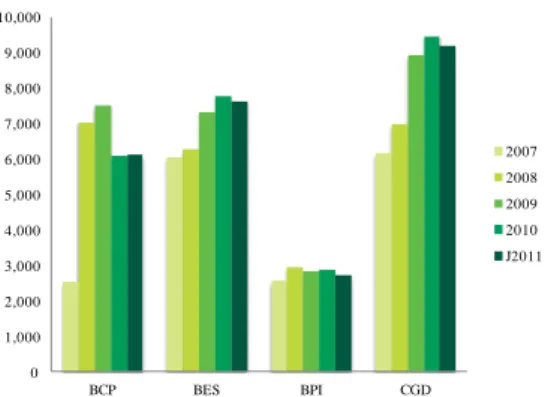
Figure 3 – Own Funds Evolution (€M) 0 1,000 2,000 3,000 4,000 5,000 6,000 7,000 8,000 9,000 10,000 BCP BES BPI CGD 2007 2008 2009 2010 J2011
indicator differs across different banks: while BES and BPI have been constantly presenting higher results, CGD reveals the opposite behavior, with decreasing results. With regards to Solvency, in 2010, the four
banks represent 72.30% of Portuguese BS’s Own Funds, with an average of €6,575 M. CGD is the bank with the highest Own Funds, with €9,226 M (25.8% of Portuguese BS), at the same time as BPI presents the smallest amount with €2,902 M (7.9%)33
. Regarding evolution, all banks register a decrease in the year 2011, mainly due to the Complementary Own Funds’ decrease. On the contrary, BCP is the only one presenting a slightly increase mainly due to the share capital increase on April 2011, which amounted to circa €1,350 M.
From the previous analysis, it is concluded that the four banks differ in Size, Core Profitability and Solvency, foreseeing differences among them when dealing with Capital Requirements’ accomplishment.
5. Results
This section presents the answers to the research questions announced in Section 4. Capital Ratios Disclosure (RQ 1)
Before 2007, FI were not required to disclosure information regarding capital ratios. Although not entailed to do so, Portuguese FI disclosed information regarding capital ratios. Essentially, they disclosed Own Funds’ desegregation, RWA and the several ratios (Core Tier 1, Tier 1, Tier 2 and Solvency). The one disclosing more information is BCP, while, on the contrary, CGD is the one disclosing less, in line with the described in Section Two (non-listed companies are not obliged to disclose the same amount of
32The operational performance regarding June 2011 was annualized in order to allow comparisons. 33These results are in line with the Net Assets’ analysis since the amount of Own Funds is directly related
Table 1 – Capital Ratios by Bank in June 2011 information). For that reason it does not disclose semi-annual reports from 2006 backwards. After 2007, in line with CRD, FI are entailed to do so. From the required capital disclosures, Tier 1 and Own Funds are the ones more frequently disclosed (27 compliances against 32 possible34): BCP has disclosed this information in every period under analysis, BES failed in June2008, BPI in June2007 and CGD failed more often (three times: June2007, June2008 and 2008). Tier 2 and Deductions are disclosed 56.3% of the times; however Deductions are not disclosed in accordance with CRD, since they are not disaggregated between Tier 1 and Tier 2’s deductions. Moreover, there are several cases, with exception for CGD, in which banks presents deductions together with Tier 2, also not complying with the European Directive. Regarding Tier 3, from 2004 to 2011, no bank complied with this item35. From 2011 onwards, CRD II is the new directive in force and consequently banks have to disclose additional information regarding Core Tier 1 resources and its desegregation. BCP is the only one not disclosing the amount of Core Tier 1 capital; it only discloses the Core Tier 1 ratio and CGD only discloses the amount of Core Tier 1 resources without detail. From the remaining, BES and BPI are the only ones fully complying with this directive. Summing up, Portuguese FI still have to improve the disclosure of information to comply with CRD. Nevertheless, there are differences among the four banks, with BPI fulfilling the majority of the requirements, and BES fulfilling fewer requirements.
Capital Requirements Fulfillment (RQ 2)
The analysis of capital ratios shows that Portuguese FI need to reinforce their capital structure. Bearing in mind the Capital Requirements referred in Section 2, if those requirements were to be accomplished at the date of the last available results (June 2011), BCP would be failing both Troika’s Core Tier 1 requirement for December 2011 (8.50% vs. 9%) and Basel’s
Solvency for 2013 (10.48% vs. 10.5%), while BES and CGD would
be failing Core Tier 1 (8.21% and 8.40%, respectively). Finally BPI, despite being the
34Between June 2007 and December 2010, there are eight semi-annual periods and since there are four
banks under analysis, there are 32 possible compliances.
35
In the following of Basel III, Own Funds are only decomposed in Tier 1, Tier 2 and deductions.
Ratio Target BCP BES BPI CGD
Core Tier 1 9.00% 8.50% 8.21% 9.10% 8.40%
Tier 1 8.50% 9.31% 9.24% 9.60% 8.56%
Table 2 – Capital Needs by Bank (€M) in June 2011 only one fulfilling Core Tier 1 requisite, would not be able to accomplish with Solvency ratio (10.36%).
Main Sources of Own Funds (RQ 3)
The four banks present Core Tier 1 capital as the majority of its Own Funds’ composition, in line with the Capital Requirements’ regulation36
. Nevertheless, there are differences across them. Reinforcing the results of RQ 2, which shows that BPI is the only bank fulfilling Troika’s 9% Core Tier 1 requirement for end-of-year 2011, BPI also shows the highest proportion of top-quality capital composing its Own Funds, with 87.8% referring to Core Tier 1 in June 2011. On the opposite side, BES is the one with the smallest proportion of Core Tier 1 capital (71.2%), whereas BCP and CGD present 81.1% and 73.4% respectively. Bearing this in mind, it is anticipated that when banks are called to raise capital, they will have to act differently: while BCP, BES and CGD will have to care about their Primary Capital, choosing a higher quality form of equity, BPI will have to act within their Complementary Own Funds, a much easier task than the former.
Required Capital Increase (RQ 4)
To find out the necessary amount of capital needed to achieve Basel and Troika’s directives, a simple exercise was
made. Assuming that banks would maintain their RWA unchanged37, it is computed the minimum necessary capital to accomplish with the Capital Requirements. As mentioned previously, since Core Tier 1 capital is mainly composed by Share Capital, the capital better reflecting shareholders’ interest, what matter for the purpose of this project is to
36For the complete analysis of Own Funds’ composition of each bank, see Appendix 4.
37As mention in the beginning, for the purpose of this work project it is assumed a non-decreasing RWA,
since the increase of capital ratios is only explored through the improvement of banks’ Own Funds.
Capital Needs BCP BES BPI CGD
Core Tier 1 292.16 523.44 n.a. 429.08
Tier 1 n.a. n.a. n.a. n.a.
Table 3 – Correlation Coefficients
understand the lack of capital regarding Core Tier 1. In line with the previous RQ, banks will have to act differently when called to raise capital. Being so, since BES and CGD already accomplish Solvency ratio, one possible and efficient strategy is to reallocate their Own Funds’ structure, transferring Complementary Own Funds to Primary Capital, in a total of €534.44 M and €429.08 M, respectively. On the other hand, BCP has firstly to increase its capital, either its Primary Capital or its Complementary Own Funds, amounting to €10.02 M, and afterwards reallocate €292.16 M from Tier 1 and Tier 2 capital in order to achieve the required proportion of top quality capital. Finally, since BPI already fulfills Core Tier 1 requirements, shareholders will not be affected by the required increase of Complementary Own Funds (of €36.29 M) to fulfill Solvency Ratio.
Association between Share Capital and Credit Volume (RQ 5)
Regarding the availability of credit granted by banks, the results confirm Ackermann’s theory that Capital Requirements constrain the credit volume, although this constraint diverges among bank. Indeed, while BPI shows almost no correlation, BCP, BES38 and GCD present negative correlations
(-39.08%, -4.41% and -17.06%, respectively). This may be explained by the former’s main
shareholder39 not having faced so restrictive liquidity constrains as the Portuguese. Nevertheless, it seems reasonable to assume the existence of a negative relationship between Credit Volume and Share Capital.
38BES announced an exchange of debt for capital transaction in November 2011, that if considered would
reinforce the negative correlation result.
39BPI’s main shareholder (30.10% of ownership) is Grupo La Caixa, the third largest Spanish bank.
BCP BES BPI CGD
Share Capital and Credit
Volume -39.08% -4.41% -0.38% -17.06% Share Capital and Net
Association between Share Capital and Price of Banking Products (RQ 6)
The computed correlations (see Table 3) show some association between changes in Net Commercial Income and changes in Share Capital: BCP, BES and BPI show positive correlations between these two variables (18.50%, 25.14% and 21.36%, respectively), suggesting that shareholders are transferring the cost of increasing capital to customers, by increasing commercial margins; on the contrary, CGD’s correlation coefficient is strongly negative (-89.94%), suggesting that shareholders are supporting the cost of increasing capital, which may be explained by the public interests of its shareholder, the State.
From the above, it may be concluded that there is an association between Loan Market Conditions and Capital Requirements. Regarding availability, customers are granted with fewer loans when shareholders are required to raise capital. On the other hand, referring to pricing, with CGD being the exception, customers perceive their commercial margins to increase.
6. Conclusion
This research is a contribution to Portuguese Financial Institutions and to banks’ stakeholders, by establishing a starting point for the study of Portuguese banks’ Solvency and the impact of Capital Requirements. The aim of this project was to attain a greater knowledge on Portuguese banks’ capitalization and on their response to the recent increase on capital requirements. Given the financial crisis, the rising interest on the subject is evident, namely through the increasing number of articles in worldwide press. Nevertheless, still there is a lack of studies regarding banks’ response to Capital Requirements, particularly those concerning Portuguese Financial Institutions.
The research questions’ development and the research’s design, namely the choice of variables of study, were supported by the analysis of the theoretical and legal framework and previous empirical research, namely those suggesting that Credit Volume granted is constrained by Capital Requirements. The study was extended to the impact on the price of banking products, in order to understand the full associations with Loan Market Conditions.
Despite each bank’s specificities, it was concluded that banks were not fulfilling all the reporting requirements on capital ratios. Moreover, if banks would have to meet the required capital ratios as of June 2011, all banks analyzed, except BPI, would need to increase Share Capital. On this respect, this project concluded that there is an association between Loan Market Conditions and Capital Requirements, more specifically in case Share Capital is increased, which suggests that shareholders are able to transfer to customers part of the costs derived from increasing capital, through decreasing the availability of loans to customers and protecting its Net Commercial Income by increasing the price of banking products.
This project accomplishes the beginning of a study regarding relationships between some fundamental variables, namely Share Capital, Credit Volume and Net Commercial Income. Therefore, forthcoming research on the topic may use the database created by this research project, extending the analysis to more Portuguese banks. Additionally, it may also be expanded to other countries subject to Basel requirements and more years of study may be added. Furthermore, increases of Solvency may also be exploited through a perspective of decreasing assets, rather than focusing only on increasing Own Funds.
References
Ackermann, Josef. 2011. “Deutsche Bank CEO Criticizes EU Bank Capital Call”. Wall Street Journal. October 13.
http://online.wsj.com/article/BT-CO-20111013-704063.html. Date of Access: 14th October 2011.
Admati, Anat R., et. al.. 2010. “Fallacies, Irrelevant Facts, and Myths in the
Discussion of Capital Regulation: Why Bank Equity is Not Expensive”, Stanford GSB. Research Paper No. 2063, 1-7.
Admati, Anat., Pfleiderer, Paul. 2009. “Increased-Liability Equity: A Proposal to
Improve Capital Regulation of Large Financial Institutions”. Stanford University.
Graduate School of Business, 3-8.
Adrian, Tobias, Shin, Hyun S.. 2009. “The Shadow Banking System: Implications for
Financial Regulation”, Federal Reserve Bank of New York. Staff Report No. 382.
Berger, Allen N., Bouwman, Christa H.. 2009. “Bank Capital, Survival, and
Performance around Financial Crises”. Review of Financial Studies, 1-5.
Elizalde, Abel. 2006. “From Basel I to Basel II: An Analysis of the Three Pillars”. Cemfi, Working Paper No. 0704.
Elliot, Douglas J.. 2010. “Basel III, the Banks, and the Economy”. The Brookings Institutions,1-3.
Hale, Galina. 2011. “Evidence on Financial Globalization and Crisis: Capital
Raisings”, Federal Reserve of San Francisco: Working Paper Series, 3.
Jablecki, Juliusz. 2009. “The Impact of Basel I Capital Requirements on Bank
Behavior and the Efficacy of Monetary Policy”. International Journal of Economic
Sciences and Applied Research, 2, pp. 16-35.
Lilico, Andrew. 2011. “What Happens When Banks Are Required to Hold More
Capital?”. The Telegraph, 27 December. http://blogs.telegraph.co.uk/finance/andrew-lilico/100011733/what-happens-when-banks-are-required-to-hold-more-capital/. Date of Access: 29th December 2011.
Miles, Daves. 2011. “Banks Can Raise More Capital”. Wall Street Journal, July 1.
http://online.wsj.com/article/SB10001424052702304314404576411371850459168.html ?mod=googlenews_wsj. Date of Access: 20th September.
Mishkin, Frederic. 2001, “The Economics of Money, Banking and Financial Markets”. Addison-Wesley: Boston. 6th Edition. 227.
Nocera, Joe. 2011. “Banking’s Moment of Truth”. The New York Times, June 20.
http://www.nytimes.com/2011/06/21/opinion/21nocera.html?_r=3&ref=joenocera. Date of Access: 20th September 2011.
Salmon, Felix. 2010. “Why Regulators Should Be Tough on Bank Capital”. Reuters,
September 7. http://blogs.reuters.com/felix-salmon/2010/09/07/why-regulators-should-be-tough-on-bank-capital/. Date of Access: 20th September 2011.
Regulation
Basel Committee on Banking Supervision. 1999. “Capital Requirements and Bank Behavior: The Impact of the Basel Accord”. Basel.
Basel Committee on Banking Supervision. 2004. “International Convergence of Capital Measurement and Capital Standards: A Revised Framework.” Basel.
Decree Law 35/2005. 17th February. Diário da República. No 34.
Directive 2006/48/EC, 14th June, Official Journal of the European Union. L177/1. Directive 2006/49/EC, 14th June, Official Journal of the European Union. L177/201. Directive 2009/11/EC, 11th March, Official Journal of the European Union. L70/11. Directive 2009/83/EC. 27th July. Official Journal of the European Union. L196/14. Notification 1/2010. 1st February. Diário da República. No. 21, 4861-4865.
Notification 6/2010. 31th December. Diário da República. No. 253, 63818-63840. Notification 3/2011. 17th May. Diário da República. No. 95, 2129.
Portugal: Memorandum of Understanding on Specific Economic Policy Conditionality. 2011. 3rd May.
Appendix1 – BdP’s notification 6/2010 Elements Composition Primary capital (Tier 1) (+)Share capital; (+)Share Premium;
(+)Legal reserves and retained earnings;
(+)Net earnings from previous accounting periods40 and those from the previous exercise41; (+)Interim earnings from the current year;
(+)Reserves of foreign currency translation and hedging of net investment in operating foreign unit;
(+)Share of reserves and the results for deferred tax assets in extent that they are associated with losses as a negative element of Primary Capital; (-)Treasury shares;
(-)Intangible assets;
(-)Negative fair value reserve;
(-)Share of reserves and the results for deferred tax liabilities in extent that they are associated with gains as a positive element of Primary Capital; (-)Positive revaluation differences arising from the application of the equity method sheet;
(-)Value corresponding to weaknesses in the constitution of provisions in the terms set by BdP; (-)The amount of actuarial losses not yet recognized in the accounts;
(-)Deferred costs;
(-)Net profits resulting from the capitalization of future income from assets securitized, which improve the credit risk of the positions in the securitization; (+/-)Other instruments that may be approved by BdP.
Complementary Own Funds (Tier 2 minus Deductions)
(+)Elements consisting of the amounts actually realized, from the issuance of securities, in particular within indefinite maturity, and loans of non-graduates; (+)Elements capable of being freely used to cover risks;
(+)Provisions for general credit risks up to a maximum of 1.25% of weighted assets; (+)Reserves from revaluation of fixed assets and other positive revaluation reserves;
(+)Amounts of value adjustments and provisions exceeding the amount of losses expected for the same exposures, up to 0.6% weighted exposure risk; (+)Equity securities;
(+)Contracts to formalize subordinated loans, which (1)establish an irrefutable presumption that in the event of in Solvency or liquidation of the borrower repayment, the lender is subject to the prior repayment of all non-subordinated creditors, (2)issue an original maturity of not less than 5 years, (3)does not contain any provision for early repayment over the term of maturity;
(+)Paid-cumulative redeemable preference shares of a specified date;
(-)Elements encompassed in all of the above, for the value in the balance sheet.
40Earnings can only be considered for Own Funds’ composition if they have been determined in compliance with all applicable accounting standards, if they have been reduced by
the expected value of taxes, dividends and other equivalent charges, computed in proportion to the period to which they refer, and if they have been certified by an auditor.
Appendix 2 – From Basel I to Basel III
Reasoning behind Goals Main Measures Criticism
Basel I
-Increase the safety and reliability of the international BS -Set a level playing field for banking regulation
Thread of sovereign debt defaults
-Creates a system of bank asset classification
-Imposes a minimum capital requirement rule (Tier 1 capital ratio of 4% and capital of 8%)
-Non-OECD countries are assigned with a higher risk weighti -Low risk sensitiveness of its Capital Requirements leads to greater risk taking and regulatory capital arbitrage practices, supporting growth in securitization
-Unable to distinguish quality of credits
-Residual impact on the banks’ risk appetite decisions -Focus only on financial measures (neglecting risk management) Basel II -Better alignment to economic risks -Minimize regulatory arbitrage
-Envision greater levels of disclosure and
standards of transparency
Overcome Basel I’s drawbacks
Based on three major pillars: -Minimum capital
-Supervisory review -Market discipline
-Treats exposures very unequally depending on exposure characteristics -Treats banks very unevenly depending on sophistication of risk management systems, discouraging banks from lending to risky enterprises and encourage accumulating apparently risk-free assets, through the avoidance of measurable risks and into risks which are not easily measure.
Basel III
-Develop the ability to absorb shocks, making banks more capable to survive unexpected losses and less likely to need taxpayer rescue -Improve risk management and governance -Strengthen transparency and disclosures Overcome Basel II’s drawbacks
Compel banks to act within four major axels in a phase-in process beginning in 2013 (full implementation by 2019): capital, surcharge, liquidity and leverage, namely: -Core Tier 1 capital ratio of 7% (including a 2.5% capital conservation buffer);
-Incremental 0-2.5% countercyclical buffer in periods of excessive credit growth;
-Tier 1 ratio of 8.5% (also including a 2.5% capital conservation buffer);
-Systematically important FI should hold an additional 1.25% top quality capital of RWA;
-The ratio of Core Tier 1 capital to a bank’s total assets must exceed 3%, with no risk adjustment;
- Liquidity coverage ratio observation period starts in 2011, (minimum standards introduced in 2015);
-Net stable funding ratio observation period will start in 2012 (minimum standards introduced in 2018).
-Increases banks’ marginal cost of capital
-Studies estimate the major economies will be 3% smaller than they otherwise would be in 5 years and 7,5 million jobs will be sacrificed
Appendix 3 – CMVM Regulation
Regulation Topic Article Content CMVM
1/2010
Corporate
Governance Report
2 It establishes the delivery of a Corporate Governance Report, detailing about the company structure and corporate governance practices. CMVM 1/2010 Information disclosure Appendix 1
Companies should disclose information regarding capital structure, including shares not admitted to trading, and dividends policy, identifying the amount of dividend per share distributed in the past three exercises. Moreover, in the company’s website annual reports should be available, in addition with accountability documents, of at least the past 5 years.
Appendix 4 – Own Funds’ decomposition in June 2011
Total Amount % of Own Funds Total Amount % of Own Funds Total Amount % of Own Funds Total Amount % of Own Funds Total Amount % of Own Funds BCP €4,966.7 M 81,08% €5,441.0 M 88,83% €809.6 M 13,22% €-125.3 M -2,05% €6,125.3 M 100% BES €5,445.0 M 71,23% €6,127.0 M 80,15% €1,564.0 M 20,46% €-47.0 M -0,61% €7,644.0 M 100% BPI €2,387.9 M 87,82% €2,625.2 M 96,55% €294.7 M 10,84% €-200.9 M -7,39% €2,718.9 M 100% CGD €6,770.1 M 73,38% €6,846.0 M 74,20% €2,421.0 M 26,24% €-41.0 M -0,44% €9,226.0 M 100%
Core Tier 1 Tier 1 Capital Tier 2 Capital Deductions Own Funds
Appendix 5 – Share Capital, Credit Volume and Net Commercial Income Evolution by Bank
(M €) J2004 2004 J2005 2005 J2006 2006 J2007 2007 J2008 2008 J2009 2009 J2010 2010 J2011
Share Capital 3.931,8 3.931,8 3.931,8 4.458,6 5.493,0 5.493,0 5.493,0 5.493,0 5.878,0 5.878,0 5.877,9 5.886,7 5.886,7 5.886,7 7.136,7 Credit Volume 49.900,0 50.793,0 52.465,0 52.909,0 53.857,0 56.670,0 60.341,0 65.650,0 69.534,0 72.372,0 72.583,0 75.191,0 75.920,0 73.905,0 71.453,0 Net Commercial Income 1.016,6 2.062,7 1.044,8 2.066,4 1.057,1 2.144,3 1.063,2 2.201,9 1.209,6 2.461,5 1.022,2 2.065,9 567,2 2.328,4 611,8 Share Capital 1.800,0 1.800,0 1.800,0 1.800,0 3.170,4 3.168,9 3.168,9 3.168,9 3.168,9 3.168,9 4.586,6 4.585,4 4.585,4 4.585,4 4.585,4 Credit Volume 27.311,2 27.715,3 29.297,7 30.832,1 32.926,8 34.882,5 38.232,7 42.170,3 44.878,9 47.049,5 47.275,5 48.978,8 51.673,6 50.829,1 49.717,9
Net Commercial Income 553,9 1.099,3 539,6 1.164,2 617,5 1.298,3 728,7 1.565,6 797,1 1.685,4 981,8 1.881,0 917,1 1.933,3 927,5
Share Capital 1.027,8 991,3 991,3 991,3 991,3 991,3 991,3 991,3 1.341,3 1.341,3 1.341,3 1.341,3 1.341,3 1.341,3 1.431,3
Credit Volume 18.242,8 18.999,1 19.648,4 20.963,2 22.201,9 24.630,1 26.892,7 27.230,5 28.524,6 29.275,2 29.023,4 29.955,6 30.546,2 30.055,0 29.121,1
Net Commercial Income 340,3 351,8 141,0 598,0 462,7 38,1 258,0 82,8 224,1 233,5 289,0 361,8 431,2 457,1 410,8
Share Capital 2.450,0 2.950,0 2.950,0 2.950,0 2.950,0 2.950,0 2.950,0 3.100,0 3.100,0 3.500,0 4.500,0 4.500,0 4.500,0 5.050,0 5.050,0 Credit Volume 44.903,0 46.888,8 49.507,6 49.935,9 52.192,0 57.268,3 60.508,0 66.844,3 69.546,2 75.311,2 76.788,1 77.222,0 80.018,1 81.907,2 82.393,7 Net Commercial Income 769.968,3 1.607.664,0 920.609,5 1.684.869,0 924.610,0 2.052.113,0 1.102.947,0 2.334.003,0 1.237.379,7 2.499.939,0 1.162.034,0 1.980.711,0 933.847,2 1.917.573,1 1.049.876,7
BCP
BES
BPI