MASTERS OF SCIENCE IN
FINANCE
MASTERS FINAL WORK
PROJECT
EQUITY RESEARCH - COFINA SGPS
LOURENÇO PEREIRA BRANCO DE SOUSA COUTINHO
MASTERS FINAL WORK
PROJECT
EQUITY RESEARCH - COFINA SGPS
LOURENÇO PEREIRA BRANCO DE SOUSA COUTINHO
ADVISOR
PROFESSOR MARIA INÊS PINTO
ISEG - Equity Research Project - Cofina SGPS
2015
3
Resumo
A Cofina SGPS é actualmente uma das maiores e mais prestigiadas empresas a exercer
actividade no sector dos Media em Portugal. Fundada em 1995 e cotada em bolsa desde
1998, a Cofina começou por ser uma holding que geria várias participações nos mais
diversos ramos de actividade, desde os media, pasta de papel, metais entre outros. No
entanto, em 2005 foi realizado um spin off das suas participações, tendo esta ficado
apenas associada á área dos media, sobretudo na edição, impressão e publicação de
jornais e revistas. A Cofina é também reconhecida pela sua forte e sólida capacidade de
gestão, o que levou a empresa á liderança de vários segmentos do mercado dos media
em Portugal, através de um portfolio eficiente e equilibrado de publicações.
O principal objectivo deste projecto de Equity Research é determinar o valor intrínseco
das ações da Cofina, através de uma análise detalhada da performance da empresa nos
últimos anos e também através de uma análise fundamentada da evolução futura do
sector dos media em Portugal. A avaliação da empresa foi baseada no método dos Free
Cash Flows to the Firm e no WACC, uma vez que foi considerado o mais adequado ao longo do desenvolvimento da Revisão Literária. Não obstante, realizámos também uma
Relative Valuation de forma a complementar a avaliação.
Com base nos resultados obtidos, foi possível verificar que as ações da Cofina no dia 31
de Dezembro de 2014 estavam subvalorizadas. De acordo com as nossas estimativas, as
ações estavam a ser transacionadas a um preço de €0,47, abaixo do valor intrínseco de
€0,55, o que representa um potencial de valorização de 17%. Desta forma, a recomendação para qualquer investidor interessado na Cofina é de compra.
Palavras-chave: Sector dos Media, Equity Research, Avaliação, Free Cash Flows to
ISEG - Equity Research Project - Cofina SGPS
2015
4
Abstract
Cofina SGPS is currently one of the largest and prestigious companies operating in the
Portuguese Media & Publishing sector. Founded in 1995 and publicly listed since 1998,
Cofina was a Portuguese holding group of several companies operating in many
different sectors and business areas, such as media, pulp, steel between others. However
in 2005, there was a spin-off of its holdings and the company remained only associated
to the media printing and publishing sector, namely newspapers and magazines. Cofina
is also known for its strong management track record, which has driven the company to
the leadership of the main media segments in Portugal, through an efficient and
balanced portfolio.
The main goal of this Equity Research project is to determine the intrinsic value of
Cofina stocks, through a detailed analysis of the company performance in the last
couple of years and also through an accurate prospection of the media market for the
future. The valuation of the company was based on the Free Cash Flows to the Firm and
the WACC methodology which was considered the most suitable for the company
according to the literature review. In addition, we also performed a Relative Valuation
to complement our analysis.
Based on the results obtained, it was possible to verify that Cofina SGPS stocks on
31/12/2014 were undervalued. According to our estimates, the stocks were being traded
at €0.47, below the intrinsic value of €0.55, which represents a potential appreciation of 17%. Thus, we provide a buy recommendation to any investors interested into invest in
Cofina.
Keywords: Media & Publishing sector, Equity Research, Valuation, Free Cash Flows
ISEG - Equity Research Project - Cofina SGPS
2015
5
Preface
The conclusion of this Master thesis project represents the end of a very important path
of my academic life and the beginning of a new one, which would not be possible
without the contribution of the ones who were present to help me along this journey.
Thus, I would like to express my deep gratitude to all of them.
Particularly to Professor Inês Pinto for all the support, patience and availability during
the supervision and guidance of this project; to all my family especially to my dear
mother Rita Lacerda e Mello for all the love and care not only during this project but
also since the day I was born; and finally to all my colleagues and friends, in particular
to Francisca Simões de Almeida for all the positive energy transmitted on the most
ISEG - Equity Research Project - Cofina SGPS
2015
6 Table of Contents 1. Introduction ... 11 2. Literature Review ... 11 2.1 Valuation Methods ... 122.1.2 Discounted Cash Flows ... 12
2.1.1.1 Equity Valuation ... 14
2.1.1.2 Firm Valuation ... 17
2.1.2 Relative Valuation ... 20
2.1.3 Contingent Claim Valuation ... 21
3. COFINA, SGPS, S.A. ... 22
3.1 The Group ... 22
3.1.2 Portfolio ... 23
3.1.3 Corporate Structure ... 24
3.1.4 Shareholders Structure ... 24
3.1.6 Stock Market Performance: Cofina vs PSI 20 Index... 25
3.1.5 Financial Framework ... 25
4. Macroeconomic Outlook ... 29
5. Entertainment & Media Industry Overview ... 30
6. Five Forces Porter ... 33
7. SWOT Analysis ... 33
ISEG - Equity Research Project - Cofina SGPS
2015
7
9.1 Methodology ... 34
9.2 Assumptions for the Valuation Process ... 34
9.2.1 Operating Revenues ... 34
9.2.2 Operating Income (EBIT) ... 36
9.2.3 Capex, Depreciations and Amortizations ... 36
9.2.4 Net Working Capital ... 37
9.2.5 Risk free rate ... 38
9.2.6 Beta ... 38
9.2.7 Cost of Debt and Cost of Equity ... 38
9.2.8 Tax rate ... 39
9.2.9 Debt to Equity ratio ... 39
9.2.10 WACC ... 40
9.2.11 Perpetual Growth Rate ... 40
9.2.12 FCFF projections, Enterprise and Equity Value of Cofina ... 40
10. Valuation Results ... 41 11. Sensitivity Analysis ... 41 12. Relative Valuation ... 42 13. Conclusion ... 43 Bibliography ... 44 Appendixes ... 46
ISEG - Equity Research Project - Cofina SGPS
2015
8
Formulas Index
Formula 1 - Discounted Cash Flow... 13
Formula 2 - Terminal Value... 13
Formula 3 - Dividend Discount Model... 14
Formula 4 - Free Cash Flows to Equity... 15
Formula 5 - Constant Growth Model... 15
Formula 6 - Two stage Free Cash Flows to Equity Model... 16
Formula 7 - Cost of Equity... 16
Formula 8 - Beta I... 17
Formula 9 - Beta II... 17
Formula 10 - Free Cash Flows to the Firm... 18
Formula 11 - Enterprise Value... 18
Formula 12 - Weighted Average Cost of Capital... 19
Formula 13 - Adjusted Present Value... 20
Formula 14 - Unlevered Cost of Equity... 20
Formula 15 - pre-tax Weighted Average Cost of Capital... 20
Figure Index Figure 1 - Corporate structure... 24
Figure 2 - Shareholders structure... 24
Figure 3 - Stock market performance... 25
Figure 4 - Total Revenues weights... 26
Figure 5 - Financial structure... 28
ISEG - Equity Research Project - Cofina SGPS
2015
9
Figure 7 - Portugal newspaper's circulation and publicity revenues growth... 31
Figure 8 - Portugal magazine's circulation and publicity revenues growth... 32
Figure 9 - Cofina Porter's 5 Forces... 33
Figure 10 - Cofina Swot Analysis... 33
Figure 11 - Newspapers operating revenues... 35
Figure 12 - Magazines operating revenues... 35
Figure 13 - EBIT projections... 36
Figure 14 - Capex projections... 36
Figure 15 - Depreciations and Amortizations projections... 37
Figure 16 - Net Working Capital projections... 37
Figure 17 - Calculation of the pre-tax Cost of Debt... 38
Figure 18 - Cost of Equity calculation... 39
Figure 19 - Weighted Average Cost of Capital calculation... 40
Figure 20 - FCFF projections, Discounted CF's and Terminal value... 41
Figure 21 - Valuation results... 41
Figure 22 - Sensitivity analysis... 42
Figure 23 - Relative valuation results... 42
Table Index Table I - Relative Valuation multiples... 21
Table II - Cofina's Financial framework... 46
Table III - Macroeconomic outlook... 47
Table IV - Interest Coverage ratios and ratings for low capitalization firms... 47
ISEG - Equity Research Project - Cofina SGPS
2015
10
List of Terms and abbreviations APV - Adjusted Present Value
BoP - Bank of Portugal
CAGR - Compounded Annual Growth Rate
CF - Cash Flows
DCF - Discounted Cash Flow
DDM - Dividend Discount Model
DPS - Dividends Per Share
EBIT - Earnings Before Interest and Taxes
EBITDA - Earnings Before Interest and Taxes, Depreciations and Amortizations
EV - Enterprise Value
FCFE - Free Cash Flow to Equity
FCFF - Free Cash Flow to Firm
g - Growth rate in perpetuity
GDP - Gross Domestic Product
Kd - Cost of debt
Ke - Cost of Equity
Ku - Unlevered Cost of Equity
NWC - Net Working Capital
OPM - Option Pricing Models
PV - Present Value
PwC - PricewaterhouseCoopers
Rf - Risk Free
RV - Relative Valuation
ISEG - Equity Research Project - Cofina SGPS
2015
11
1. Introduction
This Equity Research is submitted in part fulfilment of the requirements for the degree
of master in finance at ISEG Lisbon School of Economics & Management. The main
goal of this project is to estimate the price target of Cofina stock and based on these
results, we aim to provide an adequate investment recommendation. Cofina is currently
one of the Portuguese media and publishing market leaders, listed since 1998 in the
Euronext Lisbon. During the last 20 years, the company has shown solid growth and
sustained results due to a competent management performance.
The project is divided in four essential sections, the literature review where we will
discuss and present some of the most common tools used to value a firm. The second
section presents the history of Cofina, where you can find an explanation of the core
business and an analysis of the financial framework and strategy, which also includes a
deep analysis of the Portuguese media sector. The third section was dedicated to the
valuation process where you can find the methodology discussed in the literature review
applied to our company, and the last one is composed by the conclusions which were
based on the results obtained.
According to Professor Aswath Damodaran the key point to value any firm
successfully, lies on our capacity to "understanding not only what value is but also the
sources of value" (Damodaran, 2002a).
2. Literature Review
Valuing a company is one of the most important tasks of all financial analysts,
consultants, and managers. It provides not only the pillars for their decision to buy or
sell a company, but it is also a very important tool for a solid management and
ISEG - Equity Research Project - Cofina SGPS
2015
12
According to Damodaran valuation plays many roles in many different areas such as
portfolio management, mergers and acquisitions and corporate finance. However in all
of those areas, the key to success lies on the capacity to combine the quantitative and
qualitative information of an asset, and in the accuracy to determine how much it is
going to be worth in the future (Damodaran, 2007). To perform a realistic valuation, it
is necessary to rely on data, thoughtful analysis and in the deep understanding of the
competitive dynamics of the industry (Koller et al, 2010).
When we are valuing a company it is not possible to define a unique formula, there are
several "perspectives on value that serve as the foundation for the variety of valuation
models and techniques available" as we are going to see along the literature revision
(Pinto et al, 2010).
2.1 Valuation Methods
Analysts can use a wide range of models to value an asset, ranging from the more
simpler to the more sophisticated. Each model has its different assumptions, however
they all share some common characteristics in general terms (Damodaran, 2012).
We can divide valuation in three different approaches, the Discounted Cash Flows
valuation methods, the Relative valuation methods and finally the Contingent claim
valuation methods (Damodaran, 2002a).
2.1.2 Discounted Cash Flows
As stated by (Damodaran, 2002b), the DCF's valuation methods "are the foundation on
which all other valuation approaches are built", in order to correctly perform all other
ISEG - Equity Research Project - Cofina SGPS
2015
13
The DCF methods seek to reach the company's value by estimating the cash flows it
will generate in the future and then discounting them at a discount rate matched to risk
of those flows (Fernández, 2001).
[1]
Where, CFi represents the cash flows generated by the company in period i, Vn is the
terminal value on year n, and k is the appropriate discount rate. The formula seems to
consider only a temporary duration for the flows, but that is not necessarily true since
the company's residual value in year n can be calculated by discounting future flows
after that period. The procedure for a non-defined duration consists in assuming a
constant perpetual growth rate (g) for future flows after year n.
[2]
Although flows may have an indefinite duration, it is acceptable to ignore their value
after a certain period, since their present value starts to decrease progressively and due
to the fact that some businesses lose their competitive advantage after a few years
(Fernández, 2001). Based on this, in order to determine future flows for a more accurate
valuation, analysts often create forecasts by extending financial statements into the
future but only till a certain period from 5 to 10 years (Steiger, 2008). However, all
analysts must be aware that the DCF methods require a large amount of predictions
about the business and realistic assumptions about the economy in general, "minor
changes will result in large differences in the company's value. The model is highly
dependent on the validity and quality of the data used as an input". However if used
correctly, DCF methodology is a "powerful valuation tool to evaluate many assets and
also to analyze the effects that different economic scenarios have on companies' values"
ISEG - Equity Research Project - Cofina SGPS
2015
14
There are "thousands of DCF methods in existence", although based on Damodaran
(2002), we can divide the discounted cash flow models in two main dimensions, i)
Equity Valuation and ii) Firm Valuation.
2.1.1.1 Equity Valuation
This dimension only considers the "equity stake" of the firm. The market value of a
company's equity, is obtained by discounting the expected cash flows to equity at the
cost of equity (Ke), which corresponds to the rate of return required by equity investors
in the firm (Damodaran, 2002b), (Fernández, 2001). According to Steiger (2008) the
most common approaches used to value the company's equity are the Dividend
Discount Model (DDM) and the Free Cash Flows to Equity (FCFE).
Dividend Discount Model
The first formal derivation of the DDM was written by John Burr Williams (1938), and
later revised by Gordon (1962), which is now known as the Gordon Model (Berk &
DeMarzo, 2014). The Gordon Model is the most common DDM used in practice, which
assumes that the firm's dividends grow at a stable rate, and the value of a common stock
can be defined as the "present value of the future dividend stream in perpetuity"
(Damodaran, 2002b);(Farrell, 1985). Which can be represented by the following
formula, where the DPS1 corresponds to the expected dividends per share one year from
now, Ke is the cost of equity and g is the perpetual dividends growth rate.
[3]
By assuming a constant perpetual growth rate for the firms dividends, the Gordon
Growth Model is very convenient and efficient for use in estimating the value of stable
and mature companies (Farrell, 1985). However, it is extremely sensitive to the inputs
for the growth rate. If used incorrectly, can lead us to misleading and absurd equity
ISEG - Equity Research Project - Cofina SGPS
2015
15 Free Cash Flows to Equity
The FCFE model is very similar to the DDM, however instead of taking into account
actual dividends this equity model computes de firm value by discounting potential
dividends. Basically, the FCFE model is a variant of the DDM, where dividends are
replaced by free cash flows to equity (Damodaran, 2002b).
[4] FCFE = Net Income - (Capital expenditures - Depreciation) - (Change in
Non-cash Working Capital) + (New Debt Issued - Debt Repayments)
The FCFE represent the cash flow available, to be paid out in dividends or stock
repurchases, after all company expenses (Damodaran, 2002b). According to
Damodaran, there are three main FCFE models, the constant growth model which is
suitable for firms that are growing stable, the two staged model which is suitable for a
company which is expected to grow faster than a stable firm in the first period and then
will stabilize, and the three staged model which is more appropriate to value companies
with very high growing rates, however this model will not be considered in this project
since it considers three stages of growth which makes the model more volatile and
variable dependent which can lead us to a higher probability of a misleading equity
valuation. So by the principle of parsimony, we will only consider the first two FCFE
models.
i) Constant growth model
The value of the stock today (P0) is computed by discounting the expected FCFE of next
year in perpetuity. Considering the appropriate Ke and growing rate in perpetuity (g).
ISEG - Equity Research Project - Cofina SGPS
2015
16 ii) The Two-stage FCFE model
The value of the stock is the PV of the future FCFE plus the PV of the terminal value.
[6]
Basically, the main difference between the DDM and the FCFE lies in the cash flows
specification, the first uses as cash flows the expected dividends on a stock, and the
second uses what is left after meeting all financial obligations and investment needs
(Damodaran, 2002b).
. Cost of Equity (Ke)
In line with (Damodaran, 2002b), the Ke is the rate of return that investors require for
holding part of the firm's equity. It cannot be seen directly in the market, however it is
possible to determine it. Most of the financial analysts recommend the use of CAPM
(Capital Asset Pricing Model), which is considered to be a simple and efficient
approach to relate risks and returns.
The general idea behind the model is that investors should be compensated in two ways,
time value of money which measures the compensation for placing money in any
investment over a period of time, and the additional risk taken (McKinsey & Company,
Copeland, Koller, & Murrin, 2000). Basically, CAPM is a model that establishes the
equilibrium between the price of the security and its risk through three variables: Risk
free rate (Rf), Beta of securities (β), and the expected market return E(Rm).
[7]
. Risk Free Rate (Rf)
Relying on (McKinsey & Company et al., 2000), the Rf rate is the return obtained from
ISEG - Equity Research Project - Cofina SGPS
2015
17
uncorrelated with the market risks and returns. Most of the analysts measure the
expected returns of risky assets relative to the risk free rate, the difference between both
is called the risk premium. Damodaran states that an asset is risk free if we are certain
about the expected returns, which means that the actual return is always equal to the
expected return. In practice, the most approximate risk free instruments in the market
are government securities, because they control the printing of currency. Since we are
performing a long term valuation, the most adequate Rf rate would be a solid long term
government bond yield (Damodaran, 2002b).
.Beta (β)
The Beta measures the systematic or market risk of a stock. It indicates the sensitivity of
the returns of a company's share to the market movements (Fernández, 2001). Based on
Damodaran's literature, the Beta of an asset is linearly related with the expected returns
of an asset, so according to the CAPM it can be computed by the following linear
function where Beta (βi) corresponds to the slope of the regression.
[8]
Other way to compute the Beta, which can be more simpler, consists into consider the
historical returns of the company and its respective market returns (Fernández, 2003).
As we can see by the following formula it is possible to calculate the β by establishing a
relationship between both figures.
[9]
2.1.1.2 Firm Valuation
This approach to valuation pretends to value the entire firm, instead of valuing only the
ISEG - Equity Research Project - Cofina SGPS
2015
18
perform a total firm valuation, one by discounting the cumulated cash flows to all claim
holders in the firm by the weighted average cost of capital (Free cash flows to the Firm),
and the other by adding the marginal impact of debt to the firm unlevered value
(Adjusted Present Value).
Free Cash Flows to the Firm (FCFF)
According to Steiger (2008), FCFF are the cash flows available to the debt-and-equity
holders of the firm, after covering fixed asset investments and working capital
requirements. They can be computed by considering the cash flows to the claimholders,
the cash flows to the lenders and also the cash flows to preferred stockholders.
However, this would be a complex process and could lead us to misleading results, so
based on (Damodaran, 2002b), we can use a simpler way to compute it.
[10] FCFF = EBIT(1-tax rate) + Depreciation - Capital Expenditure - Δ Net Working Capital
Then the value of the firm, that reaches a solid state after n years and is now growing at
a stable rate g, is the PV of the FCFF discounted at the Weighted Average Cost of
Capital (Damodaran, 2002b).
[11]
According to Berk & DeMarzo (2014), this methodology is more adequate for
companies with target debt-to-equity ratios, and constant capital structures overtime.
Otherwise, we would have to re-calculate the WACC every time that the firm's capital
structure changes.
The WACC is a tax adjusted discount rate, planned to pick up the value of interest tax
ISEG - Equity Research Project - Cofina SGPS
2015
19
that keeps the calculations in discounting more simple, however as it was referred
before, it is only suitable for companies with stable capital structures (Luehrman, 1997).
Relying on the CAPM, the WACC is calculated by weighting the Ke and the cost of
debt (Kd), taking into account the financial structure of the company, plus the tax effect
over the cost of debt.
[12]
.Cost of Debt (Kd)
In line with (McKinsey & Company et al., 2000), the Kd is the market interest rate
demanded by the bondholders. Basically, is the rate that the company would have to pay
on new debt issuance in order to pay its investment projects, according to the financial
literature firms with higher default risk will have a higher cost of debt.
When a "firm has long term bonds outstanding that are widely traded", we can use yield
of the last bonds issued to estimate the cost of debt. However many firms have bonds
outstanding that are not traded on a regular basis, in those cases to determine the Kd we
can use their ratings which are directly associated with their default spreads. On the
other hand, if we have no ratings available, there are two ways to estimate the cost of
debt, one is based on the borrowing history of the company by looking to the spreads
charged by the banks, the other is to calculate a synthetic rating based on financial
ratios, and also by looking to the ratings of some comparable firms operating in the
same industry (Damodaran, 2002b).
Adjusted Present Value (APV)
In accordance with Luehrman (1997), the APV method lies on the principle of "value
additivity", which means that the analyst will separate the valuation process in different
ISEG - Equity Research Project - Cofina SGPS
2015
20
method requires three steps, first valuing the unlevered firm (no Debt) by discounting
the FCF's at the unlevered Cost of Equity (Ku); the second step, assuming that the
company is financed with debt, is to calculate the expected tax benefit (ITS- Interest
Tax Shield) from a certain level of debt, and third we need to compute the bankruptcy
costs based on the firm's debt level.
[13] APV = Vu + PV(ITS) - PV(Expected Bankruptcy costs)
The APV method is a more complete approach to determine the value of a firm,
however it is much more complex than the cost of capital approach, because the WACC
considers all the "pieces" of the firm together (Luehrman, 1997).
.Unlevered Cost of Equity (Ku)
To compute the value of the unlevered firm (Vu) using the APV method, we need to
discount the FCF's at the unlevered cost of equity (ku) which is also known as unlevered
cost of capital. There are two ways to compute it, one is using an adapted version of the
CAPM but considering the unlevered Beta instead of the levered, and the other is by the
pre-tax WACC, which means without considering the tax effect over debt (Berk &
DeMarzo, 2014; Luehrman, 1997). This last approach is only accurate if the company
has a target debt to equity ratio.
[14] Ku = Rf + βu (Rm-Rf) [15]
2.1.2 Relative Valuation
The main goal of the RV methodology is to find the value of an asset based on how
similar assets are currently priced in the market. When performing an RV, there are two
essential steps, first prices need to be standardized, by converting them into multiples.
ISEG - Equity Research Project - Cofina SGPS
2015
21
crucial and complex since each firm has its own identity, and even being operating in
the industry they may differ on risk (Damodaran, 2012).
When choosing the comparable firms we must take into account the size of the
company, the industry, technology and also the use of identical accounting principles
(Neves, 2002).
As mentioned before the prices must be converted into multiples, which according to
Fernández (2001) can be divided in three main dimensions, total approach which takes
into account multiples based on the total Enterprise value of the company (E+D), Equity
approach which considers only multiples based on equity, and the growth reference
multiples, which by the principle of parsimony will not be considered in this project.
Total Approach based multiples Equity approach based multiples
.EV to EBITDA
.EV to EBIT
.EV to Sales
.Price Earnings ratio (PER)
.Price to Book value (PBV)
.Price to sales (P/S)
.Table I: Relative valuation multiples, source: Fernández, 2001
The RV method, is probably the most widely used valuation technique by the analysts,
first because it's based just on a few number of assumptions, secondly it's easier to
understand by the audience, and third because its more capable to reflect the "mood of
the market", in fact generally the RV leads us to closer market price values than the
DCF's valuation methods (Damodaran, 2002a).
2.1.3 Contingent Claim Valuation
According to Damodaran, the essence of option pricing models is that DCF models tend
to ignore the payoffs provided by the "occurrence of an event". Option pricing models
ISEG - Equity Research Project - Cofina SGPS
2015
22
with a certain business, in a way that DCF models are not capable of (Copeland &
Keenan, 1998).
This methodology takes into account opportunities that might come up with the
implementation of new projects, new products or new markets. The most common OPM
to value an asset are the Black-Scholes model and the Binomial model, however these
two models require a lot of inputs and variables, which makes them less intuitive and
also more likely to generate estimation errors. Besides, they are not applicable in some
cases, since they are highly dependent on the company's financial capacity (Luehrman,
1997). As a result, this methodology will not be considered in this project.
3. COFINA, SGPS, S.A.
3.1 The Group
Founded in 1995 and publicly listed since 1998 (Euronext Lisbon), Cofina was a
Portuguese holding group of several companies operating in many different sectors and
business areas, such as media, pulp, steel between others. However in 2005, there was a
spin-off of its holdings and the company remained only associated to the media printing
and publishing sector, namely newspapers and magazines.
Along the twenty years of Cofina's history, it is important to highlight some major
events, such as the acquisition of Investec in 1999, the acquisition of Correio da Manhã
in 2000, the launching of daily free newspapers (Metro e Destak) in Portugal and Brazil
between 2007 and 2011, and finally the creation of the TV cable channel CMTV in
2013, giving birth to the operating activity in the television sector. Today Cofina is one
of the leading players in the Media and Publishing industry in Portugal, and one of the
major companies listed in the general PSI stock index, with a market capitalization of
ISEG - Equity Research Project - Cofina SGPS
2015
23 3.1.2 Portfolio
Currently Cofina has a very diversified portfolio composed by one TV cable channel,
six magazines and five newspapers, which are available not only in paper but also in
digital format through online publications, covering a wide range of segments (news,
economy, fashion, sports...).
.Newspapers
In the newspapers segment, the focus goes to Correio da Manhã, which according to
the APCT (Associação Portuguesa para o Controlo de Tiragem) was the most sold daily
paid newspaper in Portugal in 2014, registering an average daily circulation of 109,000
copies, and a market share of 52.8%. This portfolio also counts, with the economic
newspaper Jornal de Negócios, which was in 2014 leader in the digital paid circulation
within the economic segment, the sports newspaper Record market leader in the sports
segment with over 800,000 readers per day in addition to the free newspapers Destak,
Metro and Destak Brasil, which recorded respectively an average of 400,000, 450,000 and 700,000 readers per day in 2014. Cofina considers the TV cable channel CMTV as
part of the newspaper segment since is directly linked with the Correio da Manhã
journal.
.Magazines
In the magazines segment, the main focus goes to the weekly magazine Sábado which
in 2014 was leader in sales, selling around 32,480 copies per edition, and registering
market share of 54% (52% in 2013) on the news magazines segment. Cofina's portfolio
is also composed by the weekly magazines Flash, which sold an average of 34,718
copies per edition, and TV Guia which was the only television publication to register a
positive sales evolution comparing to 2013, with an average of 67,062 copies sold per
ISEG - Equity Research Project - Cofina SGPS
2015
24
magazines Máxima which registered a value of 60,000 copies sold per month in 2014,
and also Vogue and GQ registering together sales around 30,000 copies per edition in
2014.
3.1.3 Corporate Structure
The key subsidiary company of the group in the media and publishing sector is known
as Cofina Media, which holds much participation in a variety of firms that sustain the
vast number of publications mentioned before, as showed in the next figure.
3.1.4 Shareholders Structure
Regarding the shareholders structure, there is only information available, in the
company financial report (2014), about the shareholders with a percentage of the share
capital with voting rights between 2% and 20%. With Ms. Ana Mendonça being the
major shareholder, holding about 20% of the company through Promendo-SGPS, Mr.
Domingos Matos through Livrefluxo-SGPS, Mr. Paulo Fernandes through Actium
Capital-SGPS, and Mr. João Oliveira through INDAZ, S.A.
23,08 19,98 15,01 13,05 12,09 7,53 4,91 2,23 2,12
Shareholders structure % Free Floating
Ms. Ana Menéres de Mendonça Mr. João Borges de Oliveira Mr. Paulo Fernandes
Mr. Domingos Vieira de Matos Mr. Pedro Borges de Oliveira Credit Suisse Group AG Millennium BCP Gestão de Activos
Santander Asset Management .Figure 1: Corporate structure, source: Cofina
ISEG - Equity Research Project - Cofina SGPS
2015
25
3.1.6 Stock Market Performance: Cofina vs PSI 20 Index
The year of 2013 was marked by good performance of the Portuguese stock market
index, registering valuation of about 5.7% between January and December. Especially
in second half of the year, with the PSI 20 advancing about 15% from July till the end
of the year. On the other side, Cofina underperformed the benchmark, with the stock
price falling about 14% since the beginning of the year, reaching a maximum
transaction price of €0.607 and minimum of €0.398. According to the company
financial report, there were traded 86,403,650 stocks during the year, which is
equivalent to 84% of the issued capital. However in 2014 the Portuguese market
registered a worse performance, registering a fall of 28% yoy in December of 2014,
while Cofina had a softer fall of 5.8% in the same period, over performing the reference
index. According to the financial reports of the company, Cofina's stocks were traded on
a maximum price of €0.75 and a minimum price of €0.472. In total, there were traded 92,516,149 shares, which is equivalent to 90% of the issued capital.
3.1.5 Financial Framework
In table II (appendix 1), we may take an overlook of the main financial ratios and
performance indicators of Cofina between 2012 and 2014, which were used in order to
perform this analysis. In order to perform a complete financial analysis of a company,
any analyst must take into account the historical performance of the company, and some
0,50 0,70 0,90 1,10 1,30 1,50 ja n -13 fe v-13 m ar -13 ab r-1 3 m ai-1 3 ju n -13 ju l-1 3 ago -13 se t-1 3 o u t-1 3 n o v-13 d ez-13 ja n -14 fe v-14 m ar -14 ab r-1 4 m ai-1 4 ju n -14 ju l-1 4 ago -14 se t-1 4 o u t-1 4 n o v-14 d ez-14 Cofina PSI 20
ISEG - Equity Research Project - Cofina SGPS
2015
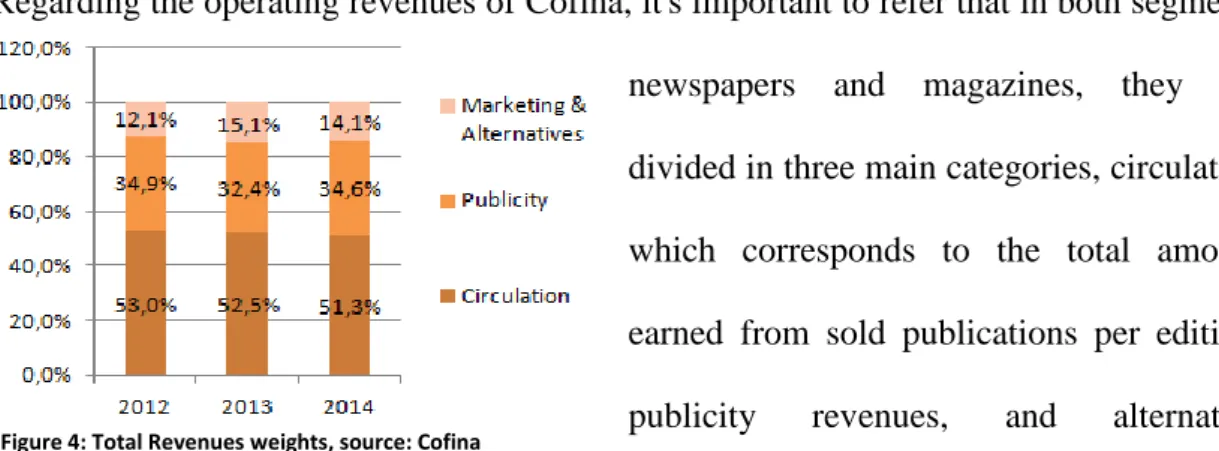
26 Figure 4: Total Revenues weights, source: Cofina
key performance indicators both focused on a short-term and long-term periods (Santos
Pinho & Tavares, 2012).
Regarding the operating revenues of Cofina, it's important to refer that in both segments
newspapers and magazines, they are
divided in three main categories, circulation
which corresponds to the total amount
earned from sold publications per edition,
publicity revenues, and alternative
marketing products and others which include all revenues from add-ons, such as books,
CD's, videos, between others. With the circulation revenues representing the core
business of the company (see figure 4), however they have been decreasing in the last 3
years as it will be explained further on.
In table II (appendix 1) we may notice that the operating revenues of the company have
been falling in the last three years, from 2012 to 2013 the total revenues registered a fall
of 5%, mainly impacted by the magazines segment which registered a sharp fall of
about 15%. The most impacted sector was the publicity falling 11.9% in the journals
segment and 21.5% in the magazines, mainly due to the impact of the world economic
crisis on the companies publicity budgets1, on the other side denying the trend the
alternative marketing products registered a rise of 19%. From 2013-2014 the company
registered a softer fall of 1.5%, impacted by the falls in the circulation and marketing
products, however the publicity registered an increase of 5.4% boosted by the soccer
world cup in Brazil which took place in June. It is also important to notice that the
circulation revenues have been decreasing in the last years of exercise, which according
ISEG - Equity Research Project - Cofina SGPS
2015
27
the PwC Media Outlook was due to the increasing number of online readers. The
EBITDA followed the tendency of the revenues, decreasing about 2% from 2012 to
2014, the decrease was slower than the revenues mainly due to the ability of the
company to reduce the operational costs, however they continue to suppress a big part
of the revenues, in 2014 they represented around 85% of the total revenues, which
according to Cofina's financial reports reflects the strong operational leverage of the
company, justified by the constant improvements to reinforce efficiency. If we note in
table II (appendix 1) the gross margins of the company are actually very competitive,
but when looking to the operating margins the effect of the operational costs is evident.
When looking to the operational income (EBIT), it decreased 7.6% from 2012-2013,
however in the period of 2013-2014 it recovered by registering an increase of 7.8%
boosted by a 24% reduction in the amortizations, resulting from the end in the
amortization period of some printing equipment2. Regarding the total net profits of the
company Cofina was able to define an increasing tendency in the last 3 years, with the
net income increasing about 55% between 2012-2014, especially due to a effective tax
reduction in the last 3 years. In the last years Cofina was also able to generate profits
through the shareholders invested capital with the ROE increasing 3% from 2013-2014,
on the other hand by analysing the ROA we may note that the company could improve
its capacity to generate results through its assets, especially through the goodwill of the
company which is the most valuable asset of Cofina, supported by the several number
of participations and segment leading products. Nontheless, Cofina is doing some
improvements since the ROA shows an increasing trend followed by the asset turnover
which is also increasing constantly in the last 3 years.
2 Source: Cofina financial reports, 2014
ISEG - Equity Research Project - Cofina SGPS
2015
28
Figure 5: Financial Structure, source: Cofina
Figure 6: Debt Structure, source: Cofina
Proceeding with the financial framework of
Cofina, is important to analyse the structure of
the company which has been changing in the last
3 years especially regarding debt. As we can see
in figure 5, Cofina is highly dependent on
borrowed funds to finance its activity, presenting
a very low financial autonomy (lower than 20%) which automatically leads to a high
leverage ratio and to a higher probability of failing its debt obligations as it may be seen
by the solvency ratio results of the company (appendix 1). Even with the Cofina's effort
in the last 3 years to reduce its debt burden the company still has a leverage ratio higher
than 80%, which means that the assets of the company are mainly financed by debt.
Regarding the debt to equity ratio, we reach the same conclusions, there is not an
equilibrium between the equity and borrowed capital.
Focusing on the debt structure (figure 6), by
analysing the leverage structure from 2012-2014, we
conclude that the long-term debt increased sharply,
mainly due to the issuance of a €50,000,000 bond
loan in the end of 2013, according to the financial
reports of the company this loan was to reimburse a previous one and to extend the debt
maturity profile. On the other hand, in the same period Cofina was able to reduce the
short-term debt, mainly by the amortization of some short term credit, namely
commercial paper. Based on Santos Pinho & Tavares (2012), a debt structure based
mainly on short term capital may lead to liquidity problems and to situations of
financial imbalance. So we conclude that the company measures taken in order to
ISEG - Equity Research Project - Cofina SGPS
2015
29
improving as we can see in table II (appendix 1) as the NWC and the quick, cash and
current ratios all increasing from 2012 to 2014, plus indicators related with the activity,
specially the cash conversion cycle which is now at a 3 years minimum, meaning that
less resources need to be allocated to the exploration, therefore the greater the potential
for wealth generation.
4. Macroeconomic Outlook
The year of 2014 was marked by a growth stagnation in most of the global economies,
mainly impacted by several geopolitical tensions around the globe and low growth
projections for both advanced and emerging market economies. According to the BoP,
along the year Portugal has shown some signs of recovery, denying the global trend,
economic activity registered an 0.9% growth after three years of consecutive falls. In
2014, Portugal was able to conclude with success the financial and economic assistance
programme, mainly due to the domestic demand pick-up which assumed an essential
role in the GDP increase. Even though, the exports growth was lower than in 2013,
standing below the external demand growth for Portuguese goods and services. It is also
important to refer that the growth of the economy activity was followed by a decrease in
unemployment, according to the BoP the unemployment rate decreased about 2.3%,
however it still remains at high levels. Regarding inflation, the country has followed the
negative tendency of most of the Euro area economies, mainly impacted by the oil
prices sharp fall.
For 2015, the Citigroup predicts a moderate continuation of the Portuguese economic
recovery followed by a gradual adjustment of the macroeconomic imbalances, with the
BoP forecasting an 1.9% growth for the GDP. This growth will be mainly sustained by
ISEG - Equity Research Project - Cofina SGPS
2015
30
consumption deceleration, and domestic demand will be pressured by the high debt
levels of the private and public sectors.
In Global terms, the Citigroup believes that the JPY and the EUR depreciation together
with the sharp oil prices fall will not be enough to offset the legacy of the financial
crisis in many countries, being highly recommended to most of the Central Banks to
apply economic stimuli policies to sustain growth for the future. According to the
Global Economic Outlook and Strategy report, in 2015 growth prospects will be in
favour of the Euro area and Japan, and away from prior outperformers, such as the US
and UK, and most of emerging markets. To have a general overview of some
Portuguese macroeconomic KPI's check the table III in appendix 2.
5. Entertainment & Media Industry Overview3
According to the PwC Entertainment & Media outlook, although the traditional
non-digital ways of media still represent most of the E&M industry spending, in the next
years this pattern will change, PwC believes that growth will be definitely in the digital
segment. This way, if Cofina wants to take advantage of the E&M sector trends in order
to achieve competitive advantage it will have to adopt a constant innovation strategy in
terms of products and services, and also to create a business plan focused on the
consumer’s necessities. This boost in the digital market segment is highly related with the increasing prospects for the fixed and mobile internet users for the next years. Based
on the E&M outlook, the fixed broadband penetration levels in Portuguese houses were
43% in 2012 and are believed to cover around 59% of the houses in 2017. When it
comes to mobile broadband, forecasts are also positive, with the increasing number of
tablets and mobile phones with access to the internet, PwC believes that almost 75% of
3 The Brazilian E&M industry was not subject of a specific evaluation in this project because according with Cofinas' financial statements it does not represent a significant part of the company activity.
ISEG - Equity Research Project - Cofina SGPS
2015
31
Figure 7: Portugal newspaper's circulation and publicity revenues growth, source: PwC
the Portuguese population will have access to mobile broadband in 2017. This internet
boom is changing the well-known traditional media, the digital era is completely
revolutionizing the media contents since they are gradually leaving the paper format for
the digital one due the consumer's necessity to have a quickly and easy access to
information. Focusing on the newspapers segment
in Portugal, according the PwC outlook the recent
economic crisis left this segment in a very delicate
position, printing runs are decreasing sharply in the
recent years, according to PwC the newspapers paper circulation will register a CAGR4
of -5.2 % from 2013 to 2017, as well as the publicity in paper editions which is
expected to decrease at a CAGR of -3.3% till 2017. Other major drawback is that most
of the printing and publishing companies are struggling to get credit and state support
for this sector is very low. However, PwC believes that this segment has some potential
to grow in the future if companies are able to take advantage of the digital era. This
way, the solution will be on the online services namely throughout online newspaper's
circulation with paywalls and digital publicity, based on the PwC estimates digital
publicity and digital newspapers circulation will register an CAGR of 11.4% and 35.4%
respectively between 2013 and 2017, but as mentioned before digital revenues both in
terms of circulation and publicity still represent a low piece of the pie, due to this
situation the newspapers Portuguese market will face some obstacles in the next couple
of years. For the periods after 2017 since we have no information available in the PwC's
E&M report, we had to rely on the Millennium investment banking media report
estimates for 2017-2020, which considers a CAGR of 1% for the newspaper's
circulation revenues and a CAGR of 1.5% for the publicity revenues of the company.
ISEG - Equity Research Project - Cofina SGPS
2015
32
In the Portuguese magazines segment, even with
the paper edition still dominating the magazines
market, the new cycle will be also on the digital
block. In global terms, the magazines market has
been falling in the last years mainly impacted by the world economic crisis which
impacted most of the domestic markets and consequently the marketing budgets.
In Portugal the magazines market is following the global trend, from 2013 to 2017 the
market share will decrease at a CAGR of 1.2%. According to the PwC Portuguese
Media outlook the main reasons for this decrease are; I) digital revenues will increase
around 10% from 2012 to 2017, however this increase will not be enough to offset the
sharp decrease on the paper magazines; II) the total spending on magazines advertising
will decrease about €10M from 2012-2017; III) Many companies are now investing more on alternative ways of publicity like the social networks. However, even with
PwC's negative projections for the Portuguese magazine market for the next couple of
years, like the newspapers segment if Cofina wants to follow the industry pace and also
to generate results in the future it will have to move the investment from paper
magazines to digital ones which in the long term will dominate the circulation an
publicity. For the periods after 2017, like in the newspapers segment we had to rely on
the Millennium investment banking media report estimates for 2017-2020, which
considers a CAGR of 1.5% for the magazine's circulation revenues and a CAGR of 2%
for the publicity revenues of the company.
In the case of the marketing & alternative products which are also a source of revenue
for both newspapers and magazines segments, since we have no information available
on the PwC Portuguese E&M outlook we also relied on the Millennium investment
Figure 8: Portugal magazine's circulation and publicity revenues growth, source: PwC
ISEG - Equity Research Project - Cofina SGPS
2015
33 Rival Competitors (high) Potential Entrants (low) Consumers Power (high) Substitute Products (high) Suppliers Power (low)banking estimates for Cofina. In the newspapers segment the marketing & alternatives
revenues are believed to grow at a CAGR of 2% from 2014 to 2020, on the other hand
in the magazines segment they are believed to register a CAGR of 4% from 2014 till
2020.
6. Five Forces Porter
.Figure 9: Cofina Porter's 5 forces
7. SWOT Analysis
Strenghts Weaknesses
Diversified Portfolio
Solid position and experience in the Portuguese media market
Solid Management performance
Market leader publications (Record, Correio da Manhã, Jornal de negócios)
Strong dependence on the Portuguese macroeconomic conditions and E&M cycles
Small dimension of the group
Weak presence of the company on the
TV segment
Highly leveraged
Opportunities Threats
Digital media boom
Expansion through Internationalization (Emerging markets)
Expansion through Mergers & Acquisitions
Expansion by investing in the Television
segment
Strong competition
Impact of the recent economic crisis in Portugal
Constantly changing consumption patterns in the E&M industry
Traditional media decreasing growth prospects for the future
ISEG - Equity Research Project - Cofina SGPS
2015
34
9. Valuation
9.1 Methodology
As mentioned before Cofina has two main business segments, magazines and
newspapers, since they are very similar we decided to consider the consolidated
accounts of the company instead of valuing both segments separately by the
Sum-of-the-Parts. However, we projected the revenues of both segments separately, because
according with the PwC Entertainment & Media outlook and with the Millennium
investment banking Media report they will register different annual growing rates in the
next couple of years. To find the intrinsic value of Cofina's stock we are going to rely
on the FCFF model, not only because it is one of the most effective and common
valuation models used by the analysts but also because is the most suitable for
companies which are looking to have a constant capital structure in the long-term (Berk
& DeMarzo, 2014), which we believe is the case of Cofina in the future. The cash flows
will be estimated for the next six years (till 2020) and then discounted at the WACC to
31/12/2014. In order to complement our analysis we also performed a relative valuation
which consists into value Cofina comparing with its peers, which according to Professor
Aswath Damodaran is a widely used method since it's much easier to understand by the
audience.
9.2 Assumptions for the Valuation Process
In order to determine the value of the company we had to define several assumptions to
compute the FCFF and also regarding the appropriate discount rate. These assumptions
were made in order to find the necessary inputs for the valuation process, which are
going to be explained further on.
9.2.1 Operating Revenues
From 2014-2017 we considered the PwC E&M report estimates, and from 2017 to 2020
ISEG - Equity Research Project - Cofina SGPS
2015
35
considering and adapting both reports annual growing rates projections for the
circulation, publicity and marketing & alternatives sources of revenue it is believed that
the total operating revenues of newspapers segment will register CAGR of -0,38% from
2014 to 2020 while for the magazines will register a CAGR of 0,81% in the same
period.
Newspapers (thousand €) 2012 2013 2014 2015E 2016E 2017E 2018E 2019E 2020E
Circulation 46,018 43,975 42,421 40,767 39,136 37,805 38,146 38,527 38,912 growth % -5.9% -4.4% -3.5% -3.9% -4.0% -3.4% 0.9% 1.0% 1.0% Publicity 30,932 28,060 29,618 29,100 28,838 28,578 29,064 29,442 29,913 growth % -19.0% -9.3% 5.6% -1.8% -0.9% -0.9% 1.7% 1.3% 1.6% Alternatives 10,958 12,052 12,535 12,535 12,786 13,041 13,302 13,568 13,840 growth % 14.0% 10.0% 4.0% 2.0% 2.0% 2.0% 2.0% 2.0% 2.0% Total Revenues 87,908 84,087 84,574 82,401 80,759 79,425 80,512 81,537 82,665 growth % -4.34% 0.58% -2.6% -2.0% -1.7% 1.4% 1.3% 1.4%
.Figure 11: Newspapers operating revenues (2012-2020); source: PwC, Millennium Investment Banking
Magazines (thousand €) 2012 2013 2014 2015E 2016E 2017E 2018E 2019E 2020E
Circulation 14,058 12,584 12,001 11,773 11,773 11,844 12,021 12,202 12,385 growth % -11.0% -10.5% -4.6% -1.9% 0.0% 0.6% 1.5% 1.5% 1.5% Publicity 8,624 6,773 7,092 6,979 6,867 6,757 6,892 7,030 7,171 growth % -25.6% -21.5% 4.7% -1.6% -1.6% -1.6% 2.0% 2.0% 2.0% Alternatives 2,737 2,202 2,410 2,502 2,597 2,695 2,798 2,904 3,014 growth % 5.0% -19.5% 9.4% 3.8% 3.8% 3.8% 3.8% 3.8% 3.8% Total Revenues 25,419 21,559 21,503 21,253 21,236 21,296 21,711 22,136 22,570 growth % -15.2% -0.26% -1.2% -0.1% 0.3% 1.9% 2.0% 2.0%
.Figure 12: Magazines operating revenues (2012-2020); source: PwC, Millennium Investment Banking
In both segments from 2014-2017 the company will register a negative CAGR, mainly
impacted the sharp decrease of the printing runs in the next couple of years, which will
have a negative impact on the circulation revenues of the company, and also by the cuts
of most of the company's marketing budgets as a consequence of the recent economic
crisis (PwC Media report), which will affect the publicity revenues of Cofina. On the
other hand, from 2017-2020 the estimates are more optimistic mainly sustained by the
belief that Cofina will turn its investment to the digital ways of media, which according
ISEG - Equity Research Project - Cofina SGPS
2015
36
publishing & media companies due to the consumer's necessity to have a more quickly
and easy access to information.
9.2.2 Operating Income (EBIT)
The projection of the EBIT margins was based on the historical performance of the
company. According to the financial reports of Cofina, in the last three years the
company has been applying some rigorous and strict operational cost control policies in
order to have more competitive margins, however according to Millennium investment
banking those margins will keep to show some resilience in the current media and
publishing sector adverse scenario. Based on this and in the historical performance of
the company, we believe that Cofina will show a 12% margin from the total operating
revenues in the next 6 years, assuming the value in 2020 for perpetuity.
(thousand €) 2012 2013 2014 2015E 2016E 2017E 2018E 2019E 2020E
Operating Income (EBIT) 13,366 12,355 13,316 12,377 12,179 12,027 12,207 12,380 12,566
EBIT/Revenues 11.8% 11.5% 12.6% 12% 12% 12% 12% 12% 12%
.Figure 13: EBIT projections (2015-2020)
9.2.3 Capex, Depreciations and Amortizations
Due to the lack of information of the company financial reports, we projected the capex
for the next six years based on the historical average as a percentage of the total
operating revenues. Since there is no indication on the financials that the company is
planning to do any kind of investment for the future, with the exception of the
upcoming penetration to the digital media which does not require abnormal capital
expenditures, we believe that the capex will be similar to previous years, where Cofina
only had to invest in tangible assets in order to renew some old equipment that reached
the amortization period, which was the case in 2013.
(thousand €) 2012 2013 2014 2015E 2016E 2017E 2018E 2019E 2020E
Capex 1,625 3,213 1,344 1,964 1,933 1,909 1,937 1,965 1,994
% of Revenues 1.4% 3.0% 1.3% 2% 2% 2% 2% 2% 2%
ISEG - Equity Research Project - Cofina SGPS
2015
37
Regarding the depreciations since we had no information available regarding future it is
difficult to estimate the evolution of the tangible assets of the firm, so we also based our
calculations on the historical average over the total operating revenues. According to the
financials of the company most of the operational costs associated with depreciations
are related with the depreciation of some printing equipment.
(thousand €) 2012 2013 2014 2015E 2016E 2017E 2018E 2019E 2020E
Depreciations & Amortizations 3,172 3,873 2,927 3,163 3,113 3,074 3,120 3,164 3,212
% of Revenues 2.8% 3.6% 2.8% 3.1% 3.1% 3.1% 3.1% 3.1% 3.1%
.Figure 15: Depreciations and Amortizations projections (2015-2020)
Based on the historical performance of the company we may note that the year of 2013
was an exception when compared to 2012 and 2014. This is related with the investment
that the company took in order to renew some old equipment as we explained before,
thus in 2014 the depreciations returned to regular levels.
9.2.4 Net Working Capital
The projection of net working capital was based on the historical average over the total
operating revenues. In order to compute the NWC of the company in the last three years
we used the formula presented in Santos Pinho & Tavares (2012), which consists in
computing the permanent capital of the firm (Equity plus non-current liabilities) and
then subtract the value of the non-current assets. After computing the NWC we noticed
that in 2012 the value was not in line with the last two years, mainly because Cofina has
been changing its debt structure as we explained in the financial framework chapter.
Based on this, we only considered the last two years average over the total revenues in
order to project the NWC and consequently the changes in NWC (NWCt - NWC t-1).
(thousand €) 2012 2013 2014 2015E 2016E 2017E 2018E 2019E 2020E
NWC -76,001 -22,540 -22,596 -21,891 -21,540 -21,271 -21,588 -21,895 22,224
% of Revenues -67.1% -20.9% -21.3% -21.1% -21.1% -21.1% -21.1% -21.1% 21.1%
Changes in NWC 19,284 53,461 -56 705 350 269 -317 -306 -330
ISEG - Equity Research Project - Cofina SGPS
2015
38
9.2.5 Risk free rate
In line with the literature revision to define the Rf we need to use a solid long term
government bond yield. Based on this, we relied on the German 10 year’s government
bond yield taken from Bloomberg, which was 0,541% in 31/12/2014.
9.2.6 Beta
In order to compute the Beta of the company, we extracted from Bloomberg the
historical closing prices on a monthly basis of Cofina and PSI 20 Index from January of
1998 until January of 2015, and then we calculated the historical returns of both. After,
in order to find the levered Beta we applied the following formula Bi = Cov(Ri,Rm) /
Var(Rm) reaching a value of 1,36.
9.2.7 Cost of Debt and Cost of Equity
In order to compute the kd we relied on the synthetic rating based methodology
(Damodaran, 2002b). For that we had to compute the interest coverage ratio of Cofina
which is calculated by dividing the EBIT by the total interest expenses, and then based
on that result and according with Interest Coverage ratios and Ratings for low market
capitalization firms table (appendix 3) we define the synthetic rating of our company.
Once the rating is assessed it can be used to estimate a default spread which when added
to the risk free rate gives us the pre-tax cost of debt of the firm (Damodaran, 2002a).
2012 2013 2014 Data
EBIT € 13,366 12,355 13,316
Interest expenses € 4,743 4,504 4,234
Interest Coverage ratio 2.8 2.7 3.1 2.9
Default Spread 4.75%
Risk free rate 0.541%
pre-tax Cost of Debt (Kd) 5.29%
.Figure 17: calculation of the pre-tax Kd
Based on the last three years average interest coverage ratio of Cofina the synthetic
rating would be a B+ which is equivalent to a default spread of 4.75% and when added
ISEG - Equity Research Project - Cofina SGPS
2015
39
of equity, we relied on the CAPM formula presented on the literature review Ke = Rf +
βL (total equity risk premium5). Based on Damodaran database, according to Portugal
Moody's rating (Ba1) on January of 2015, the total equity risk premium is 9.50%, which
is equal to a mature market equity risk premium, in this case Germany since Portugal is
a western European country, plus an additional country risk premium, as you can see in
following figure.
.Figure 18: Cost of Equity calculation 9.2.8 Tax rate
The corporate tax rate used for the firm valuation according to the Portuguese current
Government, stands at 21% plus a municipal surcharge of 1.5% over the marginal
corporate tax rate.
9.2.9 Debt to Equity ratio
Since Cofina is currently conducting a deleveraging process we do not believe that the
present D/E ratio reflects the future capital structure of the company. We believe that in
the long-term Cofina's main goal is to have a capital structure similar to its peers. Based
on this, and assuming that in perpetuity the D/E ratio of a company converges to its
market D/E ratio, we relied on the Thomson Reuters Media & Publishing market D/E of
46%.
5 http://pages.stern.nyu.edu/~adamodar/New_Home_Page/datafile/ctryprem.html
Damodaran database which was used in order to calculate the Portuguese equity risk premium
Risk free rate 0.541%
Equity or Levered Beta 1.36
Germany Total Equity risk premium 5.75%
Additional country risk premium (Portugal) 3.75%
Portugal Total Equity risk premium 9.50%