ISSN 0102-261X www.scielo.br/rbg
EQUATORIAL F-REGION IRREGULARITIES GENERATED BY THE RAYLEIGH-TAYLOR
INSTABILITY MECHANISM – ROCKET OBSERVATIONS FROM BRAZIL
Polinaya Muralikrishna and Leandro Paulino Vieira
Recebido em 22 dezembro, 2005 / Aceito em 8 junho, 2007 Received on December 22, 2005 / Accepted on June 8, 2007
ABSTRACT.Several sounding rockets carrying plasma diagnostic experiments were launched from the Brazilian rocket launching stations in Natal (5.9◦S, 35.2◦W Geog. Lat.) and Alcˆantara (2.31◦S, 44.4◦W Geog. Lat.). Langmuir Probes (LP) were used to measure the height profiles of electron density and electron temperature and High Frequency Capacitance (HFC) probes were used to measure electron density. The LP’s were also used to measure the amplitude of electron density fluctuations. A detailed study of the characteristic features of electron density irregularities in the scale size range of less than a meter to a few kilometres, observed by rocket-borne electron density probes under different ionospheric conditions is presented here. The main objective of these studies is the identification of these irregularities from the point of view of the dynamic and electrodynamic processes responsible for their generation. The existing theories of the Rayleigh Taylor Instability (RTI) mechanism applicable for conditions of the geomagnetic equatorial ionosphere over Brazil are critically examined in the light of the observations. The observed characteristics of the irregularities during four rocket launches are compared with the theoretically expected characteristics. These results confirm the operation of a cascade process that is responsible for the generation of a wide spectrum of irregularities. The large-scale irregularities are first generated probably by the RTI mechanism that creates conditions favourable for the operation of the Cross-Field (CFI) or the Gradient Drift Instability (GDI) mechanism. From the k-spectra of irregularities it is possible to obtain the spectral indexn corresponding to the height chosen. In most of the cases the estimated spectral indices agree well with those published in the literature for the cases of irregularities generated by the GDI mechanism.
Keywords: space plasma, ionosphere, F-region, Rayleigh-Taylor instability, Cross-Field instability.
RESUMO.V´arios foguetes de sondagem carregando experimentos de diagn´ostico de plasma foram lanc¸ados dos centros Brasileiros de lanc¸amento de foguetes em Natal (5.9◦S, 35.2◦O Lat. Geog.) e Alcˆantara (2.31◦S, 44.4◦O Lat. Geog.). Sondas de Langmuir (LP) foram usadas para medir os perfis de densidade e tem-peratura do plasma e Sondas Capacitivas em Alta Freq¨uˆencia (HFC) foram usadas para medir a densidade eletrˆonica. As LP’s foram usadas tamb´em para medir a amplitude das flutuac¸˜oes de densidade eletrˆonica. Um estudo detalhado dos aspectos caracter´ısticos das irregularidades de densidade eletrˆonica da escala de menos de um metro a alguns quilˆometros, observadas pelas sondas de densidade eletrˆonica a bordo dos foguetes sob condic¸˜oes diferentes da ionosfera ´e apresentado aqui. O objetivo principal destes estudos ´e a identificac¸˜ao destas irregularidades do ponto de vista dos processos dinˆamicos e eletrodinˆamicos respons´aveis pela gerac¸˜ao delas. As teorias existentes do mecanismo de instabilidade de Rayleigh-Taylor aplic´aveis para as condic¸˜oes da ionosfera equatorial geomagn´etica sobre Brasil, s˜ao analisadas criticamente, `a luz das observac¸˜oes. As caracter´ısticas observadas das irregularidades durante os quatro lanc¸amentos de foguetes foram comparadas com as caracter´ısticas esperadas das teorias. Estes resultados confirmam a operac¸˜ao do processo cascata, que ´e respons´avel pela gerac¸˜ao de um largo espectro de irregu-laridades. As irregularidades de larga escala s˜ao geradas primeiras, provavelmente pelo mecanismo RTI que cria condic¸˜oes favor´aveis pela operac¸˜ao do mecanismo de Instabilidade “Cross-Field” (CFI) ou “Gradient-Drift” (GDI). A partir dos espectros-k das irregularidades ´e poss´ıvel obter o ´ındice espectraln correspondendo a uma altura escolhida. Na maioria dos casos o ´ındice espectral estimado est´a em boa concordˆancia com os publicados na literatura para os casos de irregularidades geradas pelo mecanismo GDI.
Palavras-chave: plasma espacial, ionosfera, regi˜ao-F, instabilidade Rayleigh-Taylor, instabilidade Cross-Field.
National Institute for Space Research, INPE, Av. dos Astronautas, 1758 – 12227-010 S˜ao Jos´e dos Campos, SP, Brazil. Phone: +55 (12) 3945-7148; Fax: +55 (12) 3945-6990 – E-mail: [email protected]
INTRODUCTION
Dungey (1956) first proposed the Gravitational RTI mechanism as the process of driving the equatorial spread-F (ESF). The bottom side F-region where the electron density has a very large upward gradient can become unstable under favourable ambient conditi-ons. Assuming that the plasma in this region is nearly collision-less the linear growth rate of a perturbation can be obtained as,
0 = g
Lνin (1)
whereL is the inverse gradient scale length and νin is the ion neutral collision frequency (see Schunk & Nagy, 2000). A local perturbation in the plasma can grow linearly and take the form of a plasma bubble that may eventually grow further and rise upwards due to buoyant forces to height regions where the linear theory of RTI predicts no irregularities. Since then several linear and non-linear theories have been invoked to explain the wide spectrum of electron density irregularities observed in the nighttime E and F-regions (Reid, 1968; Hudson et al., 1973; Sudan et al., 1973). Collision dominated RTI was proposed by Balsley et al. (1972) as a possible candidate for the production of kilometre range F-region irregularities. Haerendel (1974) suggested a multi-step process to explain the large range of wavelengths observed, from several kilometres down to few centimetres in the nighttime F-region. Scale sizes of plasma irregularities are divided into three ranges here, namely, small scale (wavelength λ < 25 m), inter-mediate scale (25 m < λ < 1 km) and large scale (λ >1 km). Shortly after sunset the E-region begins to recombine, causing steepening of the bottom side F-region electron density gradi-ent. At the same time the E-W tidal electric fields cause the F2 peak to rise into regions of decreasing νin and recombination rate. Eventually when the base of the F-region reaches altitu-des above about 260 km the growth rate of RTI becomes more than the recombination rate and the density fluctuations begin to grow on the bottom side of the F-region. Plasma bubbles ri-sing through the F-peak may produce shorter and shorter scale size irregularities by a cascade mechanism. Rocket observations of Barium cloud release experiments conducted from Natal, Bra-zil (Kelley et al., 1976) showed that the electron density fluctu-ations at large wave numbers displayed a power dependence of
k−2. Computer simulations of non-linear development of the RTI have shown that large regions of depleted plasma density rise into the topside ionospheric regions (Scannepieco & Ossakow, 1976). The large density gradients associated with these rising bubbles are favourable for the operation of the gradient drift instability me-chanism. One-dimensional power spectral estimates of δne/ne
fluctuations for the vertical and horizontal directions showed ave-rage spectral indices of –2.7 and –1.5 respectively. Rocket obser-vations of equatorial spread-F from near Kwajalein in the Marshal Islands (Keskinen et al., 1981) showed major plasma depletions distributed throughout a downward moving F-layer with regions of smaller scale irregularities tending to be collocated with po-sitive gradients of electron density. Several mechanisms like the Collisional Drift Instability (Hudson & Kennel, 1975), two-step processes (Hudson et al., 1974), Universal Drift Instability (Costa & Kelley, 1978a,b), and Lower Hybrid Drift Instability have been proposed to account for these shorter wavelength irregularities (see Ossakow, 1979). These bubble characteristics were also confirmed by experimental observations of plasma density de-pletions (Kelley et al., 1976; McClure et al., 1977, Woodman & La Hoz, 1976). Analytical models for the rise of collisional and collisionless R-T bubbles were presented by Ott (1978). Costa & Kelley (1978a,b) showed that very steep gradients with in-verse scale lengths as short as 25 m, if present on the topside when the bubbles convected upwards, collisional damping might decrease to the extent that drift waves were generated. They sug-gested that this collisionless process might play a role in the ge-neration of small-scale irregularities in the topside ESF. Huba & Ossakow (1979) included collisions in the drift wave theory and showed that even at topside altitudes short wave length drift wa-ves were not linearly unstable and hence a linear drift wave theory could not account for the observation of small-scale irregulari-ties in this region. LaBelle & Kelley (1986) reported rocket-borne observations of the vertical wave number spectrum with spec-tral index close to –2.5 for density fluctuations. The spectrum is less steep for wavelengths longer than 1 km indicating dual slope spectra. No computer simulation has produced a spectrum shallower thank−2.
Satellite experiments consistently observe a power law spec-trum of density irregularities with index varying from –1 to –3 (Dyson et al., 1974; Valladares et al., 1983; Livingston et al., 1981; Kelley & McClure, 1981). In the intermediate scale range the spectrum of electric field irregularities also indicate spectral index of about –2 (Kelley & Mozer, 1972). Scintillation observa-tions also are consistent with the satellite observaobserva-tions (Basu et al., 1983).
Evidence now exists that the large and intermediate scale irre-gularities result from RTI mechanism driven by the ambient bot-tom side plasma density gradient. The post-sunset equatorial F-layer can become unstable under the influence of any disturbance produced by gravity waves, neutral winds or electric field fields, and can generate plasma irregularities through the R-T
instabi-lity mechanism (Hysell et al., 1990; Singh et al., 1997). Bubbles are mostly aligned with the geomagnetic field with plasma den-sity decreases of up to 3 orders of magnitude. These depletions are generally produced over geomagnetic equator and they con-nect upwards through the F-layer peak to the topside ionosphere, reaching altitudes as high as 1200 km or more (Woodman & La Hoz, 1976). Steep plasma density gradients associated with the long wavelength R-T mode, create a condition which leads to the hierarchy of plasma instabilities giving rise to a wide spec-trum of irregularities.
Several rocket campaigns have been reported for studying the phenomenon of spread-F in the American region (Kelley et al., 1976; Morse et al., 1977; Rino et al., 1981; Szuszczewicz et al., 1981; Kelley et al., 1982; Hysell et al., 1994) and a few cam-paigns in the Indian zone (Raghavarao et al., 1987; Prakash et al., 1991; Sinha et al., 1999; Raizada & Sinha, 2000; Sinha & Rai-zada, 2000). Kelley et al. (1982) reported that at altitudes above about 280 km the electron density spectrum varied ask−5while the electric field fluctuations showed a power law dependence of
k−3. Theory and laboratory measurements predict a power law density spectrum for gradient driven drift waves with indices in the range of –4.5 to –6.0. At lower altitudes shallower spectra were observed for small-scale irregularities, probably due to col-lisional damping in this region. From simultaneous in situ mea-surements of electron density and electric field fluctuations Hysell et al. (1994) showed that irregularities in the scale size range of 100 m- 2 km display a power law behaviour with spectral index
n ≈ –2 that increased to –4.5 for wavelength around 100 m and
below when F-layer is high. The spectral indices as well as the exact relationship between the electron density and electric field fluctuations depend on the type and the scale size of irregularities. Measurement of these parameters, thereby, can give us valuable information on the plasma instability mechanism responsible for the generation of these irregularities.
The linear growth rate of RTI given by equation (1) can get modified in the presence of other ambient forcing agents like electric field, and the neutral winds. An eastward electric field E causes upward drift of both electrons and ions and has an ef-fect opposite to that ofg. An eastward zonal wind U that cau-ses downward drift of electrons (in the same direction asg) and upward drift of positive ions (opposite to that ofg) accelerates the growth of RTI (Chiu & Straus, 1979), since the mobility of electrons is much larger than that of positive ions. Similarly a downward wind (-W) also accelerates the growth of RTI. Recom-bination of electrons tries to decelerate the growth rate RTI. From these considerations one can obtain an expression for the
ef-fective growth rate of the Generalised Rayleigh-Taylor Instability (GRTI) mechanism as,
γg = g
νinL −
E
BL +UL − WL −ηR (2)
where,g is the acceleration due to gravity, U and W respec-tively are the horizontal and vertical components of the neutral wind (taken positive upward and eastward), νinis the ion-neutral collision frequency,L is the gradient scale length (taken positive upward),E is the horizontal electric field (taken positive eastward) and ηR is the recombination coefficient. As can be seen from this relation, whenL is positive (base of the F-region for exam-ple), westward electric field and a neutral wind with downward and westward components will increase the growth rate of the R-T irregularities. Calculations show that a downward wind of about 9 ms−1at 270 km and 16 ms−1at 300km can cause the same growth rate as that due to gravitational drift at the respective alti-tudes (Sekar & Raghavarao, 1987).
Numerical simulations show that perturbations at the bottom side of the F-region, unstable for the RTI, can under reasonable initial conditions develop into wedges or bubbles as low-density plasma is convected into the topside (Zalesak et al., 1982). During this process the walls of these structures are steepened conside-rably. Linear theory predicts that gradient driven instabilities can develop on one of the walls of the bubble. The GDI or CFI me-chanism operates in regions where E is parallel to the electron density gradient (Reid, 1968; Tsuda et al., 1969). A rising bubble, for example, polarizes with an eastward field inside, and conse-quently the west wall will be unstable to the GDI. Also the hori-zontal neutral windU, when blowing across a steepened vertical wall generates irregularities at regions where (U ∙ 5n) < 0.
The explanation of the characteristic wave number spectrum is one of the most important problems in the theory of ESF irre-gularities. The linear theory of gravitational RTI presents a picture in which the wave energy is injected at large scales and is dissi-pated at very short scales through some process similar to clas-sical collisional diffusion. With the main objective of identifying the operating instability mechanisms from their spectral characte-ristics several rocket observations were made from the equatorial station Natal and Alcˆantara in Brazil and the results are presented and discussed here.
RESULTS AND DISCUSSION
Table 1 summarizes the experiments launched on board soun-ding rockets from the Brazilian rocket launching stations Natal-RN (5,9◦S; 35,2◦W) and Alcˆantara-MA (2,31◦S; 44,4◦W).
Table 1 – Summary of flights analysed.
Date Time Launch site Experiments Apogee/range 11/12/1985 2130LT Natal HFC, LP 516 km; 484 km 31/10/1986 2359LT Natal HFC, LP 444 km; 656 km 14/10/1994 1955LT Alcˆantara HFC, NASA Expts. 956,6 km 18/12/1995 2117LT Alcˆantara EFP, HFC, LP 563 km; 487,6 km
Natal (5,9◦S; 35,2◦W); Alcˆantara (2,31◦S; 44,4◦W).
Rocket flight on 11-th December 1985
A Brazilian Sonda III rocket, carrying a Langmuir probe (LP) and a High Frequency Capacitance (HFC) probe in addition to other air-glow photometers, were launched at 2130 (LT) on 11-th Decem-ber, 1985, from the equatorial rocket launching station in Natal-RN, Brazil. The rocket reached an apogee altitude of 516 km and a horizontal range of 484 km. The LP used could measure elec-tron density irregularities in a wide range of scale sizes from less than a meter to several tens of kilometres. The sampling rate used was 1667 samples per second. The observable frequency range, therefore, extends from 0 to 833 Hz. Assuming that at the rocket velocity of more than 2.5 kms−1, the ambient plasma waves or irregularities can be considered to be stationary, one can convert the wave frequency f to scale size λ or wave number k through the relationk = 2π/λ = 2π f/v where v is the rocket velo-city. It should be noted here that the HFC experiment had a time resolution of about 0.16 s corresponding to a height resolution of about 400 m indicating that the minimum observable scale size in this case was about 800 m. The HFC experiment was used only to get the height profile of the electron density and could not pro-vide information about the intermediate or small-scale electron density irregularities.
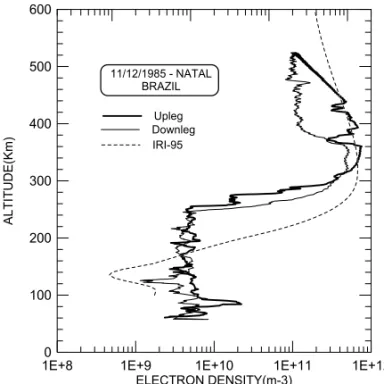
Figure 1 shows the altitude profiles of the electron density estimated from the HFC data for the rocket upleg and downleg.
Electron density structures
The upleg electron density profile shows continuous structures of small-scale electron density irregularities, some of them being rather steep. Two distinct regions of irregularities were observed during the rocket upleg, one of them in the height region close to 270 km and the other close to 280 km. In the first region the vertical extension of the irregularities is in the range of 1 to 5 km in which the electron density varied by a factor of 1.4 within a ver-tical extent of 2 km. In the second height region electron density irregularities were observed in a vertical extension of about 3 km,
and the density varied by a factor of about 1.4, as in the first height region. During the rocket downleg electron density irregularities were practically absent in these height regions.
1E+8 1E+9 1E+10 1E+11 1E+12
ELECTRON DENSITY(m-3) 0 100 200 300 400 500 600 AL TI TU DE (K m ) 11/12/1985 - NATAL BRAZIL Upleg Downleg IRI-95
Figure 1 – Altitude profiles of the electron density estimated from the HFC data
for the rocket upleg and downleg on 11-th December, 1985. Also shown in the figure is the IRI-95 model profile.
In the height region above 350 km, two dominant electron density depletions or bubbles were observed in the height regi-ons of 360,4 to 393 km and 419 to 438,7 km. In the first height region the density depletion was by a factor of about 2.7 in a height extent of 11.4 km that recovered by a factor of 2.2 in a height ex-tent of 10 km. In the second height region the density depletion was by a factor of 1,5 within 4.4 km and the recovery was by a factor of 1.4 within a vertical extension of 4.2 km. During the roc-ket downleg electron density fluctuations were observed starting at the apogee height of 516 km. The valley region between the base of the F-layer and the E-region at about 100 km showed the presence of intermediate and small-scale irregularities.
The large positive electron density gradient observed in the base of the F-region extending from about 260 km to about
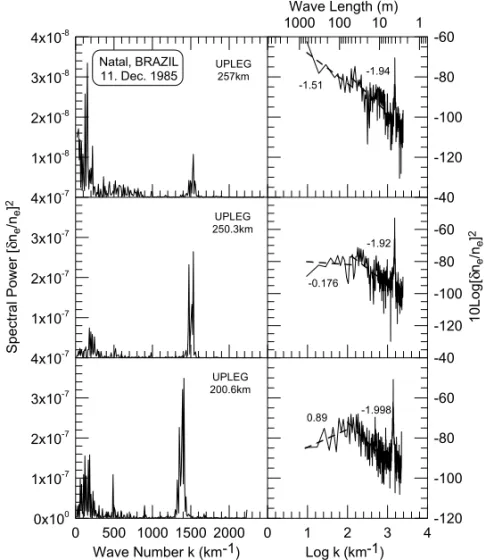
0 1 2 3 4 Log k (km-1) -120 -100 -80 -60 -40 -120 -100 -80 -60 -40 10 Lo g[ δne /ne ] 2 -120 -100 -80 -60 1000 100 10Wave Length (m) 1 0.89 -1.998 -1.92 -0.176 -1.94 -1.51 0 500 1000 1500 2000 Wave Number k (km-1) 0x100 1x10⁻⁷ 2x10⁻⁷ 3x10⁻⁷ 4x10⁻⁷ 1x10⁻⁷ 2x10⁻⁷ 3x10⁻⁷ 4x10⁻⁷ Sp ec tra l P ow er [δ ne /ne ] 2 1x10⁻⁸ 2x10⁻⁸ 3x10⁻⁸ 4x10⁻⁸ UPLEG 200.6km UPLEG 250.3km UPLEG 257km Natal, BRAZIL 11. Dec. 1985
Figure 2 – Linear (left) and log-log (right) plots of irregularity spectral power versus wave numberk (in km−1) for selected height regions during the rocket upleg. Each spectrum corresponds to a time interval of about 0.3 sec.
305 km seems to be responsible for the generation of the elec-tron density structures in this height region through the Rayleigh-Taylor Instability mechanism. Other regions on the topside where large downward electron density gradients are observed are favourable for the generation of plasma irregularities by the CFI mechanism.
Thek-spectra of the electron density irregularities were es-timated by conventional spectral analysis of the electron density fluctuation data. Typical spectra thus estimated for selected height regions are presented in Figures 2 and 3. Figure 2 shows three
k-spectra estimated for the height regions of 200.6 km, 250.3 km
and 257 km and correspond to the upleg of the rocket trajectory. Each spectrum is estimated form 516 data samples collected in approximately 0.3 sec. For a rocket velocity of about 2.5 kms−1 this corresponds to a distance of about 750 m, thus limiting the upper limit for the observable scale size at 750 m. The left pa-nel of Figure 2 shows the spectra on linear scales along both the wave number and power axes. The same spectra are shown on a
log-log scale in the right panel. A striking feature of the spectra is the presence of a few sharp spectral lines, which is not expec-ted from the known theories of the instability mechanisms. The power of the most dominant spectral lines observed close tok = 1400 km−1is highest (>3 × 10⁻⁷) at 200.6 km and then gra-dually reduces to less than 10-8 at 257 km. This probably could represent the injection of wave energy at this wave number at regions below the base of the F-layer. These spectral lines can be seen in the conventional log-log plots of the power spectra shown in the right panel of Figure 2. Except for the presence of these sharp lines the spectra are similar to those reported ear-lier. The spectra show mainly two parts with distinct slopes. For wave length below about 65 m the slope or spectral index is close to –2 and for wave length above 65 m the spectral index va-ries considerably, from +0.89 at 200.6 km to –1.51 at 257 km. The increase in the power at larger wavelengths seems to be as-sociated with decrease in the power of the sharp spectral lines. A possible hypothesis could be that the wave energy transported
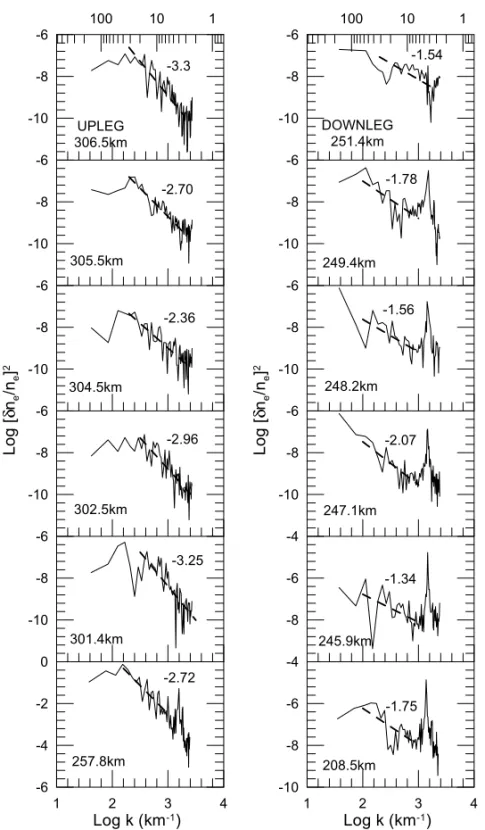
1 2 3 4 Log k (km-1) -6 -4 -2 0 -10 -8 -6 -10 -8 -6 Lo g [δ ne /ne ] 2 -10 -8 -6 -10 -8 -6 -10 -8 -6 100 10 1 -2.72 -3.25 -2.96 -2.36 -2.70 -3.3 1 2 3 4 Log k (km-1) -10 -8 -6 -4 -8 -6 -4 -10 -8 -6 Lo g [δ ne /ne ] 2 -10 -8 -6 -10 -8 -6 -10 -8 -6 100 10 1 -1.75 -1.34 -2.07 -1.56 -1.78 -1.54 257.8km 301.4km 302.5km 304.5km 305.5km UPLEG 306.5km DOWNLEG251.4km 249.4km 248.2km 247.1km 245.9km 208.5km
Figure 3 – Log-log plots of irregularity spectral power versus wave numberk (in km−1) for selected height regions during the rocket upleg (left panel) and downleg (right panel). Each spectrum corresponds to a time interval of 0.08 s.
upward through the sharp spectral lines is transferred to larger wavelengths at higher altitudes. The existing theories on the generation of plasma irregularities are unable to explain these spectral features.
Typical power spectra of irregularities observed during the upleg (left panel) and downleg (right panel) for selected height regions are shown in Figure 3. While all the spectra shown in the left panel correspond to the base of the F-layer the spectra shown
in the left panel correspond to the valley region between the base of the F-layer and the E-region. During upleg the sharp spectral lines were observed only in the spectrum at 257.8 km, while prac-tically all the spectra corresponding to the valley region, observed during downleg, show the presence of sharp spectral lines. The spectral index for small-scale irregularities, as can be seen from the left panel, varies in the range of –2.36 to –3.3, while the spec-tra for larger scale sizes are much flatter. The specspec-tra in the right
panel do not represent any systematic structure and it seems to be difficult even to attribute any mean spectral index for any spec-tral region. The specspec-tral index of –1.54 (top spectrum, right pa-nel) observed for intermediate scale irregularities in the base of the F-region seems to indicate that they are probably produced by the RTI mechanism. The spectral indices in the range of –2.36 to –3.3 observed for the small scale irregularities (left panel in Fig. 3) seems to indicate to their probable generation by the GDI or CFI mechanism.
Rocket flight on 31-st October 1986
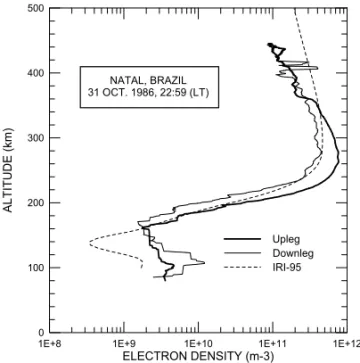
On 31-st October, 1986 a Brazilian Sonda III rocket, carrying a Langmuir probe (LP) and a High Frequency Capacitance (HFC) probe in addition to other airglow photometers, were launched at 2400 hrs (LT) from the equatorial rocket launching station in Natal-RN, Brazil. The rocket reached an apogee altitude of 444 km and a horizontal range of 656 km. The LP used could measure electron density irregularities in a wide range of scale sizes from less than a meter to several tens of kilometres. The data sample rate used was 1667 samples per second. The observable frequency range, therefore, extends from 0 to 833 Hz. The main objective of the launch was to study the equatorial ionosphere under conditions unfavourable for the generation of bubbles and thereby for the non-operation of the Rayleigh-Taylor instability mechanism.
The electron density profiles obtained from the HFC data for the rocket upleg and downleg are shown in Figure 4.
1E+8 1E+9 1E+10 1E+11 1E+12
ELECTRON DENSITY (m-3) 0 100 200 300 400 500 AL TI TU DE (k m ) NATAL, BRAZIL 31 OCT. 1986, 22:59 (LT) Upleg Downleg IRI-95
Figure 4 – Altitude profiles of the electron density estimated from the HFC data
for the rocket upleg and downleg on 31-st October, 1986. Also shown in the figure is the IRI-95 model profile.
One of the major aspects of the electron density profiles obser-ved is the presence of the F-region base at a relatively low altitude, close to 200 km during both upleg and downleg of the rocket. In this height region the recombination coefficient for the electron density is rather high and it can be shown that this condition is not favourable for the operation of the Rayleigh-Taylor Instability mechanism. Predominantly negative gradients are observed in the topside above the F-peak. Such gradients favour the generation of smaller scale plasma irregularities through the CFI mechanism under normal night time downward electric field conditions.
Thek-spectra of electron density irregularities estimated for selected height regions are shown in Figure 5. As can be seen from the figure, during the upleg, the rocket encountered electron density irregularities in the E-region and in the valley between the E and F-region (left panel of Fig. 5). During downleg the rocket did not observe electron density irregularities practically in any height region (right panel of Fig. 5).
A striking feature seen in the spectra observed during the downleg is a dominant spectral peak corresponding to the wavelength of about 6 m which, though much reduced in power, is also seen in the upleg spectra corresponding to the altitudes of 100 km and 180 km. They represent injection of large wave energies at this wavelength the source or the operating mecha-nism for which is not well understood.
Rocket flight on 14-th October 1994
During this launch, aBlack Brant X rocket carried on board se-veral plasma density probes. The rocket was launched from the Brazilian equatorial launch station in Alcˆantara-MA at 1955 hrs (LT) on 14-th October, 1994 and reached an apogee altitude of 957 km and a horizontal range of 532 km (LaBelle et al., 1997). The plasma probes included a conventional Langmuir probe (LP), a High Frequency Capacitance (HFC) probe and a Plasma Fre-quency probe (PFP). The LP had a sampling rate of 500 per se-cond, the PFP a sampling rate of about 8000 samples per second and the HFC a low sampling rate.
Figure 6 shows the electron density profiles for the rocket upleg and downleg estimated from the HFC probe data.
Electron density structures
Electron density irregularities of a wide range of scale sizes were observed during this flight in the height region of 340 km to 817 km during rocket upleg and height region of 600 km to 310 km during the rocket downleg. The F-region base was seen well above 300 km that is considered to be favourable for the
100 101 102 103 -160 -140 -120 -100-80 -60 -40 -200
k (km
-1)
-0,01 -4,31 100 km -160 -140 -120 -100-80 -60 -40 -200 180 km 1,54 -2,73 -160 -140 -120 -100-80 -60 -40 -200 -2,2 0,56 200 km10
lo
g(
dn
e/n
e)
2 -160 -140 -120 -100-80 -60 -40 -200 -2,05 0,14 220 km 100 101 102 103 -150 -100 -50 0 -3,7 -0,52 100 km 10 lo g( dne /ne ) 2 k (km-1) -150 -100 -50 0 -2,00 180 km -0,8Figure 5 – Log-log plots of irregularity spectral power versus wave numberk (in km−1) for selected height regions during the rocket upleg (left) and downleg (right). Each spectrum corresponds to a time interval of about 1.2 s.
operation of the Rayleigh-Taylor Instability mechanism. Large-scale electron density structures are produced by the RTI mecha-nism, the scale sizes ranging from several kilometres to several tens of kilometres. Electron density depletions where the density reduced by a factor of 2.6 in a vertical extension of about 1 km is seen in the height region of about 497 km. In the height region close to 535 km the density increased again by a factor of 1.8 within a vertical height range of 2.7 km. Electron density structu-res of scale sizes of hundreds of metstructu-res, probably generated by the CFI or GDI mechanism, were also seen superposed on the large scale structures.
Dominant positive electron density gradients were obser-ved during the rocket upleg in two height regions, one close to 313 km, and the other close to 547 km. Dominant negative elec-tron density gradients were observed during the rocket upleg close to 396 km, 475 km, and 627 km. The downleg profile shows less number of regions of electron density gradients, dominant posi-tive gradients being observed close to 373 km and 505,5 km.
1E+8 1E+9 1E+10 1E+11 1E+12 1E+13
ELECTRON DENSITY (m-3) 0 100 200 300 400 500 600 700 800 900 1000 AL TI TU DE (k m ) ALCANTARA, BRAZIL 14. OCT. 1994 19:55Hrs.(LT) Upleg Downleg IRI-95
Figure 6 – Altitude profiles of the electron density estimated from the HFC data
for the rocket upleg and downleg on 14-th October, 1994. Also given in the figure is the IRI-95 model profile.
-160 -140 -120 -100-80 -60 -40 -200 117km -2,5 -3,65 10 lo g( dne /ne ) 2 127km -1,9 -5,1 137km -1,2 -4,5 -160 -140 -120 -100-80 -60 -40 -200 178km -2,6 -4,1 10 lo g( dne /ne ) 2 238km -2,8 -5,18 250km -2,3 -5,4 -160 -140 -120 -100-80 -60 -40 -200 258km -1,9 -4,88 10 lo g( dne /ne ) 2 388km -1,8 -4,5 398km -1,4 -4,4 100 101 102 103 -160 -140 -120 -100-80 -60 -40 -200 -2,1 -5,3 438km 10 lo g( dne /ne ) 2 k (km-1) 10 0 101 102 103 508km -2,8 -4,58 k (km-1) 10 0 101 102 103 518km -1,38 -4,52 k (km-1)
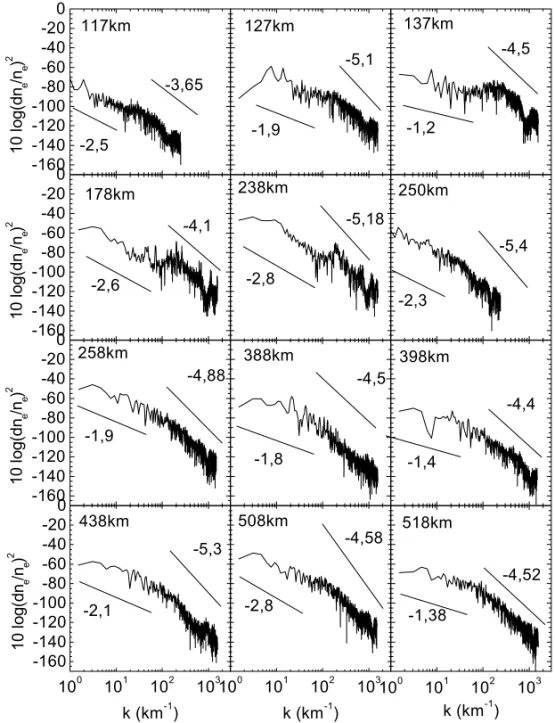
Figure 7 – Log-log plots of irregularity spectral power versus wave numberk (in km−1) for selected height regions during the rocket upleg estimated from LP data. Each spectrum corresponds to a time interval of 1.2 s.
The electron density spectra observed with the Langmuir Probe (LP) on board for selected height regions are shown in Figures 7 and 8 and those observed with the Plasma Frequency Probe (PFP) are shown in Figure 9. The data sampling rate of 500 s−1for the LP put the upper limit for the observable wave number at a little over 1000 km−1, while the data sampling rate of 8000 s−1for the PFP, put this limit at a little over 40.000 km−1. As can seen from Figure 7, the density spectra at observed at the heights of 117 km to 258 km correspond to the valley between the E- and F-regions, that is practically devoid of any region of large electron density gradients. The generation of these irregu-larities, therefore, cannot be attributed to the CFI or GDI
mecha-nism. The intermediate scale irregularities in these height regi-ons show spectral indices varying from –1.2 to –2.8 and have more power compared with the small scale irregularities which show steeper spectra with indices varying in the range of –3.65 to –5.18. The generation mechanism of these irregularities is still not clearly known. The break in spectral index between the inter-mediate scale and the small-scale irregularities in these spectra neither occurs at a specific wave number nor follows a regular pattern of variation.
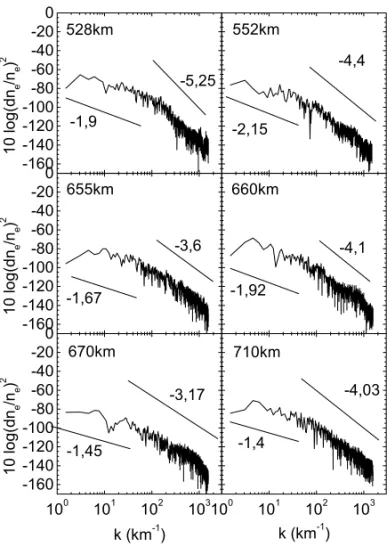
The spectral characteristics at heights above the F-peak, as shown in Figures 7 and 8, do not differ considerably from those observed below the F-peak, except for the fact that the break in
the spectral index in this case occurs at a rather narrow range of wave number values. In the spectra observed above the F-peak, the break in the index occurs somewhere between the wave numbers 40 km−1and 100 km−1that correspond to scale si-zes in the range of 160 m and 60 m with a mean value close to 100 m mentioned often in the literature (LaBelle & Kelley, 1986; Hysell et al., 1994). The small-scale irregularities exhibit power spectral indices varying in between –3.17 at 670 km and –5.25 at 528 km without any regular height variation pattern. This is within the range of what is expected for the gradient drift waves.
-160 -140 -120 -100-80 -60 -40 -200 528km -1,9 -5,25 10 lo g( dne /ne ) 2 552km -2,15 -4,4 -160 -140 -120 -100-80 -60 -40 -200 655km -1,67 -3,6 10 lo g( dne /ne ) 2 -1,92 -4,1 660km 100 101 102 103 -160 -140 -120 -100-80 -60 -40 -200 -1,45 -3,17 670km 10 lo g( dne /ne ) 2 k (km-1) 100 101 102 103 710km -1,4 -4,03 k (km-1)
Figure 8 – Log-log plots of irregularity spectral power versus wave numberk (in km−1) for selected height regions during the rocket upleg estimated from LP data. Each spectrum corresponds to a time interval of 1.2 s.
The spectral distribution of power, as measured by the PFP si-multaneous with the LP are shown in Figure 9 for selected height regions. An apparently puzzling observation is the difference in the spectral breaking point as observed in the LP and PFP spec-tral data as revealed by the Figures 7 to 9. The specspec-tral break as observed the PFP experiment seems to occur at a much larger wave number (smaller scale size) close tok = 1000 km−1(λ ∼= 6 m) while the spectral break in the LP data occurs close tok = 65 km−1(λ ∼= 100 m). It should be pointed out here that the observable wave number range for the LP experiment goes up to
aboutk = 1000 km−1, while that for the PFP experiment goes to more than 40.000 km−1. A comparison of Figure 9 with Figu-res 7 and 8 also shows that PFP spectra in the region of small-scale irregularities have lower slopes compared to the LP spectra. A closer observation of the LP spectra gives an indication of a tendency for the spectral slope to decrease fork values above about 700 km−1. Thus the difference in the spectral breaking point as observed by the LP and PFP experiments may be only apparent. The fact maybe that there exist two breaking points in the spectra, one close to aboutk = 65 km−1and the other close tok = 1000 km−1. The first spectral break point is not clearly seen in the PFP spectra simply because the spectral width extends up to a much larger wave number.
-200 -180 -160 -140 -120 -100-80 -60 -40 -200 340km -1,7 -4,07 10 lo g( dne /ne ) 2 -1,4 -3,6 347 km -200 -180 -160 -140 -120 -100-80 -60 -40 -200 -3,1 -1,7 352km 10 lo g( dne /ne ) 2 458km -1,4 -3,5 -200 -180 -160 -140 -120 -100-80 -60 -40 -200 -1,7 -3,3 465km 10 lo g( dne /ne ) 2 100 101 102 103 104 105 -1,9 -3,1 471km 100 101 102 103 104 105 -200 -180 -160 -140 -120 -100-80 -60 -40 -200 477 km -1,3 -3,8 10 lo g( dne /ne ) 2 k (km-1)
Figure 9 – Log-log plots of irregularity spectral power versus wave numberk (in km−1) for selected height regions during the rocket upleg estimated from PFP data. Each spectrum corresponds to a height range of 3 km.
In spite of these differences, both LP and PFP spectra exhi-bit spectral characteristics that confirm the theoretical predicti-ons and earlier experimental observatipredicti-ons that the intermediate scale irregularities are produced by the RTI or GRTI mechanism, and the shorter scale sizes are later produced by the CFI or GDI
mechanisms in regions of large horizontal or vertical gradients in electron density.
Rocket flight on 18-th December 1995
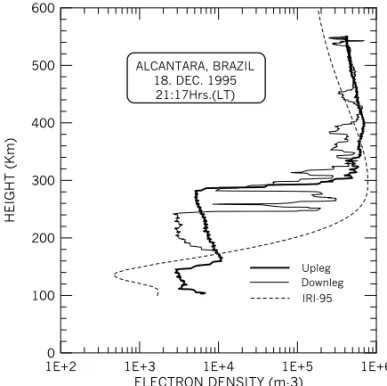
A Brazilian Sonda III rocket, carrying a Langmuir probe (LP), a High Frequency Capacitance (HFC) probe and an Electric Field double probe (EFP) was launched at 2117 hrs (LT) on the 18-th December, 1995 from the Brazilian equatorial launching station Alcˆantara-MA. The rocket reached an apogee altitude of 557 km and a horizontal range of 589 km. The ac data from the LP and EFP experiments were sampled at 1250 samples per second, that enabled the study of small scale electron density electric field fluc-tuations of scale sizes greater than 3 meters.
1E+2 1E+3 1E+4 1E+5 1E+6
ELECTRON DENSITY (m-3) 0 100 200 300 400 500 600 H EI GH T (K m ) ALCANTARA, BRAZIL 18. DEC. 1995 21:17Hrs.(LT) Upleg Downleg IRI-95
Figure 10 – Altitude profiles of the electron density estimated from the LP data
for the rocket upleg and downleg on 18-th December, 1995. Also shown in the figure is the IRI-95 model profile.
Figure 10 shows the variation of electron density with altitude estimated from the LP data for both the upleg and downleg of the rocket. As can be seen from the figure the upleg profile shows the presence of a rather steep F-region base close to 300 km, free of any large scale electron density depletions or bubbles, while the downleg profile shows the presence of a large number of plasma bubbles. The downleg profile does not show a sharp F-region base. Thus though the base height at 300 km favoured the opera-tion of RTI mechanism, the absence of large or intermediate scale fluctuations in electron density indicated that the RTI mechanism was not still operating. The downleg profile, on the other hand, exhibited very large scale fluctuations in electron density not only in the expected base of the F-region but also on topside. This large
difference between the upleg and downleg profiles could be attri-buted to the fact that the rocket traversed through different height regions separated by a few hundreds of kilometres during upleg and downleg.
Electron density structures
The positive electron density gradient at the base of the F-region extends from about 280 km to above 300 km, the electron density in this region increasing by a factor of 7 over a vertical extension of about 7 km. This condition is favourable for the operation of RTI mechanism. At the same time one should remember that large or intermediate scale irregularities known to be produced by the RTI mechanism are not observed in the upleg profile. This pro-bably is due to the fact that the RTI mechanism had just started operating and the large-scale irregularities produced could only be seen in the rocket downleg profile. Enhanced electron densi-ties were seen in the downleg profile close to the height regions of 253 km, 269 km and 276 km, and depleted regions close to 259 km and 282 km.
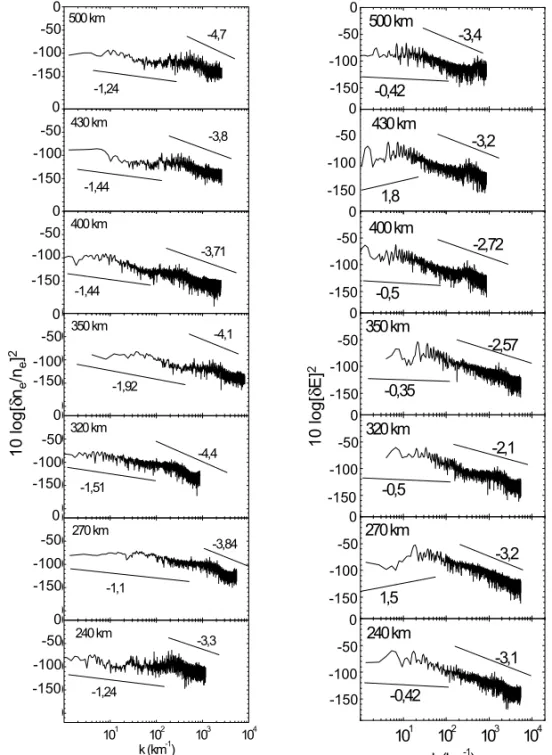
A detailed analysis of the spectral features of the electron den-sity and electric field fluctuations observed during this flight is re-ported in Muralikrishna et al. (2003). Some aspects relevant for the present study are given here. Figures 11 and 12 show side by side the electron density and electric field spectra observed at selected heights for the rocket upleg and downleg respectively.
A close look at the two lower most spectra in both left and right panels of Figure 11, corresponding to the altitudes 240 km and 270 km, indicates the presence of a couple of rather sharp spectral lines probably representing the injection of energy. These spectral peaks observed in both electron density and electric field spectra may represent waves carrying energy upward from the region below the F-peak. These spectral peaks correspond to the transitional region of wave numbers between the intermediate and small scale. These spectral lines are not seen the spectra corres-ponding to the base of the F-region or on top side. Kelley et al. (1982) reported electron density spectra with a mean spectral in-dex of –5 and the electric field spectra with a mean spectral inin-dex of –3 for height regions above 280 km. As can be seen from Fi-gures 11 and 12, the present observations are not in conformity with these results. The spectra of small-scale electron density ir-regularities, in the present case, exhibit spectral indices varying between –2.58 and –4.7, while the electric field spectra at the same scale sizes exhibit indices varying between –2.1 and –4.9. Analysis of thek-spectra of irregularities shows spectral in-dices in the range of –3.3 to –3.8 at height regions of 240 km
00 101 102 103 104 -0,8 -2,82 240 km k (km-1) -1,0 -3,48 270 km -0,4 -4,34 300 km -0,64 -4,3 325 km -0,6 -4,9 370 km -0,6 -2,8 450 km
Figure 11: Log-log plots of electron density (left) and electric field (right)
10 lo g[ δne /ne ] 2 0 -40 -80 -120 0 0 0 0 0 -40 -40 -40 -40 -80 -80 -80 -80 -120 -120 -120 -120 -80 -40 -120 10 lo g[ δE ] 2 0 -50 -100 -150 0 0 0 0 0 -50 -50 -50 -50 -50 -100 -100 -100 -100 -100 -150 -150 -150 -150 -150 00 101 102 103 k (km-1) -1,36 -3,3 240 km -1,36 -3,8 270 km -1,11 -3,92 300 km -0,72 -3,06 325 km -1,15 -2,58 370 km -1,2 -2,7 450 km
Figure 11 – Log-log plots of electron density (left) and electric field (right) irregularity spectral power versus
wave numberk (in km−1) for selected height regions during the rocket upleg.
and 270 km during upleg and at 270 km during rocket downleg. These height regions correspond to the base of the F-region where the internal gravity wave generated winds are known to be strong (Raizada & Sinha, 2000). But, analysing the height regions close to 300 km, 325 km and 370 km, which are just above the base of the F-region, one can see that these are the regions where
the plasma bubbles start developing as seen in the upleg pro-file, and where large-scale bubbles are well developed as seen in the downleg profile. The presence of smaller scale irregularities in these height regions indicate the operation of CFI also, thus confirming the hypothesis that the RTI and CFI mechanisms ope-rate in a sequential manner, the larger and intermediate scale sizes
00 101 102 103 104 -0,42 -3,1 240 km k (km-1) 1,5 -3,2 270 km -0,5 -2,1 320 km -0,35 -2,57 350 km -0,5 -2,72 400 km 1,8 -3,2 430 km -0,42 -3,4 500 km 10 lo g[ δne /ne ] 2 0 -50 -100 -150 0 0 0 0 0 -50 -50 -50 -50 -100 -100 -100 -100 -150 -150 -150 -150 -100 -50 -150 0 -50 -100 -150 10 lo g[ δE ] 2 0 -50 -100 -150 0 0 0 0 0 -50 -50 -50 -50 -50 -100 -100 -100 -100 -100 -150 -150 -150 -150 -150 0 -50 -100 -150 00 101 102 103 104 0 0 0 0 0 -1,24 -3,3 240 km k (km-1) 0 0 0 0 0 -1,1 -3,84 270 km 0 0 0 0 0 -1,51 -4,4 320 km 0 0 0 0 0 -1,92 -4,1 350 km -1,44 -3,71 400 km -1,44 -3,8 430 km -1,24 -4,7 500 km
Figure 12 – Log-log plots of electron density (left) and electric field (right) irregularity spectral power versus
wave numberk (in km−1) for selected height regions during the rocket upleg.
being generated first by the RTI mechanism and then the smaller scale sizes being generated at regions of favourable electron den-sity gradients by the CFI mechanism.
CONCLUSIONS
• Present results confirm the theoretical predictions and ear-lier observations that under favourable conditions iono-spheric plasma at the base of the F-region can become unstable for perturbations and large and intermediate scale plasma irregularities may be produced by the
Rayleigh-Taylor instability mechanism. During one of the launches reported here the ambient conditions were not favourable for the operation of the RTI mechanism and only very low amplitude plasma irregularities were observed during this flight confirming the expectations.
• The presence of a few sharp spectral lines with rather large power were observed in some of the power spectra of elec-tron density and electric field irregularities reported here. These are not supported neither by the existing theories nor the earlier observations. These spectral lines seem
to transport energy from below the base of the F-layer to higher altitudes, losing their energy during this process to probably larger wavelengths.
• Present observations indicate that a higher F-region base is more favoured for the operation of RTI mechanism than a lower F-region base.
• A cascade process seems to be initiated first by the ope-ration of RTI mechanism resulting in the development of plasma bubbles or large-scale irregularities. In the height regions of large electron density gradients inside these bubbles the plasma may become unstable for the CFI mechanism, causing the generation of smaller scale irre-gularities.
• A comparison of the spectral indices of the electron density and electric field irregularities does not confirm the earlier observation that the electric field spectra are much flatter than the electron density spectra.
ACKNOWLEDGMENTS
The authors are grateful to the Directors of IAE/CTA and CLA, Alcˆantara for providing the rockets and the launch facilities res-pectively and to the staff of IAE and CLA for their help during the pre-launch tests of the experiments, and during the launching of the rockets. Sincere thanks are to Sinval Domingos, Agnaldo Eras and Narli Baesso Lisboa for their technical help in the deve-lopment testing and integration of the experiments. The electron density data from the Langmuir probe and the Plasma Frequency probe during one of the launches reported here were provided by Jim LaBelle. The work reported here was partially supported by FINEP under contract FINEP-537/CT and by CNPq under process 300253/89-3/GM/FV.
REFERENCES
BALSLEY BB, HAERENDEL G & GREENWALD RA. 1972. Equatorial spread-F: recent observations and a new interpretation. J. Geophys. Res., 77: 5625.
BASU S, BASU Su., LABELLE J, KUDEKI E, FEJER BG, KELLEY MC, WHITNEY HE & BUSHBY A. 1983. Gigahertz scintillations and spaced receiver drift measurements during project Condor equatorial F region rocket campaign in Peru. J. Geophys. Res., 91: 5526–5538.
CHIU YT & STRAUS JM. 1979. Rayleigh-Taylor and wind driven ins-tabilities of the nighttime equatorial ionosphere. J. Geophys. Res., 84: 3283–3290.
COSTA E & KELLEY MC. 1978a. On the role of steepened structures and drift waves in equatorial spread-F. J. Geophys. Res., 83: 4359–4364. COSTA E & KELLEY MC. 1978b. Linear theory for the collisionless drift wave instability with wavelengths near the ion gyro radius. J. Geophys. Res., 83: 4365–4368.
DUNGEY JW. 1956. Convective diffusion in the equatorial F-region. J. Atmos. Terr. Phys., 9: 204.
DYSON PL, McCLURE JP & HANSON WB. 1974. In situ measurements of spectral characteristics of F-region ionospheric irregularities. J. Geo-phys. Res., 79: 1497.
HAERENDEL G. 1974. Theory of equatorial spread-F, Report of Max Planck Institut f¨ur Physik und Astrophysik, Garching, West Germany. HUBA JD & OSSAKOW SL. 1979. On the generation of 3 m irregulari-ties during equatorial spread-F by low frequency drift waves. J. Geophys. Res., 84: 6697.
HUDSON MK, KENNEL CF & KAW PK. 1973. Two step drift mode theory of equatorial spread-F. Trans. Am. Geophys. Soc., 54: 1147.
HUDSON MK, KENNEL CF & KAW PK. 1974. A two-step drift mode the-ory of equatorial spread-F. Eos Trans. of AGU, 55: 381.
HUDSON MK & KENNEL CF. 1975. Linear theory of equatorial spread-F. J. Geophys. Res., 80: 4581.
HYSELL D, KELLEY MC, SWARTZ WE, PFAFF RF & SWENSON CM. 1990. Seeding and layering of equatorial spread-F by gravity waves. J. Geophys. Res., 95: 17253–17260.
HYSELL D, KELLEY MC, SWARTZ WE & WOODMAN RF. 1994. Steepe-ned structures in equatorial spread-F. 1. New observations. J. Geophys. Res., 99: 8827–8840.
KELLEY MC, HAERENDEL G, KAPPLER H, VALENZUELA A, BALSLEY BB, CARTER DA, ECKLUND WL, CARLSON CW, HAUSLER B & TOR-BERT R. 1976. Evidence for a Rayleigh-Taylor type instability and upwel-ling of depleted density regions, during equatorial spread-F. Geophys. Res. Lett., 3: 448–450.
KELLEY MC, LIVINGSTON RC, RINO CL & TSUNODA RT. 1982. The ver-tical wave number spectrum of topside equatorial spread-F: Estimates of backscatter levels and implications for a unified theory. J. Geophys. Res., 87: 5217.
KELLEY MC & McCLURE JP. 1981. Equatorial spread-F: A review of recent experimental results. J. Atmos. Terr. Phys., 43: 427.
KELLEY MC & MOZER FS. 1972. A satellite survey of vector electric fi-elds in the ionosphere at frequencies of 10 to 500 hertz. J. Geophys. Res., 77: 4183.
KESKINEN MJ, SZUSZCZEWICZ EP, OSSAKOW SL & HOLMES JC. 1981. Non linear theory and experimental observations of the local col-lisional Rayleigh-Taylor instability in a descending equatorial spread-F ionosphere. J. Geophys. Res., 86: 5785–5792.
LABELLE J & KELLEY MC. 1986. The generation of kilometre scale size irregularities in equatorial spread-F. J. Geophys. Res., 91: 5504–5512. LABELLE J, JAHN JM, PFAFF RF, SWARTZ WE, SOBRAL JHA, ABDU MA, MURALIKRISHNA P & DE PAULA ER. 1997. The Brazil Guar´a cam-paign: Results of the large-scale measurements. Geophys. Res. Lett., 24: 1691–1695.
LIVINGSTON RC, RINO CL, McCLURE JP & HANSON WB. 1981. Spec-tral characteristics of medium-scale equatorial F region irregularities. J. Geophys. Res., 86: 2421.
McCLURE JP, HANSON WB & HOFFMAN JH. 1977. Plasma bubbles and irregularities, in the equatorial ionosphere. J. Geophys. Res., 82: 2650–2656.
MORSE FA, EDGAR BC, KOONS HC, RICE CJ, HEIKKILA WJ, HOFFMAN JH, TINSLEY BA, WINNINGHAM JD, CHRISTENSEN AB, WOODMAN RF, POMALAZA J & TEIXEIRA RN. 1977. Equion, an equatorial ionospheric irregularity experiment. J. Geophys. Res., 82: 578–592.
MURALIKRISHNA P, VIEIRA LP & ABDU MA. 2003. Electron density and electric field fluctuations associated with developing plasma bub-bles. J. Atmos. Solar-Terr. Phys., 65: 1315–1327.
OSSAKOW SL. 1979. Ionospheric irregularities. Rev. Geophys. Space Phys., 17: 521.
OTT E. 1978. Theory of Rayleigh-Taylor bubbles in the equatorial iono-sphere. J. Geophys. Res., 83: 2066–2070.
PRAKASH S, PAL S & CHANDRA H. 1991. In situ studies of equato-rial spread-F over SHAR- steep gradients in the bottomside F-region and transitional wavelength results. J. Atmos. Terr. Phys., 53: 977–986. RAGHAVARAO R, GUPTA SP, SEKAR R, NARAYANAN R, DESAI JN, SRIDHARAN R, BABU VV & SUDHAKAR V. 1987. In situ measurements of wind, electric fields and electron densities at onset of equatorial spread-F. J. Atmos. Terr. Phys., 49: 485–492.
RAIZADA S & SINHA HSS. 2000. Some new features of electron density irregularities over SHAR during strong spread-F. Ann. Geophysicae, 18: 141–151.
REID GC. 1968. Small scale irregularities in the ionosphere. J. Geophys. Res., 73: 1627–1640.
RINO CL, TSUNODA RT, PETRICEKS J, LIVINGSTON RC, KELLEY MC & BAKER KD. 1981. Simultaneous rocket-borne beacon and in situ mea-surements of equatorial spread-F. J. Geophys. Res., 86: 2411. SCANNAPIECO AJ & OSSAKOW SL. 1976. Non-linear equatorial spread-F. Geophys. Res. Lett., 3: 451–454.
SCHUNK RW & NAGY AF. 2000. Ionospheres: Physics, Plasma Physics and Chemistry, Cambridge University Press.
SEKAR R & RAGHAVARAO R. 1987. Role of vertical winds on the Rayleigh-Taylor mode instabilities of the night-time equatorial iono-sphere. J. Atmos. Terr. Phys., 49: 981–985.
SINGH S, BAMGBOYE DK, McCLURE JP & JOHNSON FS. 1997. Morphology of equatorial plasma bubbles. J. Geophys. Res., 102: 20019–20029.
SINHA HSS, RAIZADA S & MISRA RN. 1999. First simultaneous in situ measurement of electron density and electric field fluctuations during spread-F in the Indian zone. Geophys. Res. Lett., 26: 1669–1672. SINHA HSS & RAIZADA S. 2000. First in situ measurement of electric field fluctuations during strong spread-F in the Indian zone. Ann. Geo-physicae, 18: 523–531.
SUDAN RN, AKINRIMISI J & FARLEY DT. 1973. Generation of small-scale irregularities in the equatorial electrojet. J. Geophys. Res., 78: 240–248.
SZUSZCZEWICZ EP, TSUNODA RT, NARCISI R & HOLMES JC. 1981. Plumex II: A second set of coincident radar and rocket observations of equatorial spread-F. Geophys. Res. Lett., 8: 803–806.
TSUDA T, SATO T & MATSUSHITA S. 1969. Ionospheric irregularities and cross-field plasma instability. J. Geophys. Res., 74: 2923–2932. VALLADARES CE, HANSON WB, McCLURE JP & CRAGIN BL. 1983. Bottomside sinusoidal irregularities in the equatorial F region. J. Geo-phys. Res., 88: 8025.
WOODMAN RF & LA HOZ C. 1976. Radar observations of equatorial F-region irregularities. J. Geophys. Res., 81: 5447–5466.
ZALESAK ST, OSSAKOW SL & CHATURVEDI PK. 1982. Nonlinear equa-torial spread-F: The effect of neutral winds and background Pedersen conductivity. J. Geophys. Res., 87: 151.
NOTES ABOUT THE AUTHORS
Polinaya Muralikrishna graduated in Physics and Mathematics, in 1967, at the University of Kerala, India. He obtained his Master’s Degree in Physics, in 1969, at
the University of Kerala, and Doctor’s Degree in Equatorial Aeronomy, in 1975, at the Physical Research Laboratory, University of Gujarat, India. Presently he is working as a Senior Scientist in the Aeronomy Division of the Instituto Nacional de Pesquisas Espaciais – INPE/MCT. His areas of interest are Aeronomy, Space Geophysics and Rocket and Satellite-borne Instrumentation.
Leandro Paulino Vieira graduated in Industrial Mechanical Engineering, in 1998, at Escola de Engenharia Industrial de S˜ao Jos´e dos Campos-SP, Brazil.
He did the Course of Technician/Professional, in 1992, at the Departamento Regional de S˜ao Paulo, SENA/SP, Brazil and Master’s Degree in Space Geophysics, in 2002, at the Instituto Nacional de Pesquisas Espaciais – INPE/MCT, Brazil. His areas of interest are Industrial Mechanical Engineering and Space Geophysics.

![Figure 11: Log-log plots of electron density (left) and electric field (right) 10 log[δne/ne]20-40-80-12000000-40-40-40-40-80-80-80-80-120-120-120-120-80-40-12010 log[δE]20-50-100-15000000-50-50-50-50-50-100-100-100-100-100-150-150-150-150-15000101102103 k](https://thumb-eu.123doks.com/thumbv2/123dok_br/17844512.845984/12.1063.240.762.147.1008/figure-log-plots-electron-density-electric-field-right.webp)