Combined ESR and EISCAT observations of the dayside polar cap and auroral oval during the May 15, 1997 storm
Texto
Imagem


Documentos relacionados
financeiras, como ainda por se não ter chegado a concluo entendimento quanto à demolição a Igreja de S. Bento da Ave-Maria, os trabalhos haviam entrado numa fase
É um período de grandes mudanças na Ciência e tem as principais características na obra de Galileu, inspirado pelas idéias de Francis Bacon (falecido em 1626) e Descartes
The probability of attending school four our group of interest in this region increased by 6.5 percentage points after the expansion of the Bolsa Família program in 2007 and
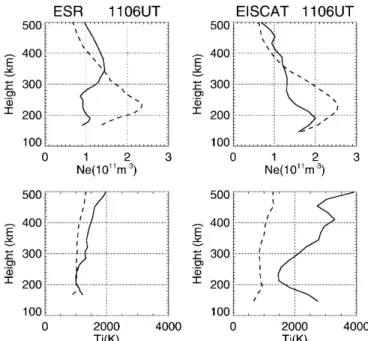
Second, electron density profiles measured with the EISCAT UHF radar in vicinity of the heating cycles are overcritical, and no E region topside at the altitude of the observed
The structure of the remelting zone of the steel C90 steel be- fore conventional tempering consitute cells, dendritic cells, sur- rounded with the cementite, inside of
For every valid E-region profile in the EISCAT data set, besides the electric field (both magnitude and azimuth) mea- surements, the “mean” electron density (n e ) peak, and
the thermal bulk oxygen ion population based on a data analysis using the EISCAT VHF radar CP-7 data obtained at Tromsù during the period between 1990 and 1996: (1) both ion up¯ow
Neste trabalho o objetivo central foi a ampliação e adequação do procedimento e programa computacional baseado no programa comercial MSC.PATRAN, para a geração automática de modelos
