Braz. J. of Develop.,Curitiba, v. 6, n. 7, p. 50471-50491 jul. 2020. ISSN 2525-8761
Iris image quality assessment based on ISO/IEC 29794-6:2015 standard /
Avaliação da qualidade da imagem da íris com base na norma ISO / IEC
29794-6: 2015
DOI:10.34117/bjdv6n7-629
Recebimento dos originais:03/06/2020 Aceitação para publicação:23/07/2020
Rodrigo Nani França
Mestre em Engenharia de Sistemas e Automação pela Universidade Federal de Lavras Instituição: Universidade Federal de Lavras
Endereço: Câmpus Universitário, Caixa Postal 3037, CEP:37200-000, Lavras - MG - Brasil E-mail: [email protected]
David Augusto Ribeiro
Mestrando em Engenharia de Sistemas e Automação pela Universidade Federal de Lavras Instituição: Universidade Federal de Lavras
Endereço: Câmpus Universitário, Caixa Postal 3037, CEP:37200-000, Lavras - MG - Brasil E-mail: [email protected]
Renata Lopes Rosa
Professora Adjunto do DCC na Universidade Federal de Lavras Instituição: Universidade Federal de Lavras
Endereço: Câmpus Universitário, Caixa Postal 3037, CEP:37200-000, Lavras - MG - Brasil E-mail: [email protected]
Demostenes Zegarra Rodriguez
Professor Adjunto do DCC na Universidade Federal de Lavras Instituição: Universidade Federal de Lavras
Endereço: Câmpus Universitário, Caixa Postal 3037, CEP:37200-000, Lavras - MG - Brasil E-mail: [email protected]
ABSTRACT
The iris biometric recognition process is one of the most consistent biometric technology among others that are currently available. However, its efficiency and accuracy can be affected by low-quality iris images used as input to a recognition system, thus, the global performance is decreased. In this context, this paper proposes an evaluation study to determine the impact of the iris image quality on the iris biometric system performance, using the key metrics presented in the ISO/IEC 29794-6:2015 standard. The experimental tests are performed using an iris image database and the OSIRIS biometric recognition software, both of them widely accepted and referenced in the latest research. Experimental results show the interval values of each quality metric and the number of images that accomplish the minimum required values. The performance of the biometric system is assessed by True-Match (TM) and False Non-Match (FNM) parameters; thus, it was possible to identify that the higher the level of image quality, the smaller the FNM value; therefore, the system performance is improved.
Braz. J. of Develop.,Curitiba, v. 6, n. 7, p. 50471-50491 jul. 2020. ISSN 2525-8761 RESUMO
O processo de reconhecimento biométrico da íris é uma das tecnologias biométricas mais consistentes entre outras atualmente disponíveis. No entanto, sua eficiência e precisão podem ser afetadas por imagens de íris de baixa qualidade usadas como entrada para um sistema de reconhecimento, portanto, o desempenho global diminui. Nesse contexto, este artigo propõe um estudo de avaliação para determinar o impacto da qualidade da imagem da íris no desempenho do sistema biométrico da íris, usando as principais métricas apresentadas na norma ISO / IEC 29794-6: 2015. Os testes experimentais são realizados usando um banco de dados de imagens da íris e o software de reconhecimento biométrico OSIRIS, ambos amplamente aceitos e referenciados nas pesquisas mais recentes. Os resultados experimentais mostram os valores de intervalo de cada métrica de qualidade e o número de imagens que atingem os valores mínimos necessários. O desempenho do sistema biométrico é avaliado pelos parâmetros True-Match (TM) e False Non-Match (FNM); assim, foi possível identificar que quanto maior o nível de qualidade da imagem, menor o valor do FNM; portanto, o desempenho do sistema é aprimorado.
Palavras-chave: Sistema biométrico, Reconhecimento de íris, Qualidade de imagem, Padrões
1 INTRODUCTION
Currently, there are several users’ authentication and identification solutions using iris biometric recognition [1], because this is an unique feature of each person and the iris information does not change along the time. Also, the iris information extraction can be performed in a fast and reliable manner and it is also a non-intrusive method.
An iris biometric system, traditionally, includes the following steps: acquisition, segmentation, normalization, extraction patterns, coding and finally the recognition step, which consists in the authentication process of the user in the system. The image acquisition step is extremely important in the process, because if the image presents any quality degradation, either by noise, occlusion or even problems regarding the lighting, then, the next steps may be affected and the accuracy of the system will not be acceptable.
Therefore, the main objective of this research is to study the impact of the iris image quality on the performance of a biometric recognition system. The material for testing is obtained from the database CASIA-Iris-Interval (V3) [2], and the key metrics, available in ISO/IEC 29794-6:2015 standard [3], are implemented and applied to evaluate the iris image quality. The metrics presented in this standard evaluate the iris image quality from two approaches: considering quality metrics for a single image and considering the comparison between two images. In this study, only nine metrics of the first approach will be used.
The parameters used for the analysis of the iris recognition system performance were the True Match (TM) and the False Non-Match (FNM). The first one is used for cases in which the reference value was below to the limit after the comparison of images of authentic individuals,
Braz. J. of Develop.,Curitiba, v. 6, n. 7, p. 50471-50491 jul. 2020. ISSN 2525-8761
indicating that recognition was performed correctly. The second one, FNM, occurs when the iris image analyzed is incorrectly not matched to a truly matching image stored in the database. Thus, the goal of this work is to show that the FNM rate is highly correlated with the quality image scores of the input images.
All images in the database have been processed using the Open Source for Iris (OSIRIS) software [4] to perform the experiment and application of quality metrics. The OSIRIS is an Open Source software developed in C ++ and it has demonstrated a better performance in relation to other similar software for iris biometric recognition [5].
Experimental results show the range values reached for each metric, and the percentage of images that are below of the reference value for each quality metric. Also, the comparison between the images with a number of metrics that are above of reference values and the TM and FNM parameters are presented, in order to demonstrate the impact of quality metrics on iris biometric systems.
In this context, this paper is divided into the following sections: section 2 describes the theoretical revision of concepts of biometrics, the steps involved in an iris biometric recognition and a brief review of the main quality metrics that can be applied to an iris image based on ISO/IEC 29794-6:2015 standard. Section 3 presents the proposed research methodology. Section 4 presents the results achieved with the implementation of quality metrics in a specific database. Finally, in Section 5, the conclusions are presented.
2 THEORETICAL REVIEW
2.1 FUNDAMENTALS OF BIOMETRIC
According to the National Science and Technology Council (NSTC) Subcommittee on Biometrics and Identity Management [6], the use of person identification systems through biometrics, based on their physical and behavioral characteristics, is a very old technique. One of the most basic and ancient forms of biometric recognition was across the face; thus people were identified as known (familiar) and not known (unfamiliar). Other behavioral characteristics were also used as the voice characteristics and distinctive patterns from human locomotion. The first palm image capture system, proposed to be identified, occurred in India in 1858, proposed by William Hershel [7]; few years later, in 1892, Francis Galton [8] presented a study of the fingerprint recognition that is very used nowadays [9]. Currently, there are several biometric systems based on face, hand and ear geometry, voice features, odor, retinal mapping, iris recognition, DNA, among others.
Braz. J. of Develop.,Curitiba, v. 6, n. 7, p. 50471-50491 jul. 2020. ISSN 2525-8761
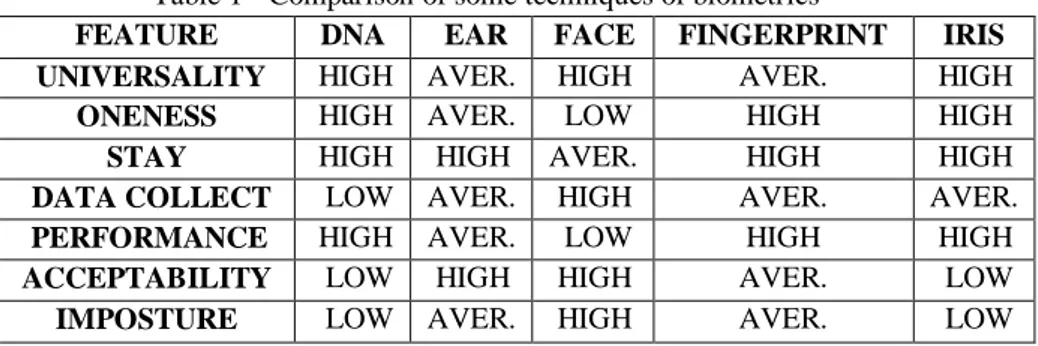
In addition, the biometric systems are classified in unimodal and multimodal. The unimodal systems use the information extracted from a single source and the multimodal system use information from two or more sources [10]. In this paper, the unimodal approach was used, based on iris texture. Table 1 shows a comparison between some biometric techniques and the level of each of the following aspects: universality, distinctiveness, permanence, collectability, performance, acceptability and imposture.
Table 1 - Comparison of some techniques of biometrics
FEATURE DNA EAR FACE FINGERPRINT IRIS UNIVERSALITY HIGH AVER. HIGH AVER. HIGH
ONENESS HIGH AVER. LOW HIGH HIGH
STAY HIGH HIGH AVER. HIGH HIGH
DATA COLLECT LOW AVER. HIGH AVER. AVER.
PERFORMANCE HIGH AVER. LOW HIGH HIGH
ACCEPTABILITY LOW HIGH HIGH AVER. LOW
IMPOSTURE LOW AVER. HIGH AVER. LOW
2.1.1 Iris Biometric Recognition and the OSIRIS Software
In the specific case of iris biometrics, the first idea to use the iris texture as the authentication method was proposed by the ophthalmologist Frank Burch in 1936 and documented by James Daggarts in 1949. However, the proposal to identify automatically an individual through iris features was only made official and patented in 1987 by Aran Safir and Leonard Flom [11]. In 1993, John Daugman developed an algorithm capable of performing the recognition of an individual through iris texture analysis [12]. Briefly, the method is based on wavelet transform and a Gabor filter is represented by a sequence of 256 bytes, this binary representation is called IrisCode. The obtained binary codes are compared by a simple computational logic operation.
In this context, the OSIRIS appeared as a reference system for iris recognition, and its more recent version, OSIRIS 4.1, presents the segmentation process based on the Viterbi algorithm [13]. The software works with the following four stages or modules: segmentation, normalization, coding and recognition [14].
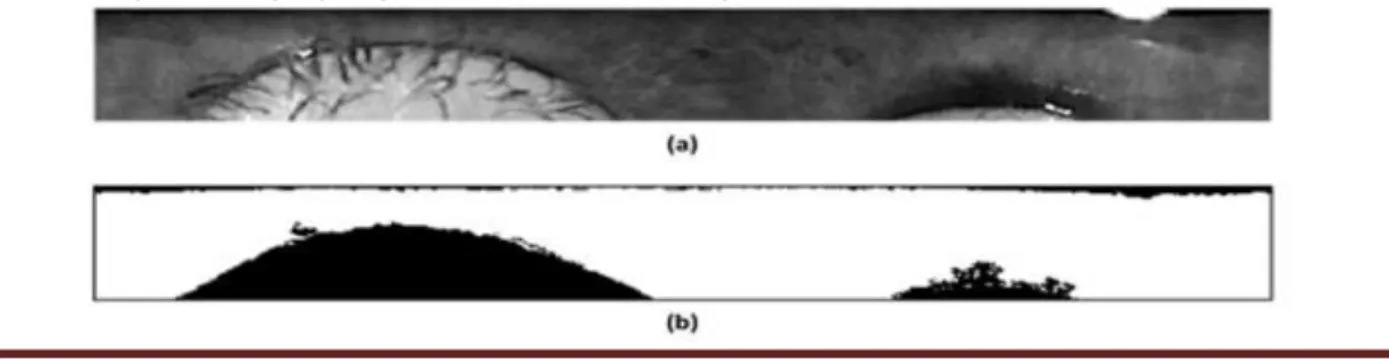
1. Segmentation: We see in Fig. 1, the software tries to identify accuratelythe iris contours, known as the inner region (pupil/iris) and the outer region (iris/sclera) to classify the pixels into two classes: iris and non-iris. As a result, a binary mask, pixels with value 1 for regions of the iris and 0 for non-iris regions, is created. Also, two contour regions (pupil and iris) are generated. In [14] are shown artifacts generated in the segmentation step.
Braz. J. of Develop.,Curitiba, v. 6, n. 7, p. 50471-50491 jul. 2020. ISSN 2525-8761
2. Normalization: As you can see in Fig. 2, involves the transformation of iris area in an invariant image size by applying the method proposed by Daugman: Rubber-sheet-model. This step is also applied to the generated mask [14].
3. Coding: We see in Fig. 4, the iris texture is extracted from the application of a Gabor filter bank, resulting in an iris template. The OSIRIS allows customization of these filters (orientation and resolution). The phases of the Gabor filters are then encoded into 2-byte iris code and (IrisCode) is generated. An iris code sample obtained by encoding step is shown in [14]. In this case it was applied a filter bank comprising three Gabor filters (generating 6 different resolutions). Each Gabor filters have real and imaginary parts in its representation, which are used to form the iris code.
4. Recognition (matching): As you can see in Fig. 4, the recognition step
(matching) compares two iris codes applying the Hamming Distance (HD) between their binary codes represented by the interest points; the selection of these points is customizable. The masks generated in the segmentation module are used to identify and ignore the noise in the original images, improving the accuracy of the results.
The Fig. 4 represents the recognition steps [14], in which the Hamming distance is obtained between two different iris codes. At this stage, the application of interest points are grouped with the binary masks of each of the images and then a XOR operation is applied to the iris codes along the two masks and the predefined application of interest points. Only the points of interest that do not have any kind of noise.
Figure 1 - Segmentation process generated by OSIRIS v4.1. (a) Original image; (B) Binary mask to represent an interest area; (C) Iris segmentation
Figure 2 - Normalized images generated by OSIRIS v4.1. (a) The normalized iris region.; (b) Standard binary mask - same iris region, but highlighting occlusion/noise in black regions
Braz. J. of Develop.,Curitiba, v. 6, n. 7, p. 50471-50491 jul. 2020. ISSN 2525-8761
In one of his studies, John Daugman [15] performed 9.1 million iris comparisons between different individuals and observed that the smallest HD value for the parameter TM was 0.334. Thus, the comparison between two iris images that reached values above of this limit can be considered as images of different individuals, in turn, values below of this HD value can be considered images of the same individual. However, this HD value should be set according to the characteristics and purposes of the implemented system.
Figure 3 - Code/iris template (IrisCode) generated by OSIRIS v4.1
Braz. J. of Develop.,Curitiba, v. 6, n. 7, p. 50471-50491 jul. 2020. ISSN 2525-8761 2.2 EVALUATION OF IRIS IMAGE QUALITY (ISO/IEC 29794-6:2015)
The research area of iris image quality is approached by different authors in different manners and perspectives [16, 17, 18, 19, 20]. In turn, the ISO/IEC 29794-6:2015 standard presents a set of metrics related to iris image quality that should be considered in the capture and/or processing of these images. A summary of these metrics are presented below:
1 UsableIrisArea: is the part of the iris not occluded by eyelids, eyelashes, or specular highlights. It is computed as non-occluded portion of the area between two circles that are close to the iris-sclera boundaries and iris-pupil, expressed as percentage. The calculation is performed as follows: • The approximate boundaries of the iris-sclera and iris-pupil in two circles are defined; • Set Niris as the amount of pixels between the two circles;
• Set Noccluded as the amount of pixels between the two circles which are occluded by the eyelids, eyelashes, or specular reflections.;
• Then, calculate the UsableIrisArea as follows:
An image can be considered acceptable; it must have a value of UsableIrisArea higher than or equal to 70.
2 IrisScleraContrast: is the image features on the boundary between the iris region and the sclera. A low or insufficient contrast may result in failures in the iris image feature extraction process. The calculation is as follows:
• The approximate boundaries of the iris-sclera and iris-pupil in two circles are defined. • Normalize the highlighted region to the iris-sclera boundary be at a distance of 1.0;
• Selecting pixels in a ring whose outer radius is 0.9 and whose inner radius extends to the midpoint between the boundaries of the iris, pupil and iris-sclera, which are not blocked by the eyelids or eyelashes. These are called iris pixels;
• Set iris value (IVisc) as the median of iris pixels;
• Select all pixels that are not occluded by the eyelids, eyelashes, or specular reflections in a ring inner radius and outer radius of 1.1 to 1.2. These are called sclera pixels;
• Set sclera value (SV) as the median of the sclera pixels and then calculate the IrisScleraCont according to the equation:
Braz. J. of Develop.,Curitiba, v. 6, n. 7, p. 50471-50491 jul. 2020. ISSN 2525-8761
Where: PV (pupil value) is defined in the next subsection. The reference value for an acceptable image quality has to be greater than 5.
3 IrisPupilContrast: is the image features on the boundary between the iris and pupil region. Also, the existence of sufficient contrast for an acceptable iris image segmentation is necessary. A low or insufficient contrast may result in failures in the iris image feature extraction process. The calculation is as follows:
• Define the approximate boundaries of the iris, pupil and iris-sclera in two rounds; • Normalize the boundary region of the iris-pupil in a distance of 1.0;
• Select the pixels within a circle of radius 0.8 that are not blocked by the eyelids, eyelashes or boundary of contact lenses. These are called pupil pixels;
• Set pupil value (PV) as the median of the pupil pixels;
• Select all pixels that are not occluded by the eyelids, eyelashes, or specular reflections and in which a ring is 1.1 inner radius and outer radius extends to the midpoint between the boundaries of the iris-pupil and iris-sclera. These points are called iris pixels;
• Set iris value (IVipc) as the median of the pixels of the iris;
• Calculate the first weberRatio and then find the IrisPupilContrast as following equations:
The reference value for an acceptable image quality must be greater than or equal to 30.
4 Pupil Boundary Circularity (PupilBC): It is the circularity of the iris-pupil boundary. It must be measured by the total modulus (sum of squared coefficients) of the real and imaginary parts of the Fourier series expansion on the pupil boundary, depending on the radius of the angle around the center. The PupilBoundaryCircularity equation can be found from C which are the discrete coefficients of Fourier derived from the sequence of rθ.
Braz. J. of Develop.,Curitiba, v. 6, n. 7, p. 50471-50491 jul. 2020. ISSN 2525-8761 The reference value is 100 for a circle and it is [0,100] to other forms.
5 Gray scale utilization: checks the values of pixels of an iris image to show a scattering intensity values in the image of the iris. A useful iris image should have a dynamic range of 256 gray levels, allocating at least 8 bits with a minimum of 6 bits of useful information. In cases of an image underexposed would have very few high intensity pixels. The same problem also occurs to the opposite case, when the image is overexposed. An image with a high score indicates a properly exposed image, with a wide distribution and distributed and intensity values. The calculation must be performed for each gray level i present in the picture, checking the probability of pi. Where pi is the total count of pixels in the gray level i, divided by the total number of pixels in the image. The pixels histogram entropy (H) in bits, is:
The pixels histogram entropy must be greater than or equal to 6 bits to be considered an image with good quality in this regard.
6 IrisRadius: It is the radius of a circle that approaches the iris-sclera boundary. The measurement is performed on pixels and should be performed after segmentation. The reference value must be at least 80 pixels for the smaller iris-human reported. The average radius the human iris is 5.9 millimeters with a strip 5.1 to 6.5 millimeters.
7 PupilIrisRatio: represents the degree of pupil dilation, whether it is contracted or expanded.
The benchmark for images with minimum quality must be between 20 and 70.
8 Iris Pupil Concentricity (IPCo): It is the degree to which the center of the pupil and the iris center are in the same location. The concentricity of the iris and the pupil has to be calculated using
Braz. J. of Develop.,Curitiba, v. 6, n. 7, p. 50471-50491 jul. 2020. ISSN 2525-8761
the Euclidean distance between the centers of the iris and pupil, divided by the iris radius, according to the equation:
Where: (Xi, Yi) and (Xp, Yp) are the center coordinates of the iris and the pupil center, respectively.
The reference value must be greater than or equal to 90.
9 Margin adequacy: quantifies the degree of centralization of the iris region in the image relative to the side of the whole image edges. The first calculation is performed to each of the side regions defining: LeftMargin, RightMargin, UpMargin and DownMargin as:
After, the following adjustments are needed:
Finally, the MarginAdequacy (MAdeq) calculation is expressed by the following equation:
Braz. J. of Develop.,Curitiba, v. 6, n. 7, p. 50471-50491 jul. 2020. ISSN 2525-8761 The reference value, for this quality metric, must be greater than 80.
10 Sharpness: Measures the focus degree on the image. The sharpness is measured by the power spectrum after filtering with a Laplacian of Gaussian operator. The Gaussian standard deviation is 1.4. The steps to perform the Sharpness calculation are:
•A convolution filter with kernel F is defined as:
If I(x, y) is an image, then the weighted sum of I(x,y) according to F is calculated for each fourth row and column position I(x, y). As IF (x,y) representing the filtered output, then:
Where ω and h are width and height of I(x, y), respectively. Then, calculate the square sum (squareSum) IF (x,y):
Then, calculates the power in the IF (x,y):
Where 𝜔𝐹 and ℎ𝐹 are the width and height of 𝐼𝐹(x,y), respectively. Finally, using the equation below sharpness value is calculated:
Braz. J. of Develop.,Curitiba, v. 6, n. 7, p. 50471-50491 jul. 2020. ISSN 2525-8761
3 METHODOLOGY
For this study was developed a framework, due to the huge amount of information to be processed, that considers the implementation of metrics for evaluating image quality, the communication with OSIRIS, and a database to classify the result using diverse criteria.
Table 2 - Metrics iris image quality and their reference values
COD. QUALITY METRICS REFERENCE VALUES (RV) (IDEALS)
Q1 Usable iris area ≥ 70
Q2 Iris-sclera contrast >5
Q3 Iris-pupil contrast ≥ 30
Q4 Pupil boundary circularity 100 to a circle and [0, 100] to other forms
Q5 Gray scale utilization ≥ 6bits
Q6 Iris radius ≥ 80pixels
Q7 Pupil dilation Between 20 and 70
Q8 Iris pupil concentricity ≥ 90
Q9 Margin adequacy >80
Q10 Sharpness Undefined
3.1 THE DATABASE
In experimental research, several public iris image databases were analyzed, and the CASIA-Iris-Interval data version 3.0 was selected for the tests, because it is the most referenced in several related works. This database provides images with different quality levels taken at different sessions of 249 individuals, totaling 2639 images.
3.2 SOFTWARE FOR BIOMETRIC IRIS RECOGNITION
After analyzing some iris biometric recognition software, which provide the source code for simulations and tests [21, 5], was selected as a reference the OSIRIS system. According to an extensive study by Christopher John Ponder [5] the OSIRIS had good results and low processing time compared to other software studied.
Braz. J. of Develop.,Curitiba, v. 6, n. 7, p. 50471-50491 jul. 2020. ISSN 2525-8761 3.3 PRE-PROCESSING DATA
In the experiment was carried out the processing of all 2639 images directly in OSIRIS, with the creation of new data from the images entry, namely: CircleParameters ( ’txt’ file with information about the pupil location points and iris), IrisCode (binary images containing the templates generated), Masks (binary images only highlighting of interest area, after removal possible occlusions and noise), NormalizedImages (original images after normalization by the method Rubber-Sheet-Model proposed by Daugman), NormalizedMask (images of the masks, but normalized in the same manner that NormalizedImages), Scores ( ’txt’ file containing the names of compared images and the Hamming Distance between them) and SegmentedImages (original image highlighting circular regions of the iris / pupil area and occlusion regions).
3.4.IRIS IMAGE QUALITY ASSESSMENT
As stated before, the analysis of signal quality plays an important role in many applications to obtain a better performance [22]-[24], and different methods are implemented to improve the signal quality in different areas, such as communication systems [25]-[32]. Thus, the improvement of the signal quality has a direct impact on the user quality of experience [33]-[36].
After obtaining all the information generated by OSIRIS, the iris image quality assessment metrics presented in ISO/IEC 27974-6:2015 were implemented in MATLAB, with the proposal to map the database study from these metrics. Only the Sharpness metric was not considered, since it is not suggested a reference value for this metric. Thus, all images from the 2639 CASIA-Iris-Interval database were evaluated by the nine selected metrics. To assist in the analysis of results and quality indexes obtained, all data generated by Matlab and OSIRIS have been integrated into a system / database developed using the Microsoft Access software. In this system you can apply filters and sort the evaluated quality criteria. Fig. 5 shows a snapshot of the front-end for the developed system.
Braz. J. of Develop.,Curitiba, v. 6, n. 7, p. 50471-50491 jul. 2020. ISSN 2525-8761
4 RESULTS
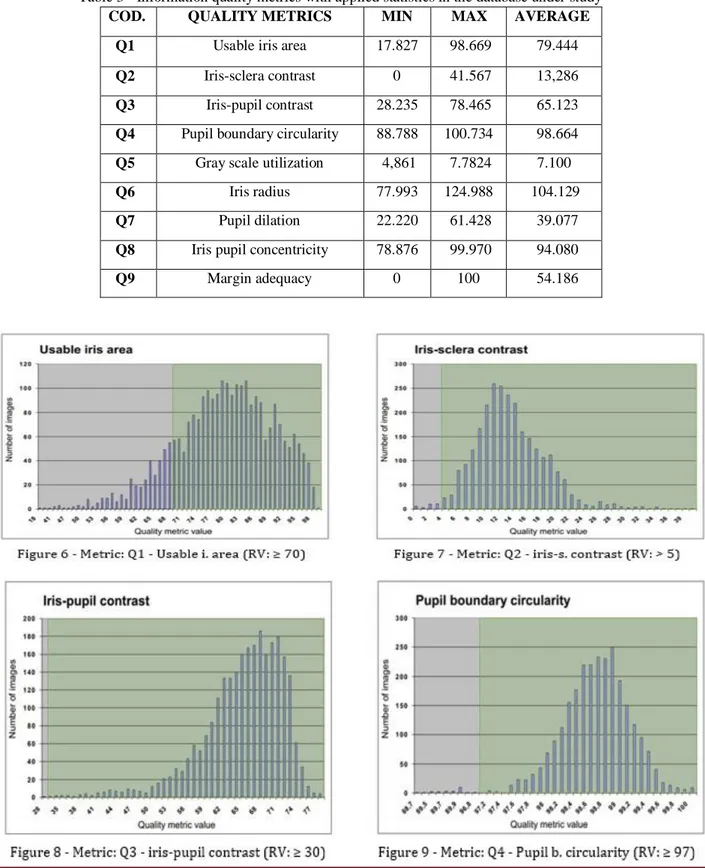
The creation of an integrated database, containing the data generated by OSIRIS together with 9 quality metrics (Q1 to Q9) allowed an analysis of the set of images grouped by metric. The Table 3 shows the statistics (minimum, maximum and average) of each of the evaluated metric among the 2639 images used as test material. Additionally, the graphics for each of the quality metrics used are presented in Figs. 6 to 14. It is also possible to identify in these figures, some regions highlighted, representing the images above the reference values (RV). Thus, they reached the minimum quality score required. Another way to analyze the results is presented in Table 4, in which the images were grouped according to the number of metrics above the reference value. Thus, it can be seen that approximately 75% of the analyzed images (1951 images) reached at least eight of the nine quality metrics above the reference value.
Only 15 images (0.57%) among the 2639, had five quality metrics above the reference values. Also, Figs. 8, 11 and 12 that represent the metrics Q3, Q6 and Q7 respectively, show that the reference values of these metrics were accomplished by almost all the 2639 images analyzed. Then, a revision of these reference values can be studied in order to adjust them. Fig. 15 shows an overview of the metrics used separately, analyzing each of them, it can be observed that only the metric Q9 (Margin adequacy) is below to the other metrics (20%). Probably, when the capture of these images was carried out, they had no concerns about the centralization of the main object (the iris region).
Braz. J. of Develop.,Curitiba, v. 6, n. 7, p. 50471-50491 jul. 2020. ISSN 2525-8761
Another consideration is that around 82% of the images are above the reference values in metric Q1 (Iris Usable Area) and Q8 (Iris Pupil Concentricity), indicating that the images below the reference value Q1 (≈ 18%) may have considerable shortcomings in the recognition; and the values below the reference Q8 (13%) indicate a possible flaw in the iris image segmentation process.
Table 3 - Information quality metrics with applied statistics in the database under study
COD. QUALITY METRICS MIN MAX AVERAGE
Q1 Usable iris area 17.827 98.669 79.444
Q2 Iris-sclera contrast 0 41.567 13,286
Q3 Iris-pupil contrast 28.235 78.465 65.123
Q4 Pupil boundary circularity 88.788 100.734 98.664 Q5 Gray scale utilization 4,861 7.7824 7.100
Q6 Iris radius 77.993 124.988 104.129
Q7 Pupil dilation 22.220 61.428 39.077
Q8 Iris pupil concentricity 78.876 99.970 94.080
Braz. J. of Develop.,Curitiba, v. 6, n. 7, p. 50471-50491 jul. 2020. ISSN 2525-8761
Table 4 - Images number grouped by quality metrics above the reference value NUMBER OF METRICS ABOVE THE REFERENCE
VALUE. (TOTAL: 9 METRICS ANALYZED)
NUMBER OF IMAGES % IMAGES
9/9 384 14.55 8/9 1567 59.38 7/9 548 20.77 6/9 125 4.74 5/9 15 0.57 TOTAL 2639 100
Figure 15 - Overall assessment of the quality level of the analyzed images
Finally, Table 5 shows the comparison between images of authentic individuals (same individual). In this table, the Quantity of Metrics (QM) indicates that at least one of the compared images obtained QM above the reference value, among the nine metrics applied. Also, featured are statistical values related to Hamming Distance (HD) and the percentage for cases in which recognition was performed correctly: True Match - (TM) and the percentage of cases in which there were failures: False Non-Match (FNM).
The results presented in Table 5 proves that if the quality of images increases then the FNM rate is reduced; therefore, the overall iris biometric system performance improves. It is worth noting that in the case of QM = 9, only a few images are categorized as FNM. After a visual examination of these FNM cases, it was concluded that the images compared are different because one of them presents a rotation angle in relation to the other image. It
Braz. J. of Develop.,Curitiba, v. 6, n. 7, p. 50471-50491 jul. 2020. ISSN 2525-8761 is concluded that the current image quality set is not aware about this type of error in the acquisition image process.
Table 5 - Images number grouped by quality metrics above the reference value
QM AVERAGE MINIMUM MAXIMUM TM FNM
HD HD HD (%) (%) 9 0.2447 0.0984 0.4904 97.38% 2.62% 8 0.2429 0.0889 0.4904 96.52% 3.48% 7 0.2528 0.1024 0.4904 94.48% 5.52% 6 0.2678 0.0889 0.5085 89.61% 10.39% 5 0.2782 0.1434 0.4358 91.03% 8.97% 5 CONCLUSION
The use of iris images with a minimum quality level is of extreme importance for the performance of iris biometric recognition system. Experimental results demonstrated that the higher the quality between the images compared, the smaller the failures; therefore, the performance of the system improve. In turn, low-quality images such as occlusion, low lighting, segmentation faults and other problems undermine the results in the recognition, requiring the identification and exclusion of these images with low quality score.
It is worth noting that the experimental results show that the quality metric set of ISO/IEC 29794-6:2015 standard can be improved, for instances, including a new metric related to the iris rotation. Also, results demonstrated that the reference values of some metrics were reached by almost all the material test; then, the determination of the minimum required quality level values of each metric can be evaluated.
Braz. J. of Develop.,Curitiba, v. 6, n. 7, p. 50471-50491 jul. 2020. ISSN 2525-8761 REFERENCES
[1] C. P. Chang, J. C. Lee, Y. Su, P. S. Huang, T. M. Tu, “Using empirical mode decomposition for iris recognition,” Computer Standards Interfaces., vol. 31, no. 4, pp. 729–739, 2009.
[2] CASIA Iris-Interval Databases. Accessed: Aug. 2017. [Online]. Available: http://biometrics.idealtest.org
[3] ISO / IEC 29794-6: 2015, Information technology: Biometric sample quality - part 6: Iris image data. [Online]. Available: https://www.iso.org/standard/54066
[4] N. Othman, B. Bernadette, S. Garcia-Salicetti, “Osiris: An open source iris recognition software,” in: Pattern Recognition Letters., vol. 82, no. 1, pp. 124–131, 2015.
[5] C. J. Ponder, “A generic computer platform for efficient iris recognition,” Ph.D. thesis, University of Glasgow., 2015.
[6] S. B. B. Committee on Technology, in: National Science and Technology Council., USA, 2006.
[7] W. J. Herschel, in: The origin of finger-printing. H. Milford, Oxford University Press, London, UK, 1916.
[8] F. Galton, in: Finger prints. MacMillan and Company, London, UK, 1892.
[9] N. Marana, A. K. Jain, “Ridge-based fingerprint matching using hough transform,” in: Brazilian Symposium on Computer Graphics and Image Processing (SIBGRAPI). Natal, RN, Brazil, pp. 112–119, 2005.
[10] D. M. M. Costa, H. Passos, S. M. Peres, C. A. M. Lima, “A comparative study of feature level fusion strategies for multimodal biometric systems based on face and iris,” in: Proc. of the Conference on Brazilian Symposium on Information Systems. Brazilian Computer Society, Porto Alegre, Brazil, no. 30, pp. 219–226, 2015.
[11] L. Flom, A. Safir, “Iris recognition system,” Feb. 1987.
[12] J. G. Daugman, “High confidence visual recognition of persons by a test of statistical independence,” in: IEEE Trans. Pattern Anal. Mach. Intell., Washington, DC, USA, vol. 15, no. 11, pp. 1148–1161, 1993.
[13] G. Sutra, S. Garcia-Salicetti, B. Dorizzi, “The viterbi algorithm at different resolutions for enhanced iris segmentation,” in: IAPR International Conference on Biometrics (ICB)., New Delhi, India, pp. 310–316, 2012.
[14] G. Sutra, B. Dorizzi, “Iris osiris v4.1,” in telecom sud paris. 2012 [Online]. Available: http://svnext.it-sudparis.eu/svnview2-eph/ref_syst/Iris_ Osiris_v4.1
Braz. J. of Develop.,Curitiba, v. 6, n. 7, p. 50471-50491 jul. 2020. ISSN 2525-8761
[15] J. Daugman, “How iris recognition works,” in: IEEE Transactions on Circuits and Systems for Video Technology., vol. 14, no. 1, pp. 21–30, 2004.
[16] H. Hofbauer, C. Rathgeb, A. Uhl, P. Wild, “Iris Recognition in Image Domain: Quality-Metric Based Comparators,” Springer Berlin Heidelberg. Berlin, Heidelberg, pp. 1–10, 2012. [17] S. Makinana, T. Malumedzha, F. V. Nelwamondo, “Iris image quality assessment based on quality parameters,” in: Asian Conference on Intelligent Information and Database Systems. Springer-Verlag, New York, Bangkok, Thailand. vol. 8397, pp. 571–580, 2014.
[18] X. Li, Z. Sun, T. Tan, “Comprehensive assessment of iris image quality,” in: IEEE International Conference on Image Processing. Brussels, Belgium, pp. 3117–3120, 2011.
[19] N. D. Kalka, J. Zuo, N. A. Schmid, B. Cukic, “Image quality assessment for iris biometric,” in: Proc. Defense and Security Symposium. Orlando, FL, USA. vol. 6202, pp. 62020D-1–62020D– 11, 2006.
[20] R. S. Reillo, R. A. Moreno, B. F. Saavedra, Y. B. Kwon, “Standardized system for automatic remote evaluation of biometric algorithms,” Computer Standards Interfaces. vol. 34, no. 5, pp. 413 – 425, 2012.
[21] L. Masek, “Recognition of Human Iris Patterns for Biometric Identification,” Bachelor of Engineering, 2009. [Online]. Available: https://www.peterkovesi.com/studentprojects/libor
[22] Rodríguez, D. Z., Abrahão, J. A., Begazo, D. C., Rosa, R. L. and Bressan, G. (2012) “Quality metric to assess video streaming service over tcp considering temporal location of pauses,” IEEE Transactions on Consumer Electronics, 58(3), August 2012, pages 985–992.
[23] Rodríguez, D. Z., Rosa, R. L., Alfaia E., Abrahao and Bressan, G. (2016) “Video Quality Metric for Streaming Service Using DASH Standard,” In IEEE Transactions on Broadcasting, 62(3), September 2016, pages 628–639.
[24] Rodríguez, D. Z., Wang, Z., Rosa, R. L. and Bressan, G. (2014) “The impact of video-quality-level switching on user quality of experience in dynamic adaptive streaming over HTTP,” EURASIP Journal on Wireless Communications and Networking, 62(3), December 2014 216(2014), pages 2-15.
[25] Affonso, E. T., Nunes, R. D., Rosa R. L., Pivaro, G. F. and Rodriguez D. Z. (2018), “Speech quality assessment in wireless voip communication using deep belief network,” IEEE Access, 6(1), Oct. 2019, pages 77022-77032.
[26] Affonso, E. T., Rodriguez D. Z, Rosa R. L., Andrade, T., Bressan, G. (2016) “Voice quality assessment in mobile devices considering different fading models,” IEEE International Symposium on Consumer Electronics (ISCE), Set. 2016, pp. 21-22.
Braz. J. of Develop.,Curitiba, v. 6, n. 7, p. 50471-50491 jul. 2020. ISSN 2525-8761
[27] Da Silva, M. J., Melgarejo, D. C., Rosa R. L. and Rodriguez, D. Z. (2019),”Speech Quality Classifier Model based on DBN that Considers Atmospheric Phenomena,” Journal of Communications Software and Systems, 16(1), May, 2020, pages, 75-84.
[28] De Almeida, F., Rosa, L. R. and Rodríguez D. Z. (2018), “Voice quality assessment in communication services using deep learning,” In Proc. Int. Symposium on Wireless Communication Systems (ISWCS), Aug. 2018, pp. 1-6
[29] Militani, D., Vieira, S., Valadão, E., Neles, K., Rosa R. L. and Rodríguez D. Z., (2019) “A machine learning model to resource allocation service for access point on wireless network,” International Conference on Software, Telecommunications and Computer, Set. 2019, pp.1-6. [30] Nunes R. D., Rosa, L. R. and Rodríguez D. Z. (2020), “Performance improvement of a non-intrusive voice quality metric in lossy networks,” IET Communications, 13(20), August, 2020, pages 3401-3408
[31] Vieira S. T., Rosa, L. R. and Rodríguez D. Z. (2020), “A Speech Quality Classifier based on Tree-CNN Algorithm that Considers Network Degradations,” Journal of Communications Software and Systems,” 16 (2), Jun. 2020, pages 180-187.
[32] Rodríguez, D. Z., Rosa, R. L. Almeida F., Mittag. G., Moller, S., “Speech quality assessment in wireless communications with MIMO systems using a parametric model,” IEEE Access, 7(1), March 2019, pages 35719-35730
[33] Rosa, R. L., Schwartz G. M., Ruggiero, W. V. and Rodríguez, D. Z., (2018) “A knowledge-based recommendation system that includes sentiment analysis and deep learning,” IEEE Transactions on Industrial Informatics, 15(4), Aug. 2018, pg 2124-2135
[34] Lasmar, E. L., de Paula F., Rosa R. L., Abrahão J. I., Rodríguez D. Z. (2020), “Rsrs: Ridesharing recommendation system based on social networks to improve the user’s QoE,” IEEE Transactions on Intelligent Transportation Systems,” 12(20), October 2019, pages 4728-4740. [35] Freire. F. Silva, Carmona, J-V. C., Seixas, L. D. Valente, W. M., Kuribayashi, H. Caarvalho de Matos, E. M., (2020) “Performance Evaluation of 2K and 4K Video Transmissions over Wireless Networks in an Indoor Setting,” Brazilian Journal of Development, v. 6 n. 7, pp 42954-42968. [36] Gouveia, D. J. de S., da Silva M. J., Silva, D. H., Rosa, R. L. e Rodríguez D. Z., (2020) “Video quality metric implementation in mobile devices that considers impairments in the time and spatial domain” Brazilian Journal of Development, v. 6 n. 8, pp.