http://www.uem.br/acta ISSN printed: 1679-9275 ISSN on-line: 1807-8621
Doi: 10.4025/actasciagron.v35i3.16119
The use of multiple endmember spectral mixture analysis (MESMA)
for the mapping of soil attributes using Aster imagery
Aline Marques Genú1*, Dar Roberts2 and José Alexandre Melo Demattê3
1Departamento de Agronomia, Universidade Estadual do Centro-Oeste, Rua Simeão Camargo Varela de Sá, 3, 85040-080, Guarapuava, Paraná, Brazil.
2
Department of Geography, University of California, Santa Barbara, California, United State of America. 3
Departamento de Ciência do Solo, Escola Superior de Agricultura “Luiz de Queiroz”, Universidade de São Paulo, Piracicaba, São Paulo, Brazil. *Author for correspondence. E-mail: agenu@unicentro.br
ABSTRACT. Systematic, physically based acquisition of information regarding soils is required to meet increasing demand in agricultural and environmental systems. The objective of this work is to evaluate the use of multiple endmember spectral mixture analysis (MESMA) for mapping soil attributes within ASTER imagery. A total of 184 georeferenced soil samples were collected from Rafard, São Paulo State, Brazil. These points were overlain on the satellite image to collect spectral data. The laboratory and image information were then arranged and prepared by clustering samples into classes based on the following soil attributes: texture, organic matter, base saturation (V%), CEC and total iron. Following this classification, mean spectral curves were generated for each attribute class. Spectral curves were used as endmembers for the generation of maps using MESMA. Maps of the same attributes were also generated using geostatistical analyses. Based on the two generated maps, a cross-tabulation was used to evaluate the accuracy of MESMA for mapping soil attributes. Agreement was high for maps of the texture, organic matter, CEC and total iron. We conclude that the methodology used in this work was efficient for mapping soil attributes.
Keywords: remote sensing, spatial distribution, geostatistics.
Uso do modelo de análise de mistura espectral com múltiplos membros finais (MESMA) no
mapeamento de atributos do solo por imagem Aster
RESUMO. A obtenção de informações sobre solo de modo sistematizado é necessária com a crescente demanda no sistema agrícola e ambiental. Este trabalho objetiva testar a técnica do modelo de análise de mistura espectral com múltiplos membros finais (MESMA) para mapear atributos do solo com base em uma imagem ASTER. Para tanto, foram utilizadas 184 amostras georeferenciadas de solo da região de Rafard. Estes pontos foram sobrepostos a imagem de satélite para a coleta dos dados espectrais. Na sequência, as informações de laboratório e da imagem foram combinadas e procedeu-se o agrupamento das amostras em classes para os atributos textura, matéria orgânica, saturação por bases, CTC e ferro total. Após classificadas, geraram-se curvas médias para cada classe de atributo. As informações espectrais foram utilizadas como membros finais para a geração dos mapas através do MESMA. Mapas dos mesmos atributos também foram obtidos através de análise geoestatística. A partir dos dois mapas gerados, realizou-se uma análirealizou-se de tabulação cruzada para verificar a eficiência do MESMA no mapeamento de atributos do solo. Observou-se elevada similaridade entre os mapas de textura, matéria orgânica, CTC e ferro total. Conclui-se que a metodologia mostra-se eficiente no mapeamento dos atributos do solo estudados.
Palavras-chave: sensoriamento remoto, distribuição espacial, geoestatística.
Introduction
Mapping of the spatial distribution of soil properties is important for refining management practices and minimizing environmental problems. Knowledge of physical and chemical soil attributes is an important aspect of productivity analysis and the subsequent choice of management techniques for a given area (BASNYAT et al., 2004). In Brazil, for example, large agricultural areas occur on Oxisols, which are considered to be homogeneous from a pedological perspective but show differences in
the spatial distribution of soil attributes, which may affect the management of such areas.
Conventional and non-conventional statistical methods for soil attribute mapping require soil samples that are collected in the field and analyzed in the laboratory, which require time and financial resources.
i.e., the generation of information regarding the spectral behavior of soils, as well as the use of spectral mixture analysis (SMA) to isolate and discriminate soil properties and generate images of its components (HUETE, 2004).
To achieve such results, the technique of mixture analysis is based on the fact that each pixel of the image is a single measure of an area that comprises multiple components, and the spectrum of this mixture is a linear combination of the reflectance of these components or endmembers. The endmembers are those elements whose presence and abundance in the image are being modeled (DENNISON; ROBERTS, 2003).
However, this method considers all pixels as a mixture of a single initial set of endmembers. Thus, it is possible to have a pixel this is modeled by endmembers that are absent. For example, when considering a scene described by the endmembers vegetation, soil and shade, the calculation of the mixture will be performed based on these three elements, although none of these components may be present for the pixel (CARVALHO JUNIOR et al., 2003).
To circumvent this problem, a new approach called multiple endmember spectral mixture analysis (MESMA) has been developed that identifies the best mixing model for each pixel. This technique has been used for mapping vegetation (DENNISON; ROBERTS, 2003), mineral deposits (CARVALHO JUNIOR et al., 2003) and wildfire fuels (ROBERTS et al., 2003); however, little is known regarding how MESMA might perform for soils.
The spectral response of soil in satellite images is affected by the soil chemistry and physical attributes, thereby making it possible to identify and map these properties. Therefore, the objective of this present work is to determine the potential use of MESMA in the spatialization of soil attributes in a satellite image.
Material and methods
Study area
The study area, covering approximately 184 ha, is located near the margins of the Capivari river in the Rafard municipality in the southwest region of São Paulo State, Brazil. The study area is bounded by the geographical coordinates 23°0’31.37” - 22° 58’53.97” south latitude and 53°39’47.81” - 53°3’25.65” west longitude (Figure 1).
The geology of the region belongs to Itararé formation, Tubarão group, and it is composed of sandstones with a heterogeneous granulation, argillites and shale of various colors from light gray to dark gray. The area includes basalts from the Serra Geral formation, the São Bento group and rubble near the river.
Soil sampling and analysis
The area was demarcated and staked as a regular 100 x 100 m grid to produce 184 points within a total of 184 ha. Each stake was georeferenced using GPS coordinates, and samples were collected from a depth of 0 to 20 cm. Soil samples were sieved through a 2 mm mesh and oven dried at 50°C for 48 hours. The physical and chemical analyses were performed on the soil sample fraction smaller than 2 mm.
For the physical analysis, the sand, silt and clay contents were determined using the densimeter method (CAMARGO et al., 1986). Chemical analyses included the pH, which was determined in water and KCl. The elements K+, Ca2+, Mg2+ and
Al3+, H+ + Al3+ and organic matter (OM) were
determined according to Raij and Quaggio (1989). The cation exchange capacity (CEC) and base saturation (V%) were calculated using the soil analysis results. Total iron concentrations (Fe2O3)
were determined by sulfuric attack according to the methodology described by Camargo et al. (1986).
Subsequently samples were grouped according to a particular attribute. The evaluation of soil attributes using the spectral data was performed based on intervals for each attribute (GENÚ et al., 2011). The OM levels were designated as high (> 25 g dm-3), medium (15 - 25 g dm-3) or low (< 15 g
dm-3). Base saturation (V%) was classified as
dystrophic (<50%) or eutrophic (> 50%). Total iron (Fe2O3) levels were categorized as hypoferric
(< 80 g kg-1), mesoferric (80 - 180 g kg-1) or ferric
(> 180 g kg-1). The cation exchange capacity was
considered to be very low (< 30 mmolc dm-3), low
(30 - 60 mmolc dm-3), medium (60 - 100 mmolc dm-3),
high (100 - 150 mmolc dm-3) or very high
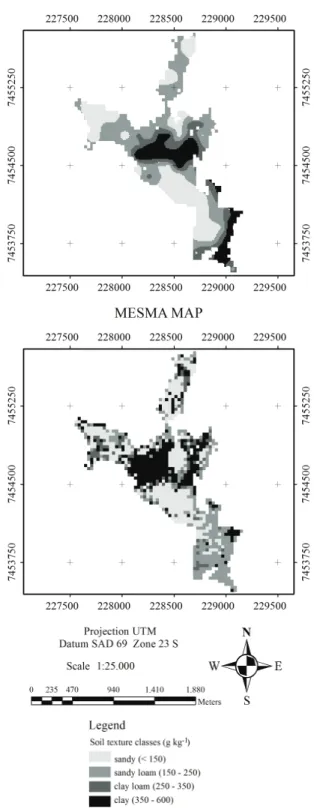
(> 150 mmolc dm-3). The following texture classes,
defined based on the clay contents were used: sand (< 150 g kg-1), sandy loam (150-250 g kg-1), clay
loam (250 - 350 g kg-1), clay (350 – 600 g kg-1) and
very clayey (> 600 g kg-1).
Spectral Information
The ASTER sensor of the TERRA satellite has 14 bands. Three of these bands are in the visible and near-infrared wavelengths, six are in the shortwave-infrared range and five are in the thermal shortwave-infrared range. In this work, the analysis was restricted to bands situated in the visible, near infrared and shortwave-infrared ranges, including the following: ASTER 1 (green, 520-600 nm), ASTER 2 (red, 630-690 nm), ASTER 3 (near infrared, 760-860 nm), ASTER 4 (infrared, 1600-1700 nm), ASTER 5 (infrared, 2145-2185 nm), ASTER 6 (infrared, 2185-2225 nm), ASTER 7 (infrared, 2235-2285 nm), and ASTER 8 (infrared, 2295-2365 nm). The image was acquired on August 6, 2004.
Because bands 1, 2 and 3 have a spectral resolution of 15 m, and the others have a resolution of 30 m, bands 1-3 were resampled at 30 m using the ENVI (Environment for Visualizing Images) program (ESRI, 2005).
To convert the gray levels of the image to reflectance values, and to reduce the atmospheric effect in the ASTER satellite image, the ACORN (Atmospheric Correction Now) program was used. An additional geometric correction of the image was necessary to integrate the image with a cartographic map. Thus, the control points of the study area were collected using a Trimble PRO-XRS GPS receiver with submetric precision and post-processing. This correction was performed using ENVI (ESRI, 2005). The UTM projection system and the South American 1969 Datum (SAD-1969) were used.
The position information of the 184 sampling points was overlain on colored composites of the images for the collection of the orbital spectral data. To ensure that the points were located over areas of exposed soil, a Normalized Difference Vegetation Index (NDVI) image was generated, and the soil line method was used to verify that the soil was bare (NANNI; DEMATTÊ, 2006).
A number of different vegetation indices have been developed to quantitatively and qualitatively assess vegetation cover based on spectral data (THENKABAIL et al., 2004). The successful use of vegetation indices is attributed to the strong spectral contrast between chlorophyll absorption in the visible wavelength (400-740 nm) and strong scattering in the near-infrared (740-1400 nm). The NDVI is defined as the ratio between the red and near-infrared bands (THENKABAIL et al., 2004). For the ASTER image, bands ASTER 2 (red) and ASTER 3 (near infrared) were used to obtain the NDVI.
The soil line used to verify areas of exposed soil is a graphical relationship between red and near-infrared bands. The bands used for this analysis were the same those used for the vegetation index, i.e., ASTER 2 and 3.
Image analysis using MESMA
The first step in the analysis was the generation of an NDVI image, which was used to differentiate the vegetated areas from those with exposed soil. Next, the NDVI image was used as a mask (threshold of 0.30) such that the vegetation would be set to zero, thereby generating a new image.
Subsequently, the vector file of the sampling points was overlaid on the new image using ENVI 4.1 (ESRI, 2005). The reflectance of the pixels related to the sampling points was then obtained.
data from the laboratory analysis such that each of the 184 points were related to a value of the clay content (texture), CEC, OM, V% and total iron. Subsequently, the samples were grouped according to the attribute classes mentioned above. After grouping, a mean reflectance value was generated for each ASTER band in the attribute classes; i.e., the mean spectral curves were obtained for the classes of soil attributes.
Mean spectral curves were included in the ENVI program as spectral libraries (SLs). Five spectral libraries were generated, one for each attribute, and each library was composed of the mean spectral curves for the corresponding class (Figure 2).
MESMA analysis was performed using the image obtained earlier (i.e., after applying the mask) using the five generated spectral libraries as endmembers. The analysis was performed for each specific library for each attribute. This analysis generated an image in which each pixel is classified as belonging to an attribute class. If the spectrum in the SL did not match the spectrum in the image (i.e., the mixing constraints for the attribute class and RMS error were not attained), the pixel remained unclassified. These classified images were exported to ArcGIS 9.0 (ESRI, 2005) and named as MESMA maps.
Collection of attribute maps using geostatistics
The soil characteristics data and the geographical coordinates of each point sampling were imported to Matlab 7.0 (MATHWORKS, 2005) for the geostatistical analysis. Initially, a semivariogram of the soil attributes was generated to check for the existence of spatial continuity. Subsequently, the statistical model was adjusted to fit the data; based on the type of the adjusted model, nugget effect, range and sill (Table 1), an interpolation of the sampling points was performed using kriging, and a new map for each attribute was generated.
Table 1. Semivariogram parameters for kriging interpolation.
Soil Attribute Model adjusted Sill Range
Organic Matter (OM) Gaussian 50 700
Texture Spherical 10000 700
Cation Exchange Capacity (CEC)
Exponential 2500 700
Base Saturation (V%) Spherical 200 700
Total iron (Fe2O3) Spherical 1000 700
Further maps were exported to ArcGIS 9.0, in which they were divided into the previously mentioned classes by assessing the layer properties and choosing the unique values category. For the purpose of discussion and to compare with the MESMA map, maps generated from the geostatistical analysis were named kriging interpolated maps.
Comparison of maps
The kriging-generated map included the entire study area (184 ha), whereas the MESMA map included only a part of the area (100 ha) due to the presence of vegetation. The geostatistical and MESMA maps were reconciled using the clip function available in the ArcToolbox of the ArcGIS software.
Both maps comprised the same area; therefore, the agreement between the maps was determined using ArcGIS 9.0 and the raster calculator function of the spatial
analyst module, to determine the percentage of
similarity between the two methods. This procedure was performed for each attribute to produce a confusion matrix.
Results and discussion
The generated texture maps (Figure 3) showed that the spatial distribution of the sand, sandy loam and clay classes is very similar.
The classes with the highest levels of accuracy were sand (56.5%) and clay (56.8%). Sandy loam was, in most cases, classified as sand (35.0%), and the values of clay loam, which did not show similarities between the maps, were confounded with the clay (42.7%) and sandy loam (31.7%) (Table 2).
Okin et al. (2001), working with AVIRIS images and the MESMA method, successfully discriminated between clay and sandy soils with approximately 90% accuracy. Similarly, Drake et al. (1999) successfully mapped the clay content of soils using Airborne Visible Infrared Imaging Spectrometer (AVIRIS) data.
Table 2. Percentage of similarity between the maps generated by MESMA and by kriging methods of the area for classes of soil attributes.
Attribute classes in the map generated by kriging Texture
Sand Sandy loam Clay loam Clay
Sand 56.5 35.0 14.5 4.7
Sandy loam 23.6 29.8 31.7 34.1
Clay loam 8.8 14.7 11.1 4.4
Clay 11.1 20.5 42.7 56.8
Total (%) 100.0 100.0 100.0 100.0
Organic Matter (OM)
Low Medium High
Low 58.7 32.2 4.7
Medium 20.5 64.3 95.3
High 20.8 3.5 0.0
Total (%) 100.0 100.0 100.0
Base Saturation (V%)
Distrophic Eutrophic
Distrophic 96.1 57.2
Eutrophic 3.9 42.8
Total (%) 100.0 100.0
Cation Exchange Capacity (CEC)
Very low Low Medium High Very high
Very low 35.1 15.1 9.0 12.8 0.0
Low 16.7 21.2 13.4 2.7 0.0
Medium 25.9 55.0 57.0 20.1 1.4
High 22.3 5.3 8.3 25.4 32.6
Very high 0.0 3.4 12.3 39.0 66.0
Total (%) 100.0 100.0 100.0 100.0 100.0
Total Iron (Fe2O3)
Hypoferric Mesoferric
Hypoferric 75.2 20.9
Mesoferric 24.8 79.1
Attri
b
u
te c
lasses
in
t
h
e MESMA
map
Total (%) 100.0 100.0
Texture is a factor that directly affects the soil spectral soil response. Higher soil clay content tends to exhibit lower soil reflectances (BEN-DOR et al., 2009). The spectral curve of the sandy soil showed a higher reflectance than the clay soil, which resulted in a high index of success for these two texture classes (Figure 2). However, for clay loam and sandy loam, the spectral curves used as endmembers (Figure 2) are very similar to those of clay and sandy soil, respectively, causing the highest levels of error (Table 2).
With respect to the OM, the maps show some similarity, especially for the medium and low classes. The majority of areas classified as belonging to the high organic matter class in the kriging map were confused with the medium organic matter class in the MESMA map (Figure 4). This result can be explained by the very similar spectral response of the high and medium OM classes (Figure 2).
This confusion of the OM classes is shown in Table 2, which indicates that 95.3% of the area with high OM in the kriging map belongs to the medium organic matter class in the MESMA map. The similarities between the maps for the high and medium classes were 58.7 and 64.3%, respectively.
Figure 4. Kriging interpolated map and MESMA map of organic matter of the area.
Palacios-Orueta et al. (1999), using a modified form of spectral mixture analysis applied to an AVIRIS image collected over two study areas located in California, was able to discriminate the OM contents of soils with a high degree of accuracy. According to these authors, despite the fact that the range in OM content was the same for both areas (0 to 6%), one of the study sites (La Jolla) had a higher number of pixels with values between 4 to 5%, whereas the other site (Serrano) had more pixels at the lower range between 2.5 to 3.5%.
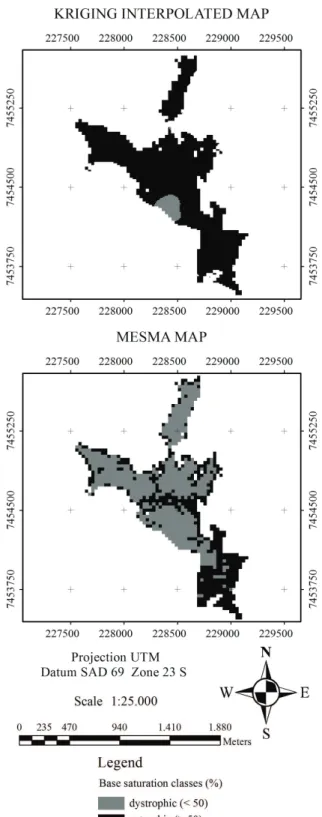
The generated base saturation (V%) maps proved to be very distinct (Figure 5). In the krigring map, almost the entire area is eutrophic due to chemical soil management performed locally. In contrast, almost the entire area in the MESMA map was classified as dystrophic.
Due to the differences between maps, the dystrophic class that represents only 4.1% of the area in the kriging map when overlapped with the MESMA map was almost entirely classified in the same class (distrophic), resulting in the similarity shown in Table 2. According to Ben-Dor et al. (2009), there are soil properties that do not generate an absorption feature in the spectral curve, such as the pH and electrical conductivity. Perhaps this is the case for the base saturation, and therefore, the resulting maps generated using MESMA were distinct from the krigring map. Demattê et al. (2003b) indicated that higher base concentration and base saturation is associated with higher reflectance. However such behavior was not observed by Sousa Junior et al. (2008) using an ASTER image.
In contrast, the CEC maps were similar, especially for the medium class, which represents the majority of the area (Figure 6).
The very low and very high classes represented a smaller area of 1.4% and 3.1%, respectively. Nevertheless, there was a high rate of success for these classes with 35.1 and 66.0% agreement between the maps (Table 2).
The similarity between the maps shows that the low class, representing 38.8% of the area, was confused with the medium class with an index of similarity of 55%. The medium and high classes had higher rates of success. For the medium class, which occupies 45.1% of the study area, the classification accuracy was 57.0%, whereas the high class, which occupies 11.8% of the area, had a classification accuracy of 25.4% (Table 2).
Figure 5. Kriging interpolated map and MESMA map of base saturation of the area.
Figure 6. Kriging interpolated map and MESMA map of CEC of the area.
As observed by Ben-Dor et al. (2009), soil properties without features can be quantified and mapped based on the spectral curves due to their strong correlation with other properties that have absorption bands, including certain types of minerals
and soil organic matter. This may explain the similarity between the CEC maps, as well as the dissimilarity between the V% maps.
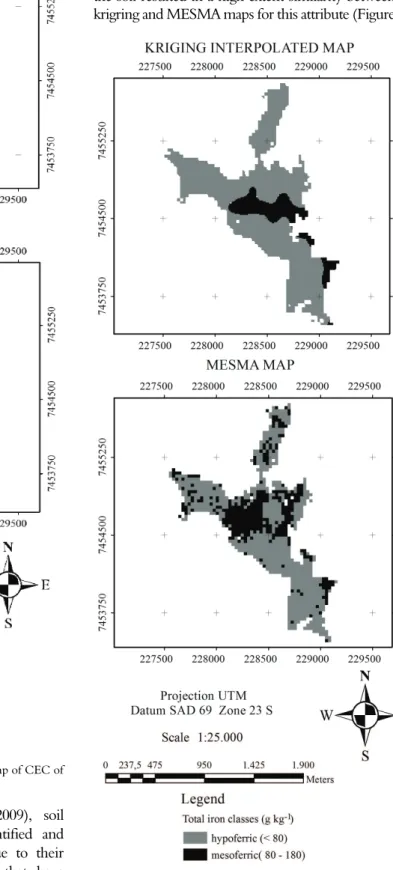
The strong effect of iron on the spectral response of the soil resulted in a high extent similarity between the krigring and MESMA maps for this attribute (Figure 7).
The total iron levels were divided into three classes, but only two of the classes were present in both of the maps because vegetation covered the areas with ferric samples.
The majority of the total area was classified as hypoferric (86.4%), and the index of similarity was 75.2%. For the mesoferric class, covering 13.67% of the area, the similarity index was 79.1% (Table 2).
It is interesting to note that the accuracy between the maps appeared to be higher when the number of classes is lower, as verified for the OM and total iron compared to the texture and CEC.
Total iron has a large effect on the spectral response of soils depending on its chemical form (DEMATTÊ et al., 2003a). Several features in the spectral curve can be attributed to the presence of iron because hematite and goethite show absorption bands at 530 nm and 480 nm, respectively. For the absorption band at 900 nm, the spectral curve becomes deeper as the iron content increases (DALMOLIN et al., 2005).
Palacios-Orueta et al. (1999) produced maps of iron levels that ranged from 2 to 6% in an AVIRIS image for two study areas in California using a modified spectral mixture analysis with accuracy determinations. It was also possible to assess the difference in the range of iron contents for the two areas of the Vale Serrano, which is mainly composed of basic igneous rocks. The higher iron contents ranged from 4 to 6%, whereas in the La Jolla Valley, which is composed of surficial sediments of sand and leaves, the iron contents were between 3 to 4%.
Conclusion
MESMA proved to be an efficient method for mapping texture, organic matter, total iron and CEC attributes and showed a high level of similarity when compared to the kriging method. However, these results are related to this specific area of study and must be tested in other areas with different soil types and attributes; this method can then be used as a tool in soil surveys and management practices.
References
BASNYAT, P.; McCONKEY, B.; MEINERT, B.; GATKZE, C.; NOBLE, G. Agriculture field characterization using aerial photograph and satellite imagery. IEEE Geoscience and Remote Sensing Letters, v. 1, n. 1, p. 7-10, 2004.
BEN-DOR, E.; CHABRILLAT, S.; DEMATTÊ, J. A. M.; TAYLOR, G. R.; HILL, J.; WHITING, M. L.; SOMMER, S. Using imaging spectroscopy to study soil properties. Remote Sensing of Environment, v. 113, n. 1, p. 38-55, 2009.
CAMARGO, A. O.; MONIZ, A. C.; JORGE, J. A.; VALADARES, J. M. Métodos de análise química, mineralógica e física de solos do IAC. Campinas: IAC, 1986. (Boletim Técnico, 106).
CARVALHO JUNIOR, O. A.; CARVALHO, A. P. F.; MENESES, P. R.; GUIMARÃES, R. F.; MARTINS, E. S. Análise de imagens hiperespectrais pelo método multiple endmember spectral mixture analysis (MESMA) em depósito supergênico de níquel. Revista Brasileira de Geociências, v. 33, n. 1, p. 63-74, 2003.
DALMOLIN, R. S. D.; GONÇALVES, C. N.; KLAMT, E.; DICK, D. P. Relação entre os constituintes do solo e seu comportamento espectral. Ciência Rural, v. 35, n. 2, p. 481-489, 2005.
DEMATTÊ, J. A. M.; EPIPHANIO, J. C. N.; FORMAGGIO, A. R. Influência da matéria orgânica e de formas de ferro na reflectância de solos tropicais.
Bragantia, v. 62, n. 3, p. 451-464, 2003a.
DEMATTÊ, J. A. M.; PEREIRA, H. S.; NANNI, M. R.; COOPER, M.; FIORIO, P. R. Soil chemical alterations promoted by fertilizer application assessed by spectral reflectance. Soil Science, v. 168, n. 10, p. 730-747, 2003b. DENNISON, P. E.; ROBERTS, D. A. Endmember selection for multiple endmember spectral mixture analysis using endmember average RMSE. Remote Sensing of Environment, v. 87, n. 1-2, p. 123-135, 2003. DRAKE, N. A.; MACKIN, S.; SETTLE, J. J. Mapping vegetation, soil, and geology in semiarid shrublands using spectral matching and mixture modeling of SWIR AVIRIS imagery. Remote Sensing of Environment, v. 68, n. 1, p. 12-25, 1999.
ESRI-Environmental Systems Research Institute. ArcGIS 9.0. Redlands: Esri, 2005. (3 CD-ROM).
GENÚ, A. M.; DEMATTÊ, J. A. M.; NANNI, M. R. Geoprocessamento na avaliação espacial de variáveis do solo da região de Rafard-SP. Revista Brasileira de Tecnologia Aplicada nas Ciências Agrárias, v. 4, n. 1, p. 07-29, 2011.
HUETE, A. R. Remote sensing of soils and soil processes. In: USTIN, S. (Ed.). Remote sensing for natural resources management and environmental monitoring: Manual of remote sensing. 3rd ed. Hoboken: John Wiley, 2004. p. 3-52.
MATWORKS, INC. Matlab 7.0. Gouda: Matworks, 2005. (1 CD-ROM).
NANNI, M. R.; DEMATTÊ, J. A. M. Comportamento da linha do solo obtida por espectrorradiometria laboratorial para diferentes classes de solo. Revista Brasileira de Ciência do Solo, v. 30, n. 6, p. 1031-1038, 2006.
OKIN, G. S.; ROBERTS, D. A.; MURRAY, B.; OKIN, W. J. Practical limits on hyperspectral vegetation discrimination in arid and semiarid environments. Remote Sensing of Environment, v. 77, n. 2, p. 212-225, 2001.
RAIJ, B. Van.; QUAGGIO, J. A. Métodos de análise de solo para fins de fertilidade. Campinas: IAC, 1989. (Boletim Técnico 8).
RSI-Research Systems Inc. ENVI 4.1.Boulder: RSI, 2005. (2 CD-ROM).
ROBERTS, D. A.; DENNISON, P. E.; GARDNER, M. E.; HETZEL, Y.; USTIN, S. L.; LEE, C. T. Evaluation of the potential of hyperion for fire danger assessment by comparison to the airborne visible/infrared imaging spectrometer. IEEE Transactions on Geoscience and Remote Sensing, v. 41, n. 6, p. 1297-1310, 2003. SOUSA JUNIOR, J. G.; DEMATTÊ, J. A. M.; GENÚ, A. M. Comportamento espectral dos solos na paisagem a partir de dados coletados por sensores terrestre e orbital.
Revista Brasileira de Ciência do Solo, v. 32, n. 2, p. 727-738, 2008.
THENKABAIL, P. S.; ENCLONA, E, A.; ASHTON, M. S.; VAN DER MEER, B. Accuracy assessments of hyperspectral waveband performance for vegetation analysis applications. Remote Sensing of Environment, v. 91, n. 3-4, p. 354-376, 2004.
Received on February 22, 2012. Accepted on May 25, 2012.