In situ
separation of soil types along transects employing Vis-NIR
sensors: a new view of soil evaluation
1Separação de classes de solos in-situ ao longo de transectos por sensores Vis-NIR:
uma nova visão na avaliação de solos
Peterson Ricardo Fiorio2*, José Alexandre Melo Demattê3, Marcos Rafael Nanni4, Aline Marques Genú5 e
Juliano Araujo Martins6
ABSTRACT - Soil components, such as organic matter, the levels and form of iron oxides, moisture and texture, influence the interaction of the soil with electromagnetic energy, so that knowledge of the energy reflected by different classes of soil is therefore of help in their discrimination. The aim of this study was to evaluate the possibility of differentiating classes of soils along two transects, by means of the field spectral behaviour of different classes, using both visual and multivariate statistical analysis. Equidistant points were marked along the transects, 100 m apart, where geo-referenced soil samples were collected from the surface layer at a depth of 0 to 0.20 m. In the area under study, ten classes of soil were described by means of laboratory analysis of surface samples and a morphological description of the profiles, with each soil being classified according to the Brazilian System of Soil Classification. For separating soil units and establishing their boundaries in the landscape three methods were used: a) traditional, evaluating the correlation between soil and landscape; b) qualitative assessment of the spectral curves; c) multivariate analysis for discrimination of the classes of soil. Comparison of these methods made possible the use of spectroradiometry in differentiating the classes of soil, with the statistical method separating a larger number of classes. It was possible to delimit the boundaries of the soil units in the area under study, as well as differences in texture, colour, total iron and organic matter between units, by varying the spectral responses of the soil samples being tested.
Key words: Remote sensing. Soil survey. Reflectance. Soil spectroradiometry.
RESUMO - Os componentes do solo como matéria orgânica, teor e forma dos óxidos de ferro, umidade e textura, influenciam na interação deste com a energia eletromagnética, sendo assim o conhecimento da energia refletida por diferentes classes de solos pode auxiliar em suas discriminações. O objetivo do presente trabalho foi avaliar a possibilidade de diferenciar classes de solos ao longo de dois transectos, por meio do comportamento espectral de campo de diferentes classes, utilizando para tanto a análise visual e estatística multivariada. Nos transectos foram demarcados pontos equidistantes em 100 m, de onde coletaram-se amostras de solo georreferenciadas da camada superficial, na profundidade de 0 a 0,20 m. Na área em estudo, foram descritas 10 classes de solos, por meio de análises de laboratório das amostras superficiais e descrição morfológica de perfis, sendo cada solo classificado de acordo com o Sistema Brasileiro de Classificação de Solos. Para separação das unidades de solos e estabelecimento de seus limites na paisagem utilizaram-se três métodos: a) tradicional, avaliando-utilizaram-se a correlação solo-paisagem; b) avaliação qualitativa das curvas espectrais e c) análiutilizaram-se multivariada para discriminação das classes de solos. A comparação entre os métodos possibilitou avaliar o uso da espectrorradiometria na diferenciação de classes de solos, sendo que o método estatístico separou maior número de classes. Foi possível delimitar os limites das unidades de solos da área de estudo bem como as diferenças de textura, cor, ferro total e matéria orgânica entre as unidades, por meio da variação nas respostas espectrais das amostras de solos avaliadas.
Palavras-chave: Levantamentos do solos. Sensoriamento remoto. Reflectância. Espectrorradiometria de solos.
*Autor para correspondência
1Recebido para publicação em 25/10/2012; aprovado em 21/03/2014
Parte da Tese de Doutorado do primeiro autor apresentada ao Curso de Pós-Graduação em Agronomia, Solos e Nutrição de Plantas, Universidade de São Paulo
2Departamento de Engenharia de Biossistemas, Escola Superior de Agricultura Luiz de Queiroz, Universidade de São Paulo, Piracicaba-SP,
Brasil, [email protected]
3Departamento de Ciência do Solo, Escola Superior de Agricultura Luiz de Queiroz, Universidade de São Paulo, Piracicaba-SP, Brasil, [email protected] 4Departamento de Agronomia, Universidade Estadual de Maringá, Maringá-PR, Brasil, [email protected]
5Departamento de Agronomia, Universidade Estadual do Centro-Oeste, Guarapuava-PR, Brasil, [email protected]
INTRODUCTION
In the last three decades variability in the spectral behaviour of soils has contributed to their differentiation and preliminary mapping. Soil properties, such as organic matter, the presence of iron minerals and clay content, among others, have been determined and even quantified using differences in spectral response (NANNI; DEMATÊ; FIORIO, 2004). With the development of new sensors, the use and application of remote sensing in the study of soils has been improving, aiding technicians and researchers in their recognition (FORMAGGIOet al., 1996).
There are several stages in the process of surveying soil, which range from marking observation points to the delineation of mapping units. Even in conventional surveys where satellite images are used, such features as texture, colour and current use, and aspects relating to relief such as shadow, are commonly evaluated so as to separate landscape units that are subsequently checked in the field (SOUSA JÚNIOR; DEMATTÊ; GENU, 2008).
Most studies in soil science involving remote sensing, have to do with the spectral characterisation of soils and the relationship with its components (BROWN
et al., 2006; COHEN et al., 2007; COZZOLINO;
MORON, 2003; FIORIO; DEMATTÊ, 2009; NANNI; DEMATTÊ, 2006; VISCARRA ROSSELet al., 2009),
which has been helping in soil discrimination. In the same way, conventional surveys use information about soil components obtained from chemical and physical analyses and from morphological evaluations as a means of establishing the classes which are present, and their distribution in the landscape.
Use of the spectral characterisation of soils and correlation with its components can therefore assist the process of obtaining pedological data in soil surveys (DEMATTÊet al., 2004). However, few studies have
been carried out to establish relationships between the spectral response and variations of the soil along the terrain. The spectral response of the soil can help in separating the limits of taxonomically distinct classes due to the interaction between electromagnetic radiation and the various constituents of the soils. In terms of remote sensing at the field level, few studies have been carried out in tropical soils, it being difficult to measure the effect of soil constituents on the spectral data at this level of evaluation.
The objective of the present work was to evaluate the discrimination of soil types along two transects, by means of spectral signatures obtained with in-situ land spectroradiometry.
MATERIAL AND METHODS
Characterisation of the study areaThe area is located in the southwestern part of the state of São Paulo, Brazil, in the town of Barra Bonita, being bounded by the coordinates 22º26’02.37’’ S to 22°23’16.53’’ S and 48º31’24, 22’’ 48°27’51,77 ‘’ W, with an altitude ranging from 520 to710 m above sea level, having a total area of 473 ha. The climate of the region, based on the Köppen classification, is of type Cwa. The lithology is mainly represented by basalts of the Serra Geral Formation, comprising a set of effusions among which are interspersed sandstones of the Botucatu Formation. Also found is the Itaqueri Formation, from the Bauru Group, characterised by sandstones with clayey cement, shales and conglomerates (INSTITUTO DE PESQUISAS TECNOLÓGICAS DO ESTADO DE SÃO PAULO, 1981).
Pedological survey: validation
In order to obtain knowledge of the actual classes of soil and their subdivisions, a pedological survey was conducted using the traditional method. Two transects were established in the study area (of 1,200 m for transect 1 and 1,900 m for transect 2), and equidistant points marked every 100 m (WOLKOWSKI; WOLLENHAUPT, 1994). Soil samples were collected with a Dutch auger from the surface (0 to 0.20 m) and subsurface (0.80 to 1.00 m) horizons. From the physical and chemical data of the soil samples obtained with the auger, it was possible to determine the mapping units along the two transects, followed by the trenches for a morphological description. For the morphological description of the soils, ten trenches were used. The trenches, when opened in deep soil, were 1.5 m long by 1.2 m wide and 2.0 m deep, and in an east west direction to ensure that the described face was illuminated during the morning; this evaluation being made according to criteria established by Santos et al.
(2005). Using the Brazilian system of soil classification, the following classes of soils were identified along the two transects: Eutrophic Tb Haplic Cambisol, clayey texture (CXbe-3); dystrophic Red-Yellow Latosol, medium texture (LVAd-1); dystrophic Red Latosol, medium texture (LVd-1); dystrophic Red Latosol, medium texture (LVd-2); dystrophic Red Latosol, clayey texture (LVd-3); dystrophic Red-Yellow Argisol, medium-sandy texture (PVAd-2); dystrophic Red Argisol, medium-sandy texture (PVd-2); eutrophic Red Argisol, medium-sandy texture (PVe-2); eutrophic Red Argisol, medium-sandy texture (PVe-3); orthic quartzarenite Neosol (RQo). The numbers after the symbol for soil class correspond to the texture groupings suggested for this work.
and total iron content were determined according to Empresa Brasileira de Pesquisa Agropecuária (1997). The soil colour was determined from wet samples as recommended by Santos et al. (2005), by means of a
Minolta CR350 colorimeter, using the Munsell notation (CAMPOS; DEMATTÊ; QUARTAROLI, 2003). Total sand content was obtained by wet sieving, the densimeter method was used for the clay, and the silt content was obtained with the expression: % silt = 100% - (% clay + sand %) (CAMARGO et al., 1986). The soils were
discriminated by texture groupings established in the diagnostic surface horizon: Sandy (<150 g clay kg-1),
Medium 1 (1) (>150 and <250 g clay kg-1), Medium 2 (2)
(>250 and <350 g clay kg-1) and Clayey (3) (>350 and
<600 g clay kg-1).
Obtaining spectral data in the Field
In order to discriminate classes of soil along the transects, spectral analyses were performed in-situ. For this, a FieldSpec Spectroradiometer covering the spectral range from 450 to 2500 nm was used. The area under study had no plant cover at the time of the spectral reading, and the surface was rectified with the use of a levelling harrow. For data calibration, a standard plate with 100 % reflectance was used as reference. The geometry defined for the present study was a 1 m distance between the target and the sensor, with the sun as light source. The spectral field readings were taken in the soil surface horizon between the hours of 10:00 am and 2:00 pm. Spectral readings were carried out along the transects, and then evaluated for pedological separability.
Statistical analysis of the spectral data
Initially the main wavelength bands of importance in soil separation were defined. To do this the methodology of Nanni and Demattê (2006) was followed, adapted for use in the field. The following ranges were taken from the spectral curves: 1350-1450 nm (B8: 1350-1417, B9: 1417, B10: 1417-1449); 1790-2000 nm (B12: 1793-1831, B13: 1865-1927, B14: 1927, B15: 1927-2102) e 2250-2500 nm (B20: 2258, B21: 2258-2389, B22: 2389-2498 and the heights: H11; 2206-2258, H12; 2258-2389, H13; 2389-2498). This was necessary due to the interference of moisture in the atmosphere which generates a high degree of random noise, making the use of this data impossible. For this study therefore, 12 spectral bands (B) in nanometres (nm) were used: B1: 450-481, B2: 481, B3: 481-596, B4: 596-710, B5: 710-814, B6: 814-975, B7: 975-1350, B11: 1449-1793, B16: 2101-2139, B17: 2139-2206, B18: 2206, B19: 2206-2258 and 13 differences in reflectance intensity between the maximum and minimum points of a given absorption (H) band in nanometres: H1: 469-532, H2: 532-768, H3: 768-876, H4: 876-1353, H5: 1353-1411, H6: 1411-1439, H7: 1439-1783, H8: 1860-1923, H9: 1923-2120, H10: 2120-2206.
Subsequently, and in order to define homogeneous groups by means of grouping those individuals evaluated as a function of their quantitative spectral values, cluster analysis was used employing the SAS software (SAS INSTITUTE, 1999).
RESULTS AND DISCUSSION
Qualitative characterisation of spectral curves on the transects
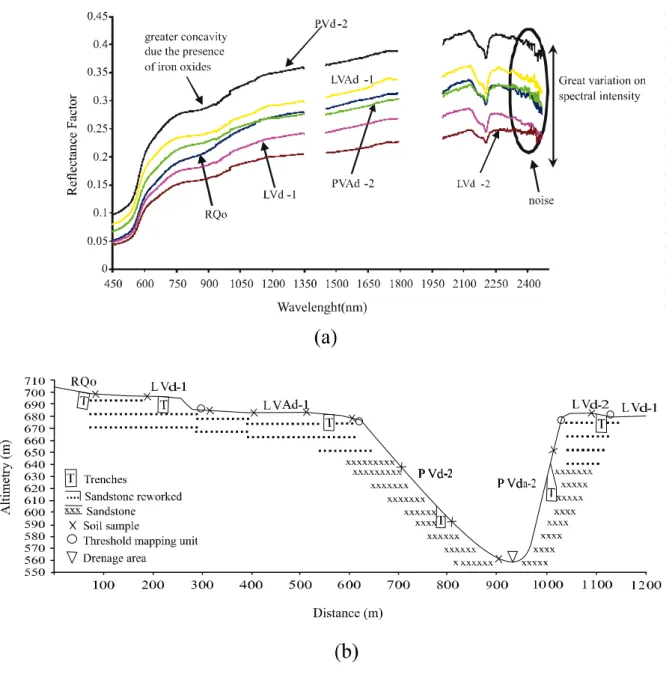
With the curves obtained for transect 1 there is no great descriptive differentiation of groups by spectral curve, with the difference being in principle, more related to the reflectance intensity than to large changes in the shape of the curve and absorption features (Figure 1). Demattê (2002) points out the need to observe three key features in the descriptive discrimination of spectral curves: reflectance intensity, absorption features and shape of the curve.
The lowest reflectance intensity was determined for class LVd-2 with a clay content of 180 g kg-1, and
the largest for class PVd-2 with 111 g clay kg-1 (Table 1).
This fact is explained by the textural and mineralogical variations. In this respect, it was seen that LVd-1 with 152 g clay kg-1 displays an intensity superior to that of LVd-2.
The feature for kaolinite at 2200 nm is more pronounced in LVd-1 and less in LVd-2. These characteristics are due to the higher amount of quartz in LVd-1 and opaque minerals in LVd-2, and agree with Demattêet al. (2004). That is,
soils with a more sandy texture like PVd-2 have a higher intensity than LVd-2 with its medium texture (Table 1).
Shape, as shown by Formaggio et al. (1996) is
important as it indicates variations in soil composition. Little can be observed with regard to the wide variation in shape of the spectral curves; all show an ascending aspect of the spectral response from the visible to the infrared.
In addition to the various factors which interfere in the spectral curve, such as clay, organic matter and iron, the position of the classes of soil in the terrain and the incidence of solar radiation can affect the amount of water in the surface soil, causing variations in reflectance intensity. Without control of the medium, the interpretation of the data is made difficult because the electromagnetic energy interacts with the atmosphere resulting in incorrect interpretations even when the necessary corrections are made (BEN-DOR; HELLER; CHUDNOVSKY, 2008).
Figure 1 - Spectral curves of soil classes obtained in the field (a) and their position along transect 1 of the area under study (b)
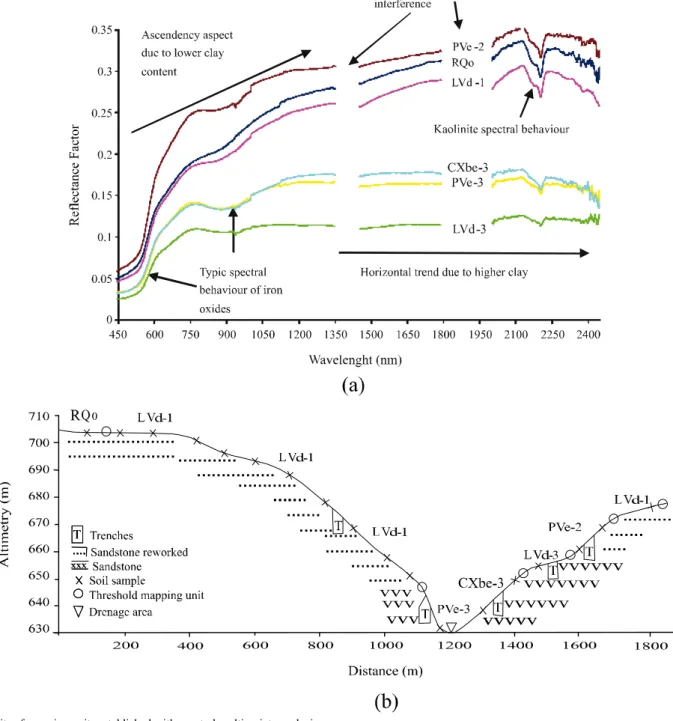
On transect 2 the spectral curves were separated into two distinct groups according to reflectance intensity (Figure 2). The first group with more clayey soils and higher levels of total iron and organic matter (PVe-3, CXbe-3 and LVd-3) (Table 1), having a low reflectance intensity across the spectrum (0.10 to 0.20) and the greatest concavity centred on 850 nm (DEMATTÊ; GARCIA, 1999).
For the second group, composed of more sandy soils with low levels of total iron (RQo, LVd-1, PVe-2) (Table 1), the reflectance intensity is higher (between 0.20 and 0.35 throughout the tested region of the spectrum), with lower absorption at 850 nm.
The levels of organic matter on the first transect are low and similar, producing no significant interference to the spectrum (Table 1).
Table 1 - Average values of the chemical and granulometric surface attributes (0 to 0.20 m) of mapping units in the study area
Soil1Symbol OM2 g/kg Sand Silt Clay Colour when wet Fe
2O3g/kg Ki3 Texture Ratio
---g/kg--- Hue Value Chroma
CXbe-3 18.7 287 200 513 4.2YR 3.6 1.7 144 1.75 0.89 LVAd-1 12.1 778 50 173 3.1YR 3.7 2.1 24 1.93 1.19 LVd-1 12.2 812 36 152 2.7YR 3.5 1.9 21 2.06 1.23 LVd-2 13.3 775 45 180 2.0YR 3.4 1.8 30 2.12 1.49 LVd-3 19.0 537 90 373 2.9YR 3.5 2.0 122 1.56 1.26 PVAd-2 10.5 850 30 120 2.2YR 3.4 1.6 25 2.41 2.37 PVd-2 12.8 843 46 111 2.7YR 3.6 2.0 25 2.05 2.53 PVe-2 14.8 839 40 121 2.8YR 3.5 2.0 32 2.27 2.31 PVe-3 18.6 711 79 210 3.3YR 3.5 2.0 83 1.77 2.10
RQo 11.0 840 34 126 3.1YR 3.6 2.0 17 2.22 0.97
1 Eutrophic Tb Haplic Cambisols, clayey texture (CXbe-3); dystrophic Red-Yellow Latosols, medium texture (LVAd-1); dystrophic Red Latosols, medium texture 1 (LVd-1); dystrophic Red Latosols, medium texture 2 (LVd-2); dystrophic Red Latosols, clayey texture (LVd-3); dystrophic Red-Yellow Argisols, medium texture 2 (PVAd-2); dystrophic Red Argisols, medium texture 2 (PVd-2); eutrophic Red Argisols, medium texture 2 (PVe-2); eutrophic Red Argisols, clayey texture (PVe-3); orthic quartzarenite Neosols (RQo);2 Organic Matter;3 Degree of weathering of the soil
from visual differentiation of the spectral curves (qualitative method). Such behaviour can be explained by a reduction in the subjectivity of the specialist when separating the curves in order to fit them into a given set. In the qualitative method, the curves obtained in the field were all grouped into a single set for transect 1 and into two sets for transect 2 (Figures 1 and 2).
Analysis of the spectral curves also grouped together all the classes on transect 1, their separation being due only to differences in intensity (Fig. 1). However, it is possible to determine that class Pvd-2 (Figure 1) could separate into a second group. For transect 2, there was separation of the two groups (Figure 2). But as in the previous case, it would be possible to separate class LVd-3 into a third group (Figure 2). This shows that without statistical evaluation, separating the groups is open to the subjectivity of the technician evaluating the spectral signatures. The use of a statistical method can guide the clustering of similar individuals in such a way as to partially eliminate subjectivity, agreeing with the reports of Nanni and Rocha (1997).
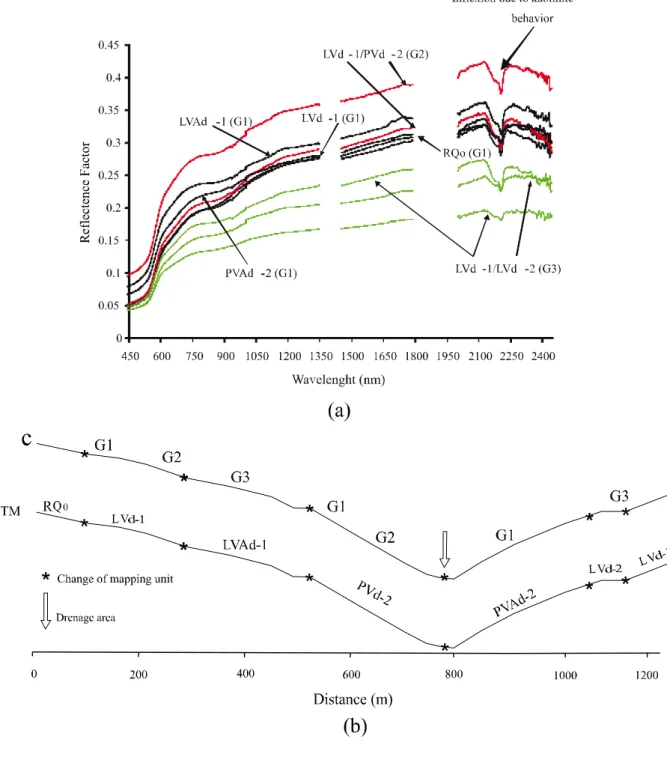
It can be seen that G1 is represented by RQo, LVd-1, LVAd-1; G2 by LVd-1and PVd-2; and G3 by LVd-1 and LVd-2 (Figure 3). For G2, despite the different intensities in the curves of PVd-2 and LVd-1, their format is very similar; for example it is possible to see at 2200 nm greater absorption by the 1:1 minerals (BEN-DOR; HELLER; CHUDNOVSKY, 2008).
For G2, class LVd-1 displayed different behaviour (Figure 3). Of the four points analysed on transect 1, one
showed similar behaviour to PVd-2, even with different reflectance intensities and a clay content of 152 g kg-1 for
LVd-1 and 111g kg-1 for PVd-2, which would place
them closer to RQo (126 g kg-1) with regard to the
surface layer (Table 1).
However, the cluster analysis worked with spectral bands and heights, using this method to group together the soils which were nearest in relation to their absorption features. Bands 17, 18 and 19, among those tested, had more weight in the analysis of wavelength interval than the absorption feature at 2200 nm, characterised by a double step indicating the presence of 1:1 minerals (BEN-DOR; HELLER; CHUDNOVSKY, 2008). This fact may have contributed to the grouping of these two classes of soil according to the greater or lesser presence of this mineral. Group G3 on the other hand, differed from the rest both statistically and visually, presenting lesser reflectance than the other classes of soil of rectilinear tendency, confirming the data obtained by Nanni, Demattê and Fiorio (2004).
With regards to the spatial distribution of the groups on the transects, their position was partial when comparing spectral data to the reference data obtained with the traditional method. However, when comparing groups formed from the radiometric data to those from the traditional soil survey, certain inconsistencies generated by the statistical method are seen (Figure 3), especially between groups 1 and 2.
Figure 2 - Spectral curves of different soil classes obtained in the field (a) and their position along transect 2 of the area under study (b)
Limits of mapping units established with spectral multivariate analysis
similar. Therefore, the statistical method resulted in the separation of spectral information, making orientation possible when outlining the boundaries of the mapping units in the area being studied and aiding in pedological surveys, as also highlighted by Nanni and Rocha (1997).
On transect 2 (Figure 4), five groups were seen, with soils of a medium to sandy texture predominating in G1 (LVd-1 and RQo), G4 (PVe-2 and LVd-1) and G5 (LV-1), however with spectral curves of varying intensities, G5
having the highest intensity (0.35 to 0.45) and G4 with similar intensities to G1 (0.25 to 0.30).
Figure 3 - Spectral curves of the surface horizon of soil classes at each collection point on transect 1 and discrimination of the groups generated by cluster analysis at field level (a) and position of the groups on the transect (b), where: C = Field spectroradiometry and TM = traditional method
horizontal, while for G1 there is an upward trend in the same range, also observed by Nanni, Demattê and Fiorio (2004). However, a significant difference can be seen between G4 and G1 in the 800 nm region, with a greater concavity centred on this wavelength for group
G4. This concavity was probably responsible for the grouping between the LVd-1 and PVe-2 soils, since for these classes the organic matter content was 23 and 26 g kg-1 respectively, being greater than the highest value
Figure 4 - Spectral curves of the surface horizon of soil classes at each collection point on transect 2 and discrimination of the groups generated by cluster analysis at field level (a) and position of the groups on the transect (b), where: C = Field spectroradiometry and TM = traditional method
LVd-1, found in of all the samples and appearing in G5, showed a greater reflectance intensity. This is mainly due to the total sand content (860 g kg-1),
exceeded only by PVe-2 (880 g total sand kg-1) (Table 1).
However, the organic content of LVd-1 in G5 was 11 g kg-1
against 26 g kg-1 for PVe-2, as previously reported.
than 2.1YR, which in this case may be reducing the intensity of the curves in G2. It is clear however, that in some cases, even with the presence of one or another class of soil in different groups, cluster analysis was suitable for the proposed objectives, i.e. discrimination of soil classes along two transects by means of spectral signatures obtained by terrestrial spectroradiometry (field) using multivariate analysis.
Thus, a greater reflectance intensity (0.25 to 0.35) and well-evident absorption features for the curves at 850 nm (iron oxides) and at 2200 nm for kaolinite (FORMAGGIO
et al,. 1996) were seen even with low levels of some of these
components, as is the case with the iron oxides in class RQo (Table 1). G2 is composed of soils of a more clayey texture (PVe-3 CXbe-3 and LVd- 3), having a lower reflectance intensity (0.10 to 0.15) with the absorption features found and described for the earlier group being thus less evident, with flattening of the curves, as reported by Nanni, Demattê and Fiorio (2004). The low reflectivity in the spectral range under evaluation characterises the integration of such soil components as organic matter content (DEMATTÊ; EPIPHANIO; FORMAGGIO, 2003) and iron oxides (MADEIRA NETTO, 1993), as well as the higher clay content present in the soils making up this group (NANNI; DEMATTÊ; FIORIO, 2004). It can be seen however, that the values for hue in these soils are closer to yellow than to the classes that make up G3. Even so, the reflectance factor was lower, with the two groups being separated by cluster analysis. This situation may be determined by the levels of organic matter and principally by the levels of clay present in the soils that make up G2.
CONCLUSIONS
1. It was possible to discriminate between most classes of soil in the two transects being evaluated, by means of the spectral responses obtained in the surface horizons; 2. The spectral curves changed their intensity, shape and
absorption features due to such soil components as total iron, granulometry and colour;
3. Multivariate cluster analysis, together with descriptive analysis, was shown to be appropriate for the discrimination of soil types along the transects, using spectral signatures obtained by direct spectroradiometry in the field.
ACKNOWLEDGEMENT
The authors wish to thank FAPESP for the doctoral scholarship awarded to the first author (process 99/04325-2) and to CNPq for the scholarship awarded to the second author (process 300371/96-9).
REFERENCES
BEN-DOR, E.; HELLER, D.; CHUDNOVSKY, A. A novel method of classifying soil profiles in the field using optical means.Soil Science Society of American Journal, v. 72, n. 4, p. 1113-1123, 2008.
BROWN, D. J.et al. Global soil characterization with VNIR diffuse reflectance spectroscopy.Geoderma, v. 132, n. 3/4, p. 273-290, 2006.
CAMARGO, O. A. et al. Métodos de análise química, mineralógica e física de solos do IAC. Campinas: IAC, 1986. 94 p. (Boletim técnico 106).
CAMPOS, R. C.; DEMATTÊ, J. A. M.; QUARTAROLI, C. F. Determinação indireta do teor de hematita no solo a partir de dados de colorimetria e radiometria. Pesquisa Agropecuária Brasileira,v. 38, n. 4, p. 521-528, 2003.
COHEN, M. et al. Reflectance Spectroscopy for routine
agronomic soil analyses.Soil Science of America Journal, v. 172, n. 6, p. 469-485, 2007.
COZZOLINO, D.; MORON, A. The potential of near-infrared reflectance spectroscopy to analyze soil chemical and physical characteristics. Journal of Agricultural Sciences, v. 140, p. 65-71, 2003.
DEMATTÊ, J. A. M.; GARCIA, G. J. Alteration of soil properties through a weathering sequence as evaluated by spectral reflectance. Soil Science Society of America Journal, v. 63, n. 2, p. 327-342, 1999.
DEMATTÊ, J. A. M. Characterization and discrimination of soils by their reflected electromagnetic energy. Pesquisa Agropecuária Brasileira, v. 37, n .10, p. 1445-1458, 2002. DEMATTÊ, J. A. M.; EPIPHANIO, J. C. N.; FORMAGGIO, A. R. Influência da matéria orgânica e de formas de ferro na reflectância de solos tropicais.Bragantia, v. 62, n. 3, p. 451-464, 2003.
DEMATTÊ, J. A. M.et al. Visible-NIR reflectance: a new approach
on soil evaluation.Geoderma, v. 121, n. 1/2, p. 95-112, 2004. DEMATTÊ, J. A. M.; NANNI, M. R. Comportamento da linha do solo obtida por espectrorradiometria laboratorial para diferentes classes de solos. Revista Brasileira de Ciência do Solo, v. 30, n. 6, p. 1031-1038, 2006.
EMPRESA BRASILEIRA DE PESQUISA AGROPECUÁRIA. Centro Nacional de Pesquisa dos Solos.Manual de métodos de análise de solo. Rio de Janeiro, 1997. 212 p.
FIORIO, P. R.; DEMATTÊ, J. A. M. Orbital and laboratory Spectral data to optimize soil analysis.Scientia Agricola, v. 66, n. 2, p. 250-257, 2009.
FORMAGGIO, A. R. et al. Comportamento espectral
(450-2.450 nm) de solos tropicais de São Paulo.Revista Brasileira de Ciência do Solo, v. 20, p. 467-474, 1996.
MADEIRA NETTO, J. S.Étude quantitative des relations constituants minéralogiques - réflectance diffuse des latosols brésiliens. Applications à l’utilization pédologique des donées satellitaires TM (région de Brasilia). Paris: Éditions de l’ORSTOM, 1993. 236 p.
NANNI, M. R.; ROCHA, H. O. Integration of GIS technology, remote sensing and multivariate analysis in the delimitation of physiographic units for pedological mapping. Boletim IG-USP - Série Científica, v. 28, p. 129-143, 1997. NANNI, M. R.; DEMATTE, J. A. M.; FIORIO, P. R. Análise discriminante dos solos por meio da resposta espectral no nível terrestre.Pesquisa Agropecuária Brasileira, v. 39, n. 10, p. 995-1006, 2004.
NANNI, M. R.; DEMATTÊ, J. A. M. Spectral reflectance methodology in comparison to traditional soil analysis.Soil Science Society of America Journal, v. 70, n. 2, p. 393-407, 2006.
SANTOS, R. D.et al.Manual de descrição e coleta de solo no campo. 5. ed. Viçosa: SBCS, 2005. 92 p.
SAS INSTITUTE.Software: user’s guide, version 8.2. Cary: Statistical Analysis System Institute, 1999. 291 p.
SOUSA JÚNIOR, J. G. A.; DEMATTE, J. A. M.; GENU, A. M. Comportamento espectral dos solos na paisagem a partir de dados coletados por sensores terrestre e orbital. Revista Brasileira Ciência do Solo, v. 32, n. 2, p. 727-738, 2008. VISCARRA ROSSEL, R. A.et al. In situ measurements of