ISSN: 1809-4430 (on-line)
_________________________
1 Engº Agrônomo, Prof. Doutor, Colegiado de Engenharia Agronômica, Univ. Federal do Vale do São Francisco
(Univasf)/Petrolina – PE, Fone: (87) 2101-4833, [email protected]
2 Engº Agrônomo, Prof. Adjunto, Departamento de Solos, UNESP - Campus de Jaboticabal, SP, [email protected]
MANAGEMENT ZONES USING FUZZY CLUSTERING BASED ON SPATIAL-TEMPORAL VARIABILITY OF SOIL AND CORN YIELD
Doi:http://dx.doi.org/10.1590/1809-4430-Eng.Agric.v35n3p 470-483/2015
MARCOS S. RODRIGUES1, JOSÉ E. CORÁ2
ABSTRACT: Clustering soil and crop data can be used as a basis for the definition of management zones because the data are grouped into clusters based on the similar interaction of these variables. Therefore, the objective of this study was to identify management zones using fuzzy c-means clustering analysis based on the spatial and temporal variability of soil attributes and corn yield. The study site (18 by 250-m in size) was located in Jaboticabal, São Paulo/Brazil. Corn yield was measured in one hundred 4.5 by 10-m cells along four parallel transects (25 observations per transect) over five growing seasons between 2001 and 2010. Soil chemical and physical attributes were measured. SAS procedure MIXED was used to identify which variable(s) most influenced the spatial variability of corn yield over the five study years. Basis saturation (BS) was the variable that better related to corn yield, thus, semivariograms models were fitted for BS and corn yield and then, data values were krigged. Management Zone Analyst software was used to carry out the fuzzy c-means clustering algorithm. The optimum number of management zones can change over time, as well as the degree of agreement between the BS and corn yield management zone maps. Thus, it is very important take into account the temporal variability of crop yield and soil attributes to delineate management zones accurately.
KEYWORDS: management zone analyst, precision agriculture, soil pH, tropical soils, Zeamays L.
ALGORITMO DE AGRUPAMENTO 'FUZZY' PARA DEFINIÇÃO DE ZONAS DE MANEJO COM BASE NA VARIABILIDADE ESPAÇO-TEMPORAL DOS ATRIBUTOS
DO SOLO E DA PRODUTIVIDADE DE MILHO
RESUMO: O agrupamento de dados de solo e de plantas pode ser utilizado para definir zonas de manejo. O objetivo do estudo foi identificar zonas de manejo usando o algoritmo de grupamento fuzzy c-means com base na variabilidade espacial e temporal dos atributos do solo e da
produtividade de milho (PM). A área de estudo (18 por 250 m) está localizada em Jaboticabal-SP.
A produtividade de milho foi medida em 100 células amostrais de 4,5 x 10 m, dispostas em quatro transectos (25 pontos por transecto), em cinco anos agrícolas, no período de 2001 a 2010. O procedimento MIXED do SAS foi utilizado para identificar quais variáveis mais influenciaram a variabilidade espacial da PM ao longo dos cinco anos de estudo. A saturação por bases (V) foi a variável que melhor se relacionou com a PM; portanto, modelos de semivariogramas foram ajustados aos dados destas variáveis e, posteriormente, interpolados pelo método da krigagem. O software Management Zone Analyst foi utilizado para realizar o agrupamento com o algoritmo fuzzy c-means. O número ótimo de zonas de manejo alterara-se ao longo do tempo, assim como o grau de similaridade espacial entre as zonas de manejo de V e da PM. Portanto, é de fundamental importância levar em consideração a variabilidade temporal da produtividade das culturas e dos atributos do solo para obter zonas de manejo com maior acurácia.
PALAVRAS-CHAVE: Management Zone Analyst, agricultura de precisão, pH do solo, solos
Management zones using fuzzy clustering based on spatial-temporal variability of soil and corn yield 471
INTRODUCTION
A management zone in a crop field expresses a sub-region that has a relatively homogeneous combination of yield-limiting factors (VRINDTS et al., 2005; LI et al., 2007). Within-field management zones have many uses, for example, as an alternative for grid soil sampling and nutrient maps of fertilizer application variable rate or even to relate yield to soil parameters for crop-modeling evaluation (LI et al., 2007).
Several types of information have been used to delineate management zones, such as: terrain attributes, electrical conductivity, soil resistance to penetration, chemical soil attributes, crop indices like NDVI (Normalized Difference Vegetation Index ), and crop yield maps (FRAISSE et al., 2001; JIANG et al., 2011; ROSALEN et al., 2011; DELALIBERA et al., 2012). Among these types of information, some studies in Brazil (MOLIN, 2002; AMADO et al., 2007) have defined management zones based on yield maps from data collected over time. This is due to yield mapping being a simple, inexpensive tool for monitoring crop yield at fine spatial resolutions; in addition, it provides the best information for time and spatial variability.
Some studies (GUEDES FILHO et al., 2010; DIACONO et al., 2012) have correlated temporal crop yield maps with soil attributes maps to define management zones correctly. These studies have considered only the temporal variability of crop yield. However, the dominance of factors that influence crop yield variability can change from year to year because of seasonal weather variation. Therefore, temporal variability or stability of both crop yield and soil attributes should be taken into account when delineating management zones (LI et al., 2007).
One important question arises when considering field management by zones, which is, how many unique zones should a field be divided. This is because if the user defines a different number of classes, the results of the classification will be different and consequently, different management zones will be produced (FRAISSE et al., 2001). In order to overcome this problem, cluster analysis procedure, which groups similar individuals into distinct classes through an iterative process called clustering, can be used (FRIDGEN et al., 2004) and the number of management zones can be chosen based on the fuzziness performance index (ODEH et al., 1992) and/or normalized classification entropy (BEZDEK, 1981).
Of the different cluster analyses, fuzzy c-means algorithm has been widely used to delineate management zones (FRAISSE et al., 2001; LI et al., 2007; JIANG et al., 2011, VALENTE et al., 2012). In addition, software developed by FRIDGEN et al. (2004) on the basis of a fuzzy c-means clustering algorithm called Management Zone Analyst (MZA) can be used easily by researchers and farmers, who need only to input data into the software to obtain rapid results (JIANG et al., 2011). MZA uses the clustering of soil and crop data as a basis for the definition of management zones by grouping the data into clusters based on the similarity of interaction between soil and crop data (FRAISSE et al., 2001).
Therefore, the objectives of this study were 1) to identify management zones using fuzzy c-means clustering analysis based on the spatial and temporal variability of soil attributes and corn yield, and 2) to test the reliability of using MZA software to delineate management zones.
MATERIAL AND METHODS Site description
The experiment was conducted at Jaboticabal, São Paulo State, Brazil (21º 14’ 05’’ S, 48º 17’
09’’W, 613 m asl). Climatologically, the area belongs to the tropical/megathermal zone or Köppen
Aw (a tropical climate with dry winters and average temperatures of the coldest month above 18
ºC). The mean annual rainfall (1971–2006) is 1417 mm, peaking in the period from October–March
and a relatively dry period from April–September. The soil of the experimental area is a clayey
The experimental area was managed in a corn-fallow rotation under no-tillage for 12 years. Before corn seeding, weeds were eliminated with non-selective herbicides. Liming was carried out before starting the experiment in order to obtain 60% soil base saturation.
Corn yield, soil sampling, and climatic data
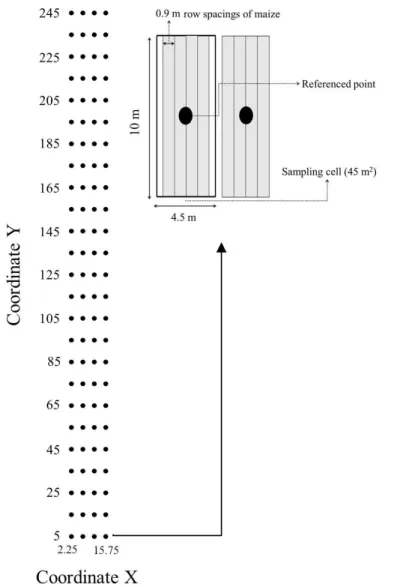
The size of the experimental area was 18 by 250m with the longer dimension oriented in the East-West direction. Each of the 100 sampling cells had a dimension of 10 by 4.5 m and were
arranged in a 25 by 4 m grid. Therefore, each sampling cell encompassed an area of 45 m2 and
consisted of five 10 m long crop rows (0.9 m), in which the geo-referenced points were the center. The experimental scheme is depicted in Figure 1.
FIGURE 1. Experimental field divided into 100 cells for corn yield and represented by their central points for sampling soil attributes and corn yield in an Distroferric Red Oxisol under no-tillage system.
Corn (Zea mays - triple-hybrid Syngenta Master) was planted at 65,000 plants ha-1 with 0.9 m
row spacing in early December between the 2001 and 2010 growing seasons, although the data were collected only in the 2001/2002, 2002/2003, 2007/2008, 2008/2009 and 2009/2010 growing
seasons. The starter fertilization consisted of 30kg of N, 70 kg of P2O5 and 50kg of K2O ha-1.
Nitrogen fertilizer (urea) was applied at 100 kg N ha-1 when plants had four to six leaves totally
Management zones using fuzzy clustering based on spatial-temporal variability of soil and corn yield 473
weighing scale in the field. The grain for each cell was sub-sampled for moisture and grain yields were determined at 13% gravimetric moisture.
Each year, five soil sub-samples were collected within each plot using a Dutch auger (0.1m depth) and were composited. One of the soil sub-samples was collected in the middle of the plot and the other four samples were collected 2 m apart from the middle in all four cardinal directions from the centroid. The support of soil measurements was assumed similar to the one of crop yield (45
m2). Each soil composite sample was analyzed for particle size (pipette method) (GEE & DANI,
2002), pH (1:1 soil/water mixture), organic matter (OM) (Walkley-Black method), P (ion‐exchange
resin), K+, Ca2+ and Mg2+ (1 M NH
4O Ac. extractable at buffered at pH 7) according to PAGE et al.
(1982). From the analytical determinations, cation exchange capacity (CEC = K+ + Ca2+ + Mg2+ + H
+ Al+3) and percentage of soil base saturation (BS = (K+ + Ca2+ + Mg2+ / CEC) x 100) were
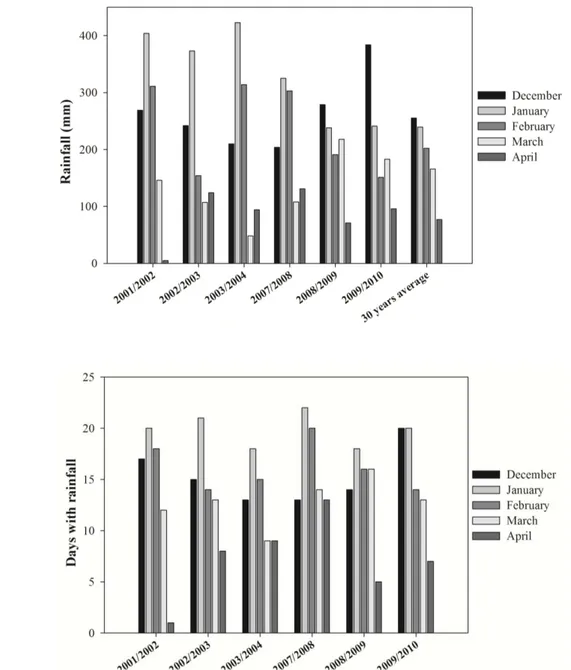
calculated. Soil texture was analyzed once, since there are no significant changes in a short period. Monthly cumulative rainfall, growing degree-days (base temperature of 10°C), average temperatures, relative humidity and number of days with rainfall were recorded by a weather station located 30 m from the experimental site from December 2001 to April 2010 (Figure 2a and b).
(a)
(b)
FIGURE 2. Average monthly rainfall values for the period December–April of the studied years
Descriptive statistics analyses and mixed model analysis
Descriptive statistical analyses (mean, standard deviation, minimum, maximum, coefficient o f skewness, and coefficient of kurtosis) were calculated. In order to test the hypothesis of normality, the SHAPIRO and WILK (1965) test was conducted.
The heteroscedastic spatial-temporal autocorrelation model was used to identify whic h variable(s) most influenced the spatial variability of corn yield over the five study years. This procedure was chosen because it takes into account the spatial and temporal variability of crop
yields and soil attributes, as well as the heteroscedasticity of variables and because it shows better
results in determining the yield-limiting factors than traditional regression analyses, using ordinary least square. A detailed description of this analysis for the present study area was given in RODRIGUES et al. (2013).
Data processing
Semivariogram models were fitted to soil attributes (chosen with mixed model) and corn yield data for all study years. The semivariograms were validated with cross-validation analysis, and isotropy in all adjusted models observed. The soil attributes and corn yield data were interpolated using ordinary kriging in a raster data format of 1 m pixels. All these analyses were computed using ArcGIS (Redlands, CA) with the Geostatistical Analyst Extension and afterwards data files were imported as a comma delimited text file with the first row as labels for the columns to MZA software.
Data analyses using MZA software
Fuzzy clustering algorithms were used to classify data into homogenous zones by MZA software (FRIDGEN et al., 2004). The options settings chosen were similar to those of Euclidean; fuzziness exponent = 1.3, maximum number of iterations = 300, convergence criterion = 0.0001, minimum number of zones = 2, and maximum number of zones = 6.
A number of validity statistics were used to determine the best combinations of fuzziness index and number of clusters, as well as the overall clustering performance. The fuzziness performance index (FPI) is a measure of the degree to which different classes share membership (fuzziness) and values are constrained between 0 and 1 (ODEH et al., 1992). The normalized classification entropy (NCE) is used when deciding how many clusters are most appropriate for creating management zones, which can help the user obtain management zones simply and quickly (BEZDEK, 1981). By minimizing the value for NCE and FPI, the optimum number of clusters can be found.
Analytical method for comparing the soil manage ment zone maps with the corn yield manage ment zone maps
In order to compare the relationship between soil attributes maps and corn yield in every study year, Kappa index coefficient was used (JENSEN, 1996). Kappa coefficient of agreement, a common index used for accuracy assessment in remote sensing, measures pair-wise agreement between the margin pixel in a cross-classification contingency table, then corrects for chance agreement (KITCHEN et al., 2005). Thus, cross-tabulation between the soil management zone map and its correspondent corn yield management zone map, with the same number of classes, was performed in order to obtain a confusing matrix of data (VALENTE et al., 2012). After that, the kappa coefficient was obtained as described by JENSEN (1996).
RESULTS AND DISCUSSION Descriptive statistics of soil attributes
All soil fertility data was classified as low, medium, or high according to criteria determined by RAIJ et al. (1997) for the state of Sao Paulo. Percentage soil base saturation values (Table 1) were medium (i.e., 51-70%) in the 2001/2002 and 2002/2003 growing seasons, and low (i.e.,
Management zones using fuzzy clustering based on spatial-temporal variability of soil and corn yield 475
well as the soil P levels were medium (16-40 mg dm-3) in all the study years. The levels of soil Ca2+
were high (greater than 7 mmolc dm-3) in all the study years, whereas soil Mg2+ were high (greater
than 8 mmolc dm-3) in the 2001/2002, and 2002/2003, and medium (5-8 mmolc dm-3) in the
2007/2008, 2008/2009, and 2009/2010. Medium values of pH (5.1-5.5) were observed in the 2001/2002 and 2002/2003 and low (4.4-5.0) in the 2007/2008, 2008/2009, and 2009/2010. Soil base saturation values were greater than 50% in the first two years, indicating eutrophic conditions. Medium soil organic matter contents (OM) were observed in all the years. Most variables showed large variability based on their range of variation (Table 1). In general, the so il fertility variables were normally distributed and coefficients of asymmetry and kurtosis varied over years. However,
this did not prevent geostatistics analyses, since normality is not a requirement. The clay (332 g kg
-1, standard deviation = 19 g kg-1) and sand (623 g kg-1, standard deviation = 17 g kg-1) content of the
TABLE 1. Descriptive statistics of soil chemical attributes from 0 to 0.1 m depth in an Distroferric Red Oxisol under no-tillage system over five growing seasons.
CEC = Cation exchange capacity; BS = Soil base saturation; Pr < W = result of Shapiro-Wilk normality test (P<W > 0.1)
Descriptive statistics of crop yield and mixed model analysis
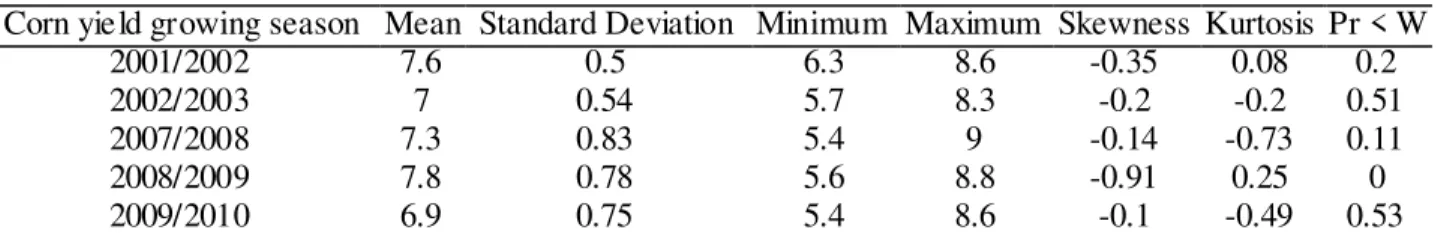
Corn yields ranged from 6.9 to 7.8 Mg ha-1 (Table 2), and showed normal data distribution in
all the years, except in the 2008/2009 growing season, as indicated by the Shapiro-Wilk test (Table 2). However, their coefficients of skewness and kurtosis were close to zero, indicating no substantial departure from normality so the yield was then assumed normal. The preliminary statistic analyses with mixed models indicated that pH was the variable that better related to corn yield spatially at all study years. High correlation between base saturation (BS) and soil pH is often observed in tropical soils (CATANI & GALLO, 1955) and is also found in our study with Pearson correlation coefficient (r) greater than 0.97 (data not shown). Therefore, we chose BS instead of soil pH because it is a more practical attribute for agronomic management purposes. A complete
Attributes P OM pH K+ Ca2+ Mg2+ CEC BS
(mg dm-3) (g dm-3) (CaCl
2) (mmolc dm-3) (%)
2001/2002 growing season
Mean 30 20 5.16 2.77 21 10 62 53
Std Dev 16 2.13 0.53 0.94 9 5 8 16
Minimum 10 15 4.2 1.2 7 3 51 20
Maximum 75 24 6.6 6.6 50 30 91 84
Skewness 1.06 0.09 0.29 1.11 0.68 1.25 1.2 -0.26
Kurtosis 0.42 -0.52 -0.13 2.33 0.64 2.88 2.04 -0.78
Pr < W 0 0.04 0.05 0 0 0 0 0.01
2002/2003 growing season
Mean 25 19 5.08 1.86 22 10 64 53
Std Dev 20 2.53 0.46 0.63 9 5 9 16
Minimum 1 11 3.9 0.8 5 2 38 12
Maximum 103 26 6 3.9 46 40 109.4 84
Skewness 1.82 -0.6 -0.43 1.01 0.21 1.97 1.43 -0.54
Kurtosis 3.47 1.88 -0.47 1.65 0.07 9.63 7.43 -0.24
Pr < W 0 0 0.03 0 0.17 0 0 0.01
2007/2008 growing season
Mean 33 16 4.67 1.93 14 7 57 39
Std Dev 16 2.20 0.37 0.55 7 4 12 14
Minimum 8 11 3.9 0.9 3 2 28 16
Maximum 67 22 5.6 3.6 36 28 93.3 78
Skewness 0.43 0.03 0.17 0.81 0.92 2.11 0.1 0.58
Kurtosis -0.87 0.3 -0.2 1.26 0.8 8.37 0.22 0.09
Pr < W 0 0.08 0.45 0 0 0 0.93 0.02
2008/2009 growing season
Mean 38 17 4.41 2.39 13 6 65 33
Std Dev 22 3.08 0.36 0.69 6 3 5 13
Minimum 8 10 3.8 1.4 2 1 46.4 8
Maximum 114 26 5.3 4.7 29 16 75.7 63
Skewness 1.28 -0.2 0.08 0.77 0.48 1.21 -0.1 0.18
Kurtosis 1.63 0.17 -0.27 0.2 -0.25 3.4 0.77 -0.41
Pr < W 0 0.18 0 0 0.05 0.02 0.34 0.28
2009/2010 growing season
Mean 30 17 4.35 2.24 10 6 63 30
Std Dev 17 2.62 0.35 0.51 5 3 7 12
Minimum 11 2 3.8 1.3 3 2 50.8 10
Maximum 112 27 5.3 4.4 28 16 80.1 60
Skewness 1.96 -1.31 0.36 0.72 0.62 1.19 0.43 0.26
Kurtosis 6.15 12.99 -0.22 2.48 0.66 2.16 -0.28 -0.43
Management zones using fuzzy clustering based on spatial-temporal variability of soil and corn yield 477
discussion about mixed model results for this present study area can be found in RODRIGUES et al. (2013).
TABLE 2. Descriptive statistics of corn yield (Mg ha-1) of five growing season in an Distroferric
Red Oxisol under no-tillage system.
Pr < W = result of Shapiro-Wilk normality test (P<W > 0.1).
Geostatistics analyses of soil attributes and corn yield
Spatial dependence was observed for corn yield for all study years (Table 3). The spherica l model was used for corn yield in all five years (Table 3). Also spatial dependence was observed for BS in all study years and the Gaussian model was used for these variables (Table 3). In order to match with the corn yield maps, five years of BS data were used for clustering analyses (Figure 3).
TABLE 3. Variogram model parameters of corn yield and base saturation of five growing seasons in an Distroferric Red Oxisol under no-tillage system.
Growing season Model Nugget effect Partial Sill Range (m)
Corn Yield
2001/2002 Spherical 0.07 0.28 12
2002/2003 Spherical 0.15 0.08 47
2007/2008 Spherical 0.1 0.8 27
2008/2009 Spherical 0.65 1.13 51
2009/2010 Spherical 0.35 0.23 49
Base saturation
2001/2002 Gaussian 75.59 146.4 25
2002/2003 Gaussian 125 98.07 26
2007/2008 Gaussian 46.13 170.29 20
2008/2009 Gaussian 75 170.42 17
2009/2010 Gaussian 90 150 15
Fuzzy c-means clustering analyses
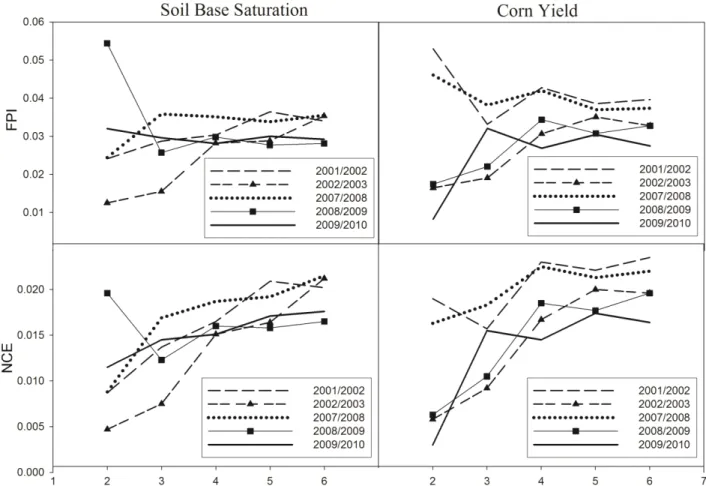
The minimum least membership sharing (FPI) and amount of organiza tion (NCE) were similar in that the minimum value was obtained in the same zone for BS and corn yield at all years, except for BS in the 2009/2010 growing season and for corn yield in the 2007/2008 growing season, which were dissimilar (Figure 4). The optimal number of clusters for each comp uted index is when the index is at the minimum, representing the FPI and NCE because of the clustering process. The optimum number of clustering zones, considering both indices, varied from 2 to 4. These results indicate that the optimum number of manageme nt zones can change over time, thus the choice of how many management zones should be based in the temporal data set. FRAISSE et al. (2001) also pointed out that the optimal number of zones may vary from year to year and is mainly a function of the weather and the crop planted.
Corn yield growing season Mean Standard Deviation Minimum Maximum Skewness Kurtosis Pr < W
2001/2002 7.6 0.5 6.3 8.6 -0.35 0.08 0.2
2002/2003 7 0.54 5.7 8.3 -0.2 -0.2 0.51
2007/2008 7.3 0.83 5.4 9 -0.14 -0.73 0.11
2008/2009 7.8 0.78 5.6 8.8 -0.91 0.25 0
FIGURE 3. Management zone maps using fuzzy c-means clustering analyses of base saturation (BS) and corn yield of five growing seasons in an Distroferric Red Oxisol under no-tillage system.
Although in general, the FPI and NCE index minimum values indicated two management zones, it was observed, based on zone maps and prior knowledge in this area, that only two management zones would not be sufficient to verify all corn yield variab ility. Therefore, three management zones were chosen instead of two. Moreover, it appears that there were little difference in the index values between the number of two and three zones, but a much greater difference in the index values between the number of three zones and other zones (Figure 4), so the choice of three management zones can be scientifically accepted.
2001/2002 2002/2003 2007/2008
BS (%) Yield (Mg ha-1) BS (%) Yield (Mg ha-1) BS (%) Yield (Mg ha-1)
Co
ord
en
at
e
Y
2008/2009 2009/2010
BS (%) Yield (Mg ha-1) BS (%) Yield (Mg ha-1)
(
( ( Zones
1
2
3
Management zones using fuzzy clustering based on spatial-temporal variability of soil and corn yield 479
FIGURE 4. Fuzziness performance index (FPI) and normalized classification entropy (NCE) as calculated by Management Zone Analyst software for base saturation and corn yield of five growing seasons in an Distroferric Red Oxisol under no-tillage system.
TABLE 4. Degree of agreement (kappa coefficient) between the base saturation (BS) and corn yield management zone maps of five growing seasons in an Distroferric Red Oxisol under no-tillage system.
BS vs. Corn yield maps Kappa coefficient
2001/2002 -0.03
2002/2003 0.66
2007/2008 0.31
2008/2009 0.13
2009/2010 0.4
The kappa coefficient between BS and corn yield management maps varied from -0.03 to 0.66 (Table 4). These findings demonstrate that the degree of agreement between the BS and corn yield management zone maps can change over time, which is in agreement with LI et al. (2007), who pointed out that the defining of management zones should rely on spatial information that is stable or predictable over time and is related to crop yield. Therefore, a temporal data set of crop yield and yield-limiting factors should be used to delineate management zones.
Based on the kappa coefficient, BS can be used to delineate management zones in the present study area, since the values were classified from having fair to good agreement in three out of the five study years (0.31; 0.4 and 0.66) (Table 4). This is expected because the main factor that impacts crop yields in most Brazilian agricultural fields is soil acidity (DALCHIAVON et al., 2011; NOGARA NETO et al., 2011).
The results of the kappa coefficient (Table 4) did not show any direct correlation to the climatic variables assessed. However, this dissimilarity between BS and corn yield zone maps was most likely due to temporal variability and many other variables such as germination rates, weeds, insects, diseases and climate, which are related to crop yield (RODRIGUES et al., 2012), but which were not assessed in this study.
For farmers to adopt site-specific management, the development of management zones must be simple, functional, and economically feasible (LI et al., 2007), thus, we proposed to divide the study field into three zones based on the zone maps obtained from the clustering analyses using MZA software for the five study years - depicted in Figure 5.
Management zones using fuzzy clustering based on spatial-temporal variability of soil and corn yield 481
FIGURE 5. Management zones based on the fuzzy c-means clustering analyses of soil base saturation and corn yield of five growing seasons in an Distroferric Red Oxisol under no-tillage system.
*Zone 1: h igh yield potential; Zone 2: mediu m y ield potential; Zone 3: lo w yield potential.
CONCLUSIONS
It was possible to delineate using fuzzy c-means cluster analysis based on the spatial and temporal variability of soil attributes and corn yield in a crop field in Brazil. Soil acidity, as assessed by soil base saturation, was the soil effect that most influenced corn yield over time in this study. It is very important to take into account the temporal variability of crop yield and soil attributes to delineate management zones accurately as these factors can change over time. Management zone analytics was a reliable and simple tool to delineate management zones and would be useful for agronomists and farmers.
ACKNOWLEDGEMENTS
The authors are grateful for support from CAPES Foundation, Ministry of Education o f
Brazil, Brasília – DF 70040-020, Brazil, by granting a PhD scholarship to the first author (Grant
REFERENCES
AMADO, T. J. C.; PONTELLI, C. B.; SANTI, A. L.; VIANA, J. H. M.; SULZBACH, L. A. D. S.
Variabilidade espacial e temporal da produtividade de culturas sob sistema plantio direto. Pesquisa
Agropecuária Brasileira, Brasília, v. 42, n. 8, p. 1101-1110, 2007.
BEZDEK, J. C. Patte rn Recognition with Fuzzy Objective Function Algorithms. Kluwer
Academic Publishers, Norwell: 1981. p. 256.
CATANI, R. A.; GALLO, J. R. Avaliação da exigência em calcário dos solos do Estado de São
Paulo mediante correlação entre o pH e a porcentagem de saturação em bases. Revista
Agricultura, Piracicaba,v. 30, p. 49-60, 1955.
DALCHIAVON, F. C.; CARVALHO, M. P.; FREDDI, O. S.; ANDREOTTI, M.; MONTANARI, R. Variabilidade espacial da produtividade do feijoeiro correlacio nada com atributos químicos de
um Latossolo Vermelho Distroférrico sob sistema de semeadura direta. Bragantia, Campinas, v.
70, n. 4, p. 908-916, 2011.
DELALIBERA, H. C.; WEIRICH NETO, P. H.; NAGATA, N. Management zones in agriculture
acording to the soil and landscape variables. Engenharia Agrícola, Jaboticabal, v. 32, n. 6, p.
1197-1204, 2012.
DIACONO, M.; CASTRIGNANÒ, A.; TROCCOLI, A.; DE BENEDETTO, D.; BASSO, B.; RUBINO, P. Spatial and temporal variability of wheat grain yield and quality in a Mediterra nean
environment: A multivariate geostatistical approach. Field Crops Research, Amsterdam, v. 131, p.
49-62, 2012.
FRAISSE, C. W.; SUDDUTH, K. A.; KITCHEN, N. R. Delineation of site-specific management zones by unsupervised classification of topographic attributes and soil electrical conductivity. Transactions of the ASABE, Saint Joseph, v. 44, n. 1, p. 155-166, 2001.
FRIDGEN, J. J.; KITCHEN, N. R.; SUDDUTH, K. A.; DRUMMOND, S. T.; WIEBOLD, W. J.; FRAISSE, C. W. Management Zone Analyst (MZA): Software for subfield management zone
delineation. Agronomy Journal,Madison, v. 96, n. 1, p. 100-108, 2004.
GEE, G. W.; DANI, O. Particle-Size Analysis. In: DANE, J. H.; TOPP, G. C. (Ed.). Methods of
soil analysis, Part 4 - Physical methods. Madison: Soil Science Society of America, 2002. p.255-289.
GUEDES FILHO, O.; VIEIRA, S. R.; CHIBA, M. K.; NAGUMO, C. H.; DECHEN, S. C. F. Spatial and temporal variability of crop yield and some Rhodic Hapludox properties under
no-tillage. Revista Brasileira de Ciência do Solo, Viçosa, MG, v. 34, n. 1, p. 1-14, 2010.
JENSEN, J.R. Introductory digital image processing:a remote sensing perspective. Upper Saddle
River: Prentice-Hall, p. 250–251, 1996.
JIANG, Q.; FU, Q.; WANG, Z. Study on delineation of irrigation management zones based on
Management Zone Analyst software. In: LI, D.: LIU, Y.: CHEN, Y. (Ed.). Computer and
computing technologies in agriculture IV.Dordrecht: Springer, 2011, v.346, p.419-427. (IFIP, AICT, 346).
KITCHEN, N.; SUDDUTH, K.; MYERS, D.; DRUMMOND, S.; HONG, S. De lineating
productivity zones on claypan soil fields using apparent soil electrical conductivity. Computers
and Electronics in Agriculture, Amsterdam,v. 46, n. 1, p. 285-308, 2005.
LANDIS, J.R.; KOCH, G.G. The measurement of observer agreement for categorical data. Biometrics, New York, v.33, 159–174, 1977.
LI, Y.; SHI, Z.; LI, F.; LI, H.-Y. Delineation of site-specific management zones using fuzzy
clustering analysis in a coastal saline land. Computers and Electronics in Agriculture,
Management zones using fuzzy clustering based on spatial-temporal variability of soil and corn yield 483
MOLIN, J. P. Definição de unidades de manejo a partir de mapas de produtividade. Engenharia
Agrícola, Engenharia,v. 22, n. 1, p. 83-92, 2002.
NOGARA NETO, F.; ROLOFF, G.; DIECKOW, J.; MOTTA, A. C. V. Atributos de solo e cultura
espacialmente distribuídos relacionados ao rendimento do milho. Revista Brasileira de Ciência do
Solo, Viçosa, MG, v. 35, n. 3, p. 1025-1036, 2011.
ODEH, I. O. A.; CHITTLEBOROUGH, D. J.; MCBRATNEY, A. B. Soil pattern recognition with
fuzzy-c-means: Application to classification and soil-landform interrelationships. Soil Science
Society of America Journal, Madison, v. 56, n. 2, p. 505-516, 1992.
PAGE, A. L.; MILLER, R. H.; KEENEY, D. R. Methods of Soil Analysis: Part 2. Chemical and
microbiological properties. Madison: American Society of Agronomy, Crop Science Society of America, Soil Science Society of America, 1982. 1159.
RAIJ, B. van; CANTARELLA, H.; QUAGGIO, J. A.; FURLANI, A. M. C. (Ed). Recomendações
de adubação e calagem para o Estado de São Paulo. 2.ed. Campinas: Instituto Agronômico/Fundação IAC, 1997. 285p. (Boletim Técnico, 100).
RODRIGUES, M. S.; CORÁ, J. E.; CASTRIGNANÒ, A.; MUELLER, T. G.; RIENZI, E. A Spatial
and temporal prediction model of corn grain yield as a function of soil attributes. Agronomy
Journal, Madison, v. 105, n. 6, p. 1878-1887, 2013.
RODRIGUES, M. S.; CORÁ, J. E.; FERNANDES, C. Spatial relationships between soil attributes
and corn yield in no-tillage system. Revista Brasileira de Ciência do Solo, Viçosa, MG, v. 36,
n. 2, p. 599-609, 2012.
ROSALEN, D. L.; RODRIGUES, M. S.; CHIODEROLI, C. A.; BRANDÃO, F. J. C.; SIQUEIRA,
D. S. GPS receivers for georeferencing of spatial variability of soil attributes. Engenharia
Agrícola, Jaboticabal, v. 31, n. 6, p. 1162-1169, 2011.
SHAPIRO, S. S.; WILK, M. B. An analysis of variance test for normality (complete samples). Biometrika, London, v.52, n.3-4, p.591-611, 1965.
TAGARAKIS, A.; LIAKOS, V.; FOUNTAS, S.; KOUNDOURAS, S.; GEMTOS, T. Management
zones delineation using fuzzy clustering techniques in grapevines. Precision Agriculture, New
York, v. 14, n. 1, p. 1-22, 2013.
VALENTE, D. S. M.; QUEIROZ, D. M. D.; PINTO, F. D. A. D. C.; SANTOS, N. T.; SANTOS, F. L. Definition of management zones in coffee production fields based on apparent soil electrical
conductivity. Scientia Agricola, Piracicaba, v. 69, p. 173-179, 2012.
VRINDTS, E.; MOUAZEN, A. M.; REYNIERS, M.; MAERTENS, K.; MALEKI, M. R.;
RAMON, H.; DE BAERDEMAEKER, J. Management Zones based on Correlation between Soil