Article
J. Braz. Chem. Soc., Vol. 22, No. 4, 772-779, 2011. Printed in Brazil - ©2011 Sociedade Brasileira de Química 0103 - 5053 $6.00+0.00
A
*e-mail: [email protected]
Nutrients in Amazonian Black Earth from Caxiuanã Region
Vanda P. Lemos,*,a Antônio R. de Oliveira Meireles,a Kelly das Graças Fernandes,a
Milena C. de Moraes,a Marcondes L. da Costa,b Any K. TerraSilvab and Dirse C. Kernc
aInstituto de Ciências Exatas e Naturais and bInstituto de Geociências,
Universidade Federal do Pará, 66075-110 Belém-PA, Brazil
cMuseu Paraense Emilio Goeldi, Belém-PA, Brazil
Padrões de dispersão de nutrientes em terra preta Amazônica (TPA) podem dar informações sobre atividades antrópicas dos habitantes da Amazônia. Estudos sobre pH, fósforo disponível (P), matéria orgânica (MO) e os cátions trocáveis, Ca2+ e Mg2+, foram realizados em amostras de solos dos horizontes A1 e A2 ao longo de uma área com TPA (norte-sul e leste-oeste) em um sítio arqueológico denominado Ilha de Terra, na Unidade de Conservação Floresta Nacional de Caxiuanã, Município de Melgaço, Brasil. Os resultados indicaram que a MO e o Ca são os que apresentam maior dispersão. Correlações mais elevadas foram encontradas entre OM-Ca-Mg às proximidades da área central e levam a inferir que a dispersão geoquímica de MO, Ca, Mg e P em sítios arqueológicos com TPA está relacionada com atividades humanas pregressas.
Dispersion of nutrients in Amazonian black earth (ABE) can provide information on human activities of the inhabitants of the Amazon region. Studies on the pH, available phosphorus (P), organic matter (OM) and the exchangeable cations Ca2 + and Mg2 + were performed on soil samples from horizons A1 and A2 over an area with TPA (north-south and east-west) at a site called Ilha de Terra, located in the Conservation Unit Caxiuanã National Forest, Melgaço County, Brazil. The results indicated that the OM and Ca2+ are the ones with greater dispersion. Higher correlations were found between OM-Ca-Mg to near the central area. This leads to the inference that the dispersion geochemistry of MO, Ca, Mg and P in archaeological sites with TPA is related to past human activities.
Keywords: nutrients, Caxiuanã, soils, Amazonian black earth
Introduction
Chemical, mineralogical and micromorphological analysis can be used to interpret human activities from material remains in soils. The abandonment of human activities in settlements does not affect chemical residue remains in soils. The potential validity of the chemical analysis of soil to interpret archaeological inds lies in its ability to predict signiicant features based on (i) the chemical signatures of total concentrations of
multi-elements such as Ba, Ca, P, Zn, Cu and Pb in soils;1
(ii) the chemical signatures of loor samples in the Maya
region;2,3 (iii) the available nutrients in soils from the
Brazilian Amazon basin,4-8 known by designations such
as black earth, Indian black earth, anthropogenic black earth, archaeological black earth, Amazonian black earth
(ABE)9,10 or Amazonian dark earths.11,12 The area in which
ABE occurs is characterized by well-drained soil, running water and located in a particular geographical setting from
which the surrounding areas can be clearly observed.9
ABE is a soil that can be distinguished from other soils from the Brazilian Amazon because of its high content of Ca, Mg, Zn, Mn, P and C due to the incorporation of bones
and organic matter (OM).The high level of organic matter
in ABE is attributed to the time of human occupation of the
site.10-13 According to the soil classiication system, ABE
In Latossolos, the organic component is derived from the natural vegetal covering, whereas in ABE the organic component is principally derived from the debris of human occupation. These highly fertile micro-ecosystems formed in the past seem not to exhaust their chemical content in
conditions of tropical forest.6 The association between soil
nutrient level and availability is dependent on the extraction used to determine the nutrient level, soil water regime, physical and chemical soil characteristics controlling nutrient movement and the ability of the plant or plants in question to use the nutrient when it reaches the surface. Nutrient bioavailability is a function of the release of nutrients from their inorganic or organic solid phases, followed by their movement through the soil solution to the roots or fungi,
with an ensuing uptake in plant available form.7
In the ield, ABE soils are identiied by unusual features for Amazonian upland soils, such as top soils with dark matrix colors (dark brown to black), the presence of lithic artifacts and pyrogenic carbon.9,15 The occurrence
of ceramics and black carbon indicates that the genesis of
these soils is strongly linked to anthropogenic processes.12,16
Several terms are used synonymous with black carbon, such as charcoal, soot, elemental carbon or pyrogenic carbon. Black carbon has been proposed to be an important sink in
the global carbon cycle.15-18 Information on the chemical
properties and biological stability of black carbon in soil is limited and more research is needed in this area.
The most accepted theory on the origin of ABE is the anthropogenic evidence demonstrated through the activities
of prehistoric humans. The observations of Neves et al.19
indicate that the social practices in settlements with ABE are still not fully understood and that ABE formation was a faster process than previously thought. The increase in population according to the weather could provide an explanation on the formation of ABE but this has not been indicated in sites with multiple occupations. Further research might explain the abandoned settlements in the central Amazon.
Chemical and mineralogical studies on ABE can evaluate the anthropogenic impact on the original soils. An evaluation of the dispersion of nutrients in an area with ABE has been made in this paper. The selected ABE site is called Iha de Terra, located in the area of research called Estação Cientíica Ferreira Penna (ECFPn), within the National Forest of Caxiuanã (NF-Caxiuanã), belonging to the cities
of Portel and Melgaço-Pará in the Amazon region.20
Study area
The national forest of Caxiuanã (NF-Caxiuanã) is located on the west side of the Bay of Caxiuanã downstream
of the Anapu River and the bank of the Xingu River, and includes the cities of Portel and Melgaço in the lower Amazon. NF-Caxiuanã is administered by the Brazilian Institute for Environmental Monitoring (IBAMA) and is protected by the National System of Conservation of Nature from the federal government. The ECFPn built inside the reserve and belonging to the Museu Paraense Emílio Goeldi (MPEG) supports multidisciplinary research on natural sciences. Access to the area is in two steps: the irst through the waterway between the cities of Belém and Breves (Ilha do Marajó), lasting for 12 h; the second stage is also a waterway. The journey in this step is made by boat to the ECFPn and passes Hole Breves, the Bay of Melgaço, Anapu river basin toward the source of the river (duration of 9 h), Bay of Caxiuanã, Curuá River until reaching the Trapiche-ECFPn. The area of ECFPn (33,000 hectares) is located north of NF-Caxiuanã and is surrounded by a dense forest area, which ensures optimal conditions for its conservation. Around the edges of the Bay of Caxiuanã, 27 archaeological sites with ABE were discovered. The archaeological site Ilha de Terra is located near the Hole Camuim. Ancient inhabitants of the cities of Portel and Melgaço were the Indians Arucará and Aricuru (also called Guaricuru, Uaricuri or Ingaíbas), respectively. Currently, some families are found near the rivers but they do not cause damage to the environment because they preserve
the habits of prehistoric man.21
Experimental
Soil sampling
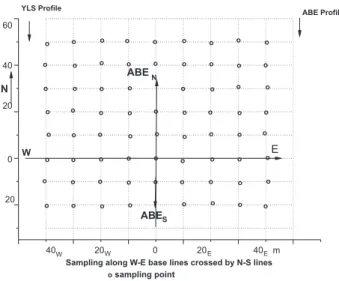
The ABE area was delimited from the yellow Latossolos surrounding (YLS). East-west and north-south base lines were traced by auxiliary lines with 10 m spacing for sampling. The sampling was carried out along the ABE area (Figure 1), between two soil proiles (YLS proile and
ABE proile), following the methods of Lemos and Santos.21
The horizons of the soils were classiied according to the methods of the Brazilian System of Soil Classiication and color samples were determined according to Munsell collors.23
Soil analysis
Samples (fractions < 2 mm) of air-dried soil were used in the particle size distribution of the bulk soil, morphological, mineralogical and chemical analysis. Particle size distribution was determined using the sieve/ pipette method after ultrasonic dispersion in NaOH
carbon were examined by scanning electron microscopy (SEM), from thin layers of samples sputtered with Pt to enhance the surface conductivity. SEM analysis was performed under conditions of images obtained by electron backscattering at 20 kV, with a distance of work of 14 mm. Mineralogical analysis was carried out by X-ray diffraction (XRD) using a Philips X-ray diffractometer
(PW-1050) with monochromatic Cu-Kα radiation. The
following chemical analysis were carried out according to the soil survey laboratory methods manual from
USDA:24 potentiometric measures of pH (in H
2Oand
KCl), concentrations for available P, exchangeable Ca2+
and Mg2+ and the total concentrations for organic C, Si,
Al and Fe. Suitable extractors were used in the analysis of available P and exchangeable cations ions to replace or promote the selective dissolution of ions on the surface of minerals and organic substances. Exchangeable Ca2+ and Mg2+ were extractable with the KCl solution
(1 mol L–1) and the available P with the extractor
Mehlich-1 (HCl 0.05 mol L–1 plus H
2SO4 0.0125 mol L–1).
Concentrations of exchangeable Ca2+ and Mg2+ were
measured by atomic absorption spectrometry and the
available P by spectrophotometry (λ = 860 nm) as a blue
heterocompound from the reduction of heteropolyacid
molybdophosphoric.25
The measurement total organic carbon (TOC) can help the indirect analysis of OM formed during the decay of plant and microbial residues, either by selective preservation and the transformation of constituents resistant to biodegradation and aliphatic polymers, or by the condensation of low-molecular-weight degradation products such as phenols, phenolic acids and amino
acids.26,27 TOC was determined by Walkley-Black modiied
acid-dichromate digestion and FeSO4 titration. TOC values
were multiplied by the Van Bemmelen factor of 1.724 to calculate OM. Black carbon is not determined by the Walkley-Black method, but its presence was investigated by macroscopic observations and SEM analysis.
Total concentrations for Si, Al and Fe were determined using the alkaline fusion method after the dissolution of the sample melted in HCl solution, evaporation of the acid solution, treatment of the residue from this evaporation with concentrated HCl to precipitate silica, iltration (solution A) and separation of the precipitate, treatment of the precipitate
with a mixture of H2SO4:HF (1:200), calcination and
weighing the inal residue. Solution A was used to measure the concentrations of Al and Fe by AAS-lame.
The signiicance of the variability of the chemical elements and correlation coeficients for these elements from the ABE area was evaluated by analysis of variance of values (F) and correlation matrix, respectively. The variance values were determined for the CCABE areas north, south, central, north-south and west-east, indicated in this study as ABEN, ABES, ABEcentral , ABEN-S and ABEW-E, respectively.
Results and Discussion
The soil horizons
The following horizons were observed in the ABE
proile: A1 and A2 black (0-7 cm and 7-14 cm, respectively),
A3 dark brown (14-29 cm), AB dark grayish brown
(29-57 cm), BA brown (57-89 cm) and B1, B2 and B3
brownish yellow (89-110, 110-135 and 135-161 cm,
respectively). The YLS proile presents the following: A1
horizon dark grayish brown (0-8 cm), AB and BA horizons
brownish yellow (8-20 and 20-59 cm, respectively) and B1,
B2 and B3 horizons dark yellowish Brown (59-100, 100-162
and 162-180 cm, respectively).
Physical and chemical properties
The high OM, available P, exchangeable Ca2+ and Mg2+
content (Tables 1-3) and frequent occurrence of BC are diagnostic attributes of anthropogenic soils. BC occurs in the forms of irregular fragments micrometer to millimeter and ibrous texture (Figure 2). Studies on BC in soils from other sites have shown great variability in sizes, shapes and chemical composition of particles of BC. It has also been found numerous particles of BC in the medium density fraction indicating organ-mineral complexes and the distribution of BC across aggregate fractions in close
contact with minerals.28-31
The physical and chemical properties in the soil proiles from ABE and YLS shows that the main differences between the two soil proiles are observed in the upper horizons of the soil proiles (Table 1 and Figure 3). Particle size distribution indicates a predominance of coarse sand fraction on the other fractions in soil proiles ABE and YLS, and this allows the identiication of the types of textures.
In the ABE proile, the texture is sandy in A1 to BA and
sandy-clay in B, whereas in the YLS proile the. Data from
X-ray diffraction show that the horizons A1 of soil proiles
ABE and YLS have quartz as main mineral. Relections of kaolinite were identiied only in the soil proile YLS (Figure 3). Anatase, goethite and or hematite were not identiied because they must occur at low frequencies, given the low concentrations of Ti and Fe obtained in these soils. From the total concentrations of SiO2, Al2O3, Fe2O3
and OM (Table 1) it was estimated the concentrations of the minerals and organic matter in both soil proiles. It was veriied that kaolinite and quartz are the predominant
Figure 2. Fragments of black carbon with micrometer dimensions, irregular shapes and ibrous texture from A1 horizon-ABE soil proile.
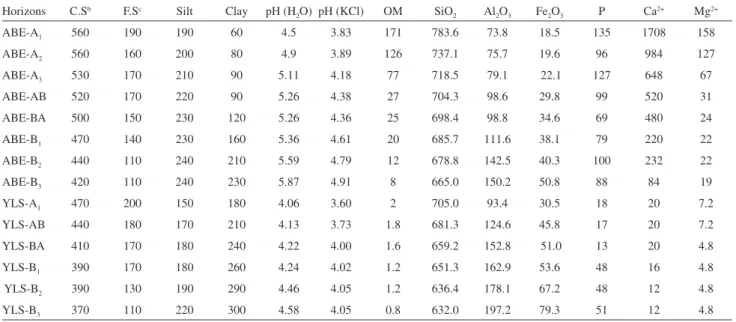
Table 1. Physical and chemical properties of the ABE soil proile and YLS soil proile. Concentrations of organic matter (OM), Ca2+, Mg2+, available P in
mg kg-1; coarse sand, ine sand, silt, clay, OM, SiO
2, Al2O3 and Fe2O3 in g kg-1
Horizons C.Sb F.Sc Silt Clay pH (H
2O) pH (KCl) OM SiO2 Al2O3 Fe2O3 P Ca2+ Mg2+
ABE-A1 560 190 190 60 4.5 3.83 171 783.6 73.8 18.5 135 1708 158
ABE-A2 560 160 200 80 4.9 3.89 126 737.1 75.7 19.6 96 984 127
ABE-A3 530 170 210 90 5.11 4.18 77 718.5 79.1 22.1 127 648 67
ABE-AB 520 170 220 90 5.26 4.38 27 704.3 98.6 29.8 99 520 31
ABE-BA 500 150 230 120 5.26 4.36 25 698.4 98.8 34.6 69 480 24
ABE-B1 470 140 230 160 5.36 4.61 20 685.7 111.6 38.1 79 220 22
ABE-B2 440 110 240 210 5.59 4.79 12 678.8 142.5 40.3 100 232 22
ABE-B3 420 110 240 230 5.87 4.91 8 665.0 150.2 50.8 88 84 19
YLS-A1 470 200 150 180 4.06 3.60 2 705.0 93.4 30.5 18 20 7.2
YLS-AB 440 180 170 210 4.13 3.73 1.8 681.3 124.6 45.8 17 20 7.2
YLS-BA 410 170 180 240 4.22 4.00 1.6 659.2 152.8 51.0 13 20 4.8
YLS-B1 390 170 180 260 4.24 4.02 1.2 651.3 162.9 53.6 48 16 4.8
YLS-B2 390 130 190 290 4.46 4.05 1.2 636.4 178.1 67.2 48 12 4.8
YLS-B3 370 110 220 300 4.58 4.05 0.8 632.0 197.2 79.3 51 12 4.8
aP-Mehlich-1; bCoarse sand; cFine sand.
minerals in both soil profiles. The concentrations of kaolinite increases with depth in both profiles, being more pronounced in the YLS proile. Goethite has a lower concentration than that of kaolinite and quartz in all proiles. The horizon A of the ABE proile has a higher concentration
in SiO2 and OM as well as lower concentrations of Al2O3
and Fe2O3 compared with those of the A horizon from the
YLS proile. In both soil proiles, there is an increase of the SiO2/Al2O3 ratio toward the surface, with the increase in the
ABE proile greater than in the YLS proile. The increase in the SiO2/Al2O3 ratio indicates that the soils have lost Al2O3,
resulting in an accumulation of quartz.
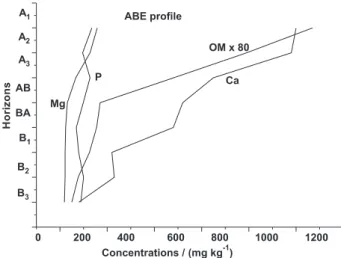
Figures 4 and 5 show the variability of the concentrations of OM compared with other chemical properties (available
P and exchangeable Ca2+ and Mg2+) along the soils proiles.
In the ABE soil profile are observed increase in the concentrations of Ca with those of OM; small variability in the concentrations of Mg and P. In the YLS soil proile was observed higher concentrations of OM in the horizons AB, BA and B1 and of P in the horizons B1 to B3; slight increase
in Ca concentrations towards the surface. The greater pH in the A horizon from the ABE proile and ABE area compared with those of the YLS (Table 1) is the result of higher base cation saturation of the cation exchange. This feature was observed in each site and might be the result of base cation
inputs during site habitation.21 pH has a further importance
because it can determine a variety of nutrient transformation
and toxicity relationships in soils.7
These data show that the values for pH and OM,
available P and exchangeable Ca2+ and Mg2+ concentrations
in ABE are compatible with those obtained from other
sites in the Caxiuanã region.21 It was estimated from the
difference between pH (H2O) and pH (KCl) that the ABE
and YLS soils from Ilha de Terra presents ∆pH between
–1.08 to –1.09 and –0.52 to –1.31, respectively. Surface charge is usually determined by the difference between pHZPC, the point of zero charge, and the actual soil pH,
such that if pHZPC-pH is negative then the surface charge
is negative.32-35
Considering the mineralogical and chemical properties of the soils from Ilha de Terra, it has been suggested that they have a negative charge and that OM is mainly responsible for this development. Quartz, anatase, goethite
and hematite contain a negligible charge.36 The tetrahedral
sheet of kaolinite carries a small permanent negative
charge because of isomorphous substitution of Si4+ by
Al3+, leaving a single negative charge for each substitution.
Both the octahedral sheet and the crystal edges have a dependent variable charge caused by the protonation and deprotonation of surface hydroxyl (SOH) groups. Thus, tetrahedral sites of clay become permanently negatively
charged and allow the electrostatic interaction with positively charged ions. However, this permanent charge is a minor component in kaolinite-type clays. The layer edges where exposed OH groups will exhibit acid-base behavior are primarily responsible for the interaction of kaolinite with environmental metal ions. Crystalline oxide of iron (hematite) is widely distributed in soils and has a surface that is normally hydrated so it can participate in
adsorption reactions similar to those of hydrous. Soil pHZPC
can be altered by adding OM.36 Therefore, the appropriate
manipulation of the soils can lead to an increase in surface
negative charge.32
Geochemical dispersion
The release and retention of OM, Ca, Mg and P in soils with ABE is a dynamic process that is dependent on the pH and mineralogy of the soils and chemistry composition of the soils solution. The variability of these properties in the area Figure 4. Concentrations of organic matter (OM) compared with other chemical properties along the horizons of the ABE soil proile.
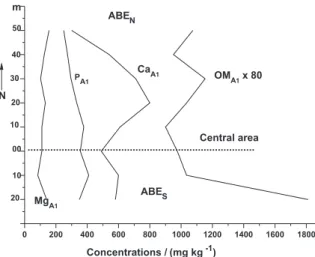
ABE is relected through the concentrations (Tables 2 and 3) and variances (Table 4). OM and Ca are the components of soils that have a higher dispersion in all directions from the ABE area (north, south, central, north-south and east-west). Values of variance indicate that the dispersion of P and Mg are also important but are much lower than those obtained for OM and Ca. The highest concentrations of OM were observed in the southwest and northwest and the lowest in the northeast and southeast of the ABE area. In some places in ABE area, a sharp decrease in the concentrations of Ca
and OM were observed, for example in the central area, north-south and east-west (Figures 6 and 7). It is possible that the spaces in the area with the lowest concentrations of OM and Ca have been used by ancient inhabitants as preferential sites for religious ceremonies, the spaces with highest concentrations of OM and Ca have been used as preferential sites for food preparation and the accumulation of waste and a small area with high concentrations of Ca, Mg and P has been reserved as a cemetery. Many Indian villages have a cleared space in the central area that is kept clean for
Table 2. Chemical properties from soils with archaeological Black earth along N-S area
(N-S) Ph OM / (mg kg-1×10³) Ca / (mg kg-1) Mg / (mg kg-1) P / (mg kg-1)
(m) A1 A2 A1 A2 A1 A2 A1 A2 A1 A2
50 4.44 4.72 86 70 300 200 156 120 250 220
40 4.16 4.38 76 76 540 440 126 120 274 422
35 4.47 4.61 92 76 710 600 102 108 296 392
20 4.52 4.66 83 62 800 540 132 120 333 391
10 4.21 4.44 73 71 610 460 110 96 378 447
0 4.02 4.5 86 80 490 440 110 132 356 435
10 4.03 4.04 83 94 600 600 84 50 410 460
20 4.26 4.45 145 123 580 580 140 70 350 475
Table 3. Chemical properties from soils with archaeological Black earth along W-E area
W-E pH OM / (mg kg-1×10³) Ca / (mg kg-1) Mg / ( mg kg-1) P / (mg kg-1)
(m) A1 A2 A1 A2 A1 A2 A1 A2 A1 A2
40 4.83 4.70 108.0 96.80 1036 620 129 116 541 418
30 4.54 4.55 142.4 108.6 545 420 99 106 521 390
20 4.48 4.51 104.0 107.2 600 389 147 120 533 467
10 4.41 4.42 90.00 87.00 503 340 141 113 484 419
00 4.47 4.30 78.00 70.64 497 356 93 92 525 348
10 4.36 4.41 65.60 58.84 411 289 113 78 423 365
20 4.16 4.47 50.80 75.60 332 230 110 80 380 228
30 4.26 4.41 74.48 69.60 255 320 130 106 358 284
40 4.10 4.28 94.00 93.30 95 274 102 93 367 236
Table 4. Variance of chemical properties from ABE areas north, south, central, north-south and west-east, as ABEN, ABES, ABECENTRAL , ABEN-S and
ABEW-E, respectively
Variance
ABE Area pH OM Ca Mg P
A1 A2 A1 A2 A1 A2 A1 A2 A1 A2
ABEN 128 99 1×10⁹ 381 40254 22690 654 113 2629 1604
ABES 32 7 969 752 2128 25400 12357 10978 9398 12424
ABECENTRAL 13 15 1429 987 156592 7441 1790 2694 10312 26998
ABEN-S 18 20 5×10⁸ 9×10⁸ 22098 18914 528 750 2925 6651
Figure 6. Concentrations of the available P, exchangeable Ca2+ and Mg2+
and OM (multiplied by 80) in north to south of the area {(ABE)N-S}.
Figure 7. Concentrations of the available P, exchangeable Ca2+ and Mg2+
and OM (multiplied by 80) in west-east area {(ABE)W-E}.
Table 5. Correlation matrix of chemical properties from soils with archaeological Black earth from ABE area N-S
(ABE)N: 50N (ABE)N:40N (ABE)N:30N (ABE)N:20N
OM P Ca Mg OM P Ca Mg OM P Ca Mg OM P Ca Mg
OM 1 1 1 1
P 0.2 1 0.3 1 0.01 1 0.01 1
Ca 0.3 0.41 1 0.6 0.5 1 0.01 0.5 1 0.6 0.3 1
Mg 0.3 0.1 0.2 1 0.3 0.3 0.4 1 0.01 0.2 0.6 1 0.5 0.2 0.5 1
(ABE)N: 10N ABN: central (ABE)S: 10S (ABE)S: 20S
OM P Ca Mg OM P Ca Mg OM P Ca Mg OM P Ca Mg
OM 1 1 1 1
P 0.1 1 0.1 1 0.4 1 0.4 1
Ca 0.5 0.4 1 0.6 0.1 1 0.8 0.6 1 0.3 0.2
Mg 0.6 0.2 0.8 1 0.2 0.3 0.5 1 0.3 0.01 0.5 1 0.2 0.01 0.01 1
ceremonial events whereas rubbish is commonly deposited
at the perimeter of the ancient settlement.9
Geochemical correlation
The similarities and differences among the distribution patterns of OM, Ca, P and Mg can be estimated through the correlation coeficients shown in Table 5. The highest correlation coefficients were obtained between pairs OM-Ca and Ca-Mg. However, it has been shown that the interpretation of element concentrations patterns in archaeological soils is problematic because of the complexity of site use history and the effects of post-depositional soil processes. Many human activities can add element loadings to cultivated soils. However, a host of natural and anthropogenic factors can affect total soil concentrations. Background variation linked to differences in soils can result in patterns of element concentration
unconnected to the archaeology.1
Conclusions
The physicochemical properties of the soil proiles ABE and YLS suggested the soils of these proiles belonged to the same class of soil before human occupation. The activities performed by the ancient inhabitants of the region caused changes in the upper horizons of that soil class. This hypothesis is shown in this study through the following data: changing of the yellow color of Latossolos to black, dark brown and light brown because of the presence of black carbon and the accumulation of OM originated from animal and vegetable waste; changing of the soil texture from sandy-clay to sandy because of human settlement, which decreased the concentrations of Al and increased those of Si due to the formation of quartz; lower
concentrations of OM, exchangeable Ca2+ and Mg2+ and
Acknowledgments
This study was made possible by sampling support of the Museu Paraense Emilio Goeldi and inancial support of the Conselho Nacional de Desenvolvimento Cientíico e Tecnológico (CNPq).
References
1. Wilson, C. A.; Davidson, D. A.; Cresser, M. S.; J. Archaeol. Sci.2008, 35, 412.
2. Parnell, J. J.; Terry, R. E.; J. Archaeol. Sci. 2002, 29, 379. 3. Fernandez, F. G.; Terry, R. E.; Inomate, T.; Eberl, M.;
Geoarchaeology2002, 17, 487.
4. Lima, H. N.; Schaefer, C. E. R.; Melo, J. W. V.; Gilkes, R. J.; Ker, J. C.; Geoderma2002, 110, 1.
5. Cunha, T. J. F.; Madari, B. E.; Canellas, L. P.; Ribeiro, L. P.; Benites, V. M.; Santos, G. A.; R. Bras. Ci. Solo2009, 35, 85. 6. Lehmann, J.; Kern, D.; German, L.; Mccann, J.; Martins, G.
C.; Moreira, A. In Amazonian Dark Earths: Origin, Properties, Management; Lehmann, J.; Kern, D. C.; Glaser, B.; Woods, W. I.,eds.; Kluwer Academic Publishers: Boston-London, 2003, ch. 6.
7. Falcão, N. P. S.; Comerford, N.; Lehmann, J. In Amazonian Dark Earths: Origin, Properties, Management; Lehmann, J.; Kern, D. C.; Glaser, B.; Woods, W. I.,eds.; Kluwer Academic Publishers: Boston-London, 2003, ch.14.
8. Novotny, E. H.; Hayes, M. H. B.; Madari, B. E.; Bonagamba, T. J.; Azevedo, E. R.; Souza, A. A.; Song, G.; Nogueira, C. M.; Mangrich, A. S.; J. Braz. Chem. Soc.2009, 20, 1003. 9. Smith, N. J. H.; Annals of the Association of American
Geographers 1980, 70, 553.
10. German, L. A.; Geoderma2003, 111, 307.
11. Woods, W. I.; McCann, J. M. Yearbook Conference of Latin Americanist Geographers, 1999.
12. Woods, W. I.; McCann, J. M.; Meyer, D. W. Schoolmaster, F. A. Papers and Proceedings of the Applied Geography Conferences, 2000.
13. Kern, D. C.; Kämpf, N. R.; R. Bras. Ci. Solo1989, 13, 219. 14. Kämpf, N. R.; Woods, W. I.; Sombroek, W.; Kern, D. C.; Cunha, T.
J. F. In Amazonian Dark Earths: Origin, Properties, Management; Lehmann, J.; Kern, D. C.; Glaser, B.; Woods, W. I.,eds.; Kluwer Academic Publishers: Boston-London, ch. 5 .
15. Haumaier, L.; Zech, W.; Org. Geochem.1995, 23, 191. 16. Glaser, B.; Haumaier, L.; Guggenberg, G.; Zech, W.; Org.
Geochem. 1998, 29, 811.
17. Golchin, A.; Baldock, J. A.; Clarke, P.; Higashi, T.; Oades, J. M.; Geoderma1997, 76, 175.
18. Ribeiro, L. G. L.; Carreira, R. S.; Wagener, A. L. R.; J. Braz. Chem. Soc. 2008, 19,1277.
19. Neves, E. G.; Petersen, J. B.; Bartone, R. N.; Silva, C. A. In
Amazonian Dark Earths: Origin, Properties, Management; Lehmann, J.; Kern, D. C.; Glaser, B.; Woods, W. I.,eds.; Kluwer Academic Publishers: Boston-London, 2003, ch.3.
20. Kern, D. C.; D’aquino, G.; Rodrigues, T. E.; Frazão, F. J.; Sombroek, W.; Myers, T. P.; Neves, E. G. In Amazonian Dark Earths: Origin, Properties, Management; Lehmann, J.; Kern, D. C.; Glaser, B.; Woods, W. I.,eds.; Kluwer Academic Publishers: Boston-London, 2003, ch. 4.
21. Costa, M. L.; Kern, D. C.; J. Geochem. Explor. 1999, 66, 369. 22. Lemos, A.; Santos, P. B.; Manual de Descrição e Coleta de
Solos em Campo; Sociedade Brasileira de Ciência do Solo: Viçosa, Brasil, 2002.
23. Munsell Colors Company; Munsell Soil Colors Charts, Baltimore, 2000.
24. Soil Survey Staff, National Soil Survey Laboratory; Methods Manual: Soil Survey Investigations Report 42, version 4.0; United States Department of Agriculture, Natural Resources Conservation Service, National Soil Survey Center, US Govt print Ofice: Washington, DC, 2004.
25. Shriver, D. F.; Atkins, P. W.; Quimica Inorgânica, Bookman: São Paulo, Brasil, 2008.
26. Stumm, W.; Morgan, J. J.; Aquatic Chemistry. Chemical Equilibria and Rates in Natural Waters, John Wiley & Sons: New York, 1996.
27. Schmidt, M. W. I.; Heike, K. H.; Kögel-Knabner, I.; Org. Geochem. 2000, 31, 727.
28. Glaser, B.; Balashov, E.; Haumaier, L.; Guggenberger, G.; Zech, W.; Org. Geochem.2000, 31, 669.
29. Brodowski, S.; Rodionov, A.; Haumaier, L.; Glaser, B.; Amelung, W.; Org. Geochem.2005b36, 1299.
30. Brodowski, S.; John, B.; Flessa, H.; Amelung, W.; Eur. J. Soil Sci. 2006, 59, 539.
31. Brodowski, S.; Amelung, W.; Haumaier, L.; Zech, W.;
Geoderma2007, 139, 220.
32. Van Ranst, E.; Shamshuddin, J.; Baert, G.; Dzwowa, P. K.; Eur. J. Soil Sci. 1998, 49, 243.
33. Gilman, G. P.; Aust. J. Soil Res. 1985, 23, 643.
34. Gilman, G. P.; Sumpter, E. A.; Aust. J. Soil Res. 1986, 24, 173. 35. Kaiser, K.; Guggenberger, G.; Org. Geochem.2000, 31, 71. 36. Anderson, S. J.; Sposito, G.; Soil Sci. Soc. Am. J.;1991, 55,
1569.
37. Kennedy, J.; Billett, M. F.; Duthie, D.; Fraser, A. R.; Harrison, A. F.; Eur. J. Soil Sci. 1996, 47, 625.