Gamma-ray computed tomography to evaluate changes in the
structure of a clayey soil due to agricultural traffic
Luiz Fernando Pires
Departamento de Física, Setor de Ciências Exatas e Naturais, Universidade Estadual de Ponta Grossa, Av. Carlos Cavalcanti, 4748, 84030-900, Ponta Grossa, Paraná, Brazil. E-mail: [email protected]
ABSTRACT. A first generation gamma-ray computed tomography (CT) equipped with a 137Cs source was used to investigate changes in soil structure due to agricultural
machinery traffic. Core samples with volume of 55 cm3 were collected at the surface
(0-10 cm) of a Brazilian clayey soil. Significant alterations in soil structure occurred after two passages of tractor wheels, with important decreases in soil porosity. CT data allowed a continuous analysis of soil bulk density and also soil porosity distribution for 1.25 and 1.20 mm layers, which cannot be provided by traditional methods commonly used in soil physics.
Keywords:gamma-ray attenuation, soil bulk density, soil porosity, image analysis, soil physics.
RESUMO. Tomografia computadorizada de raios gama para avaliar mudanças na estrutura de um solo argiloso pelo tráfego agrícola. Um tomógrafo computadorizado (TC) de raios gama de primeira geração equipado com fonte radioativa de 137Cs foi usado no estudo de mudanças na estrutura do solo pelo tráfego
de implementos agrícolas. Amostras com volume de 55 cm3 foram coletadas na
superfície (0-10 cm) de um solo argiloso. Alterações significativas na estrutura do solo ocorreram após duas passagens da roda de um trator com importantes diminuições na sua porosidade. Os dados de TC permitiram uma contínua análise das distribuições de densidade do solo e porosidade para camadas de 1,25 e 1,20 mm, o que não pode ser obtido nos métodos tradicionais comumente usados em física do solo.
Palavras-chave: atenuação de raios gama, densidade do solo, porosidade do solo, análise de imagens,
física do solo.
Introduction
Gamma and X-ray computed tomography (CT) is an imaging technique based on the computation of a large number of transmission measurements of gamma or X-photons. These photons are used to reconstruct an image of a cross-section distribution of a physical property of a scanned material from projections taken from a number of different directions (KAK; SLANEY, 1988). CT produces high-quality images of porous materials, such as soil, being an interesting alternative to reliably evaluate changes in soil physical properties due to natural or artificial processes (BEUTLER et al., 2005).
The first studies using CT were carried out in the medical science field, and lately with the success of the technique, it began to be used in other areas of knowledge. In soil science, CT has been used in a broad range of studies allowing measurements of soil porosity (), bulk density (b), and pore size distribution with a good resolution, without interfering with the physical integrity of the sample (BALOGUN; CRUVINEL, 2003; GANTZER; ANDERSON, 2002; PIERRET et al., 2002).
The environmental impact of agricultural machinery traffic on soils presents as main consequences changes in water infiltration and retention due to soil structure modification from compaction (HORN et al., 2003; RADFORD et al., 2000). Soil compaction results in increases in b and reductions in , which occurs when the soil particles are rearranged (forced close together) after the agricultural machinery traffic. Therefore, modifications caused by compaction in b, which is represented by the mass of dry soil by its bulk volume, has important consequences in the physical quality of a soil such as changes in its pore size distribution, root system distribution, water and nutrient transport, and heat transfer.
traffic on its pore system. However, literature concerning the effect of tractor traffic on the structure of tropical soils is scarce.
The objective of this study was to investigate the sensibility of the gamma-ray CT technique as a method for assessing the structural deformations to soils compacted by agricultural machinery traffic and to characterize the soil bulk density and porosity modifications with millimetric resolution.
Material and methods
Experimental area and sampling
The study area is located in the Jaguariúna region in São Paulo State (SE Brazil - 22°25’ S; 46°35’ W; 580 m a.s.l.), which presents average annual rainfall, relative humidity, and air temperature of 1,335 mm per year, 76%, and 21.7°C, respectively. The dry season covers June to August, July being the driest month. During spring-summer, October to March, very high intensity rainfall events are common.
Samples of a clayey soil characterized as Rhodic Ferralsol (450 g kg-1 clay, 25.5 g kg-1 organic matter, 1.05 g cm-3 dry bulk density, 2.65 g cm-3 particle density, 5.8 pH, 73.5 mmol dm-3 CTC), according to FAO classification (FAO, 1998), were collected in a corn (Zea mays) field cultivated every year and in a native mixed forest. Eighteen samples were collected from the soil surface layer (0-10 cm) with steel cylinders (h = 3.0 cm, D = 4.8 cm, V = 55 cm3). Details regarding sampling procedures can be found in Pires et al. (2006).
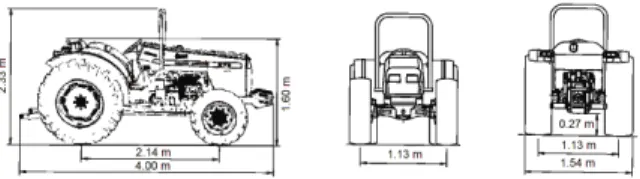
The vehicle utilized for soil preparation was a tractor with rubber tracks (MF 275F) of 2,763 kg of mass with ballast and 56 kW engine power (Figure 1). During management, the experimental area was submitted to none and two-wheel tractor passages on the same track. Twelve samples were collected at the corn field in a randomized block design in areas with none (0P) and two passages of tractor wheels (2P) and six others in a native forest with no traffic and soil management.
Figure 1. Drawing of the tractor (MF 275F) used for soil
management.
CT scanner
The CT scanner used was a first-generation system with a fixed source-detector arrangement and translation/rotational movements of samples
(Figure 2). Gamma-rays (661.6 keV) were emitted by a 7.4 GBq 137Cs radioactive source. Circular lead collimators (1 mm) were adjusted between the source and the detector. A crystal scintillator detector of NaI(Tl) (7.62 x 7.62 cm) coupled to a photomultiplier tube was used to detect the gamma-monoenergetic photons. Samples were rotated over 180° at 2.25° steps; the linear movement steps were 0.14 cm. The voxel size was 1.14 x 1.14 x 1.00 mm3 (as calculated from the ratio of the diameter of the soil sample to the number of pixels of the reconstruction matrix and the diameter of the gamma-ray beam). The acquired data were stored on a PC and the reconstruction algorithm Microvis (2000), developed by Embrapa Agricultural Instrumentation (CNPDIA – São Carlos, Brazil), was used to obtain the CT images. The calibration of the CT scanner was obtained through the correlation between linear attenuation coefficients μ (cm-1) of different homogeneous materials (water, nylon, acrylic, alcohol, aluminum and brass) and their respective tomographic units (TUs) obtained by the image reconstruction program.
Figure 2. Schematic diagram of the first generation gamma-ray computed tomography (CT) scanner.
Image processing and data analysis
CT analyses were performed on all soil samples of the forest region and submitted to none and two-wheel tractor passages. The tomographic images of the soil samples were taken in the vertical planes that included the axes of the cylinders. 2-D maps of TUs allowed a continuous analysis of the soil bulk density variation with depth and its porosity with width.
The b (g cm-3) by CT was calculated by substituting (inclination) of the calibration curve and mass attenuation coefficients m (cm2 g-1) of water (w) and soil (s), respectively, in the Beer-Lambert equation. The following equation was derived to obtain b:
ms w r mw b
. . TU
where: r (cm3 cm-3) is the residual soil water content and w (g cm-3) is the water density. Samples had been air-dried in order to minimize the effect of water inside the soil on the b measurements by CT. The measurement of the soil sample porosity by image (i) was made using the following equation:
100 . 1 (%)
p b
i
(2)
where: p (g cm-3) represents the soil particle density. Details about the method used to measure
p can be found in Flint and Flint (2002).
The increment ratio of density (Гn) was utilized as a compaction criterion (MARSILI et al., 1998) and it was calculated according to:
1 0 n
0 0 n
n
(3)
where: λ0 is the initial b measured for the forest region and λn is the density after none and two-wheel tractor passages.
SAS software (SAS, 1996) was employed for data processing. An analysis of variance (ANOVA) and Duncan test (p < 0.05) were performed to measure statistical differences and to discriminate means.
Results and discussion
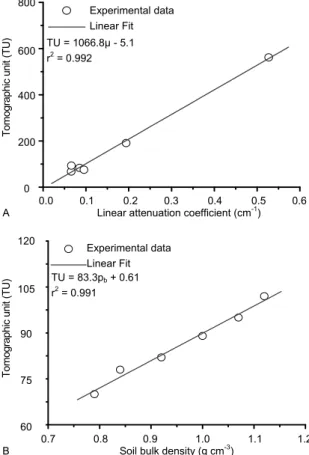
A good linear correlation between the tomographic units and the linear attenuation coefficients of different materials (Figure 3A) was obtained, which is essential to obtain quality CT images (CRESTANA et al., 1985). Soil and water mass attenuation coefficients, for the 661.6 keV photons, were 0.0836 0.0007 and 0.0823 0.0008 cm2 g-1, respectively. TU increases linearly with dry
b (Figure 3B), showing a linear dependence for different soil compaction states and bulk density (VAZ et al., 1989).
From the 2-D images taken through the gamma-ray CT, it is possible to observe the changes in soil structure induced by the machinery traffic (Figure 4). Figure 4A presents the soil sample not submitted to passages of tractor wheels, showing the existence of several areas of lower density (white areas) and compacted regions (black areas) next to the edges, which represent the photon attenuation by the steel cylinder. However, a very compacted portion can be observed near the lower sample surface.
T
o
mographic
unit
(T
U)
800
600
400
200
0
Experimental data Linear Fit
TU = 1066.8 - 5.1 r2 = 0.992
0.0 0.1 0.2 0.3 0.4 0.5 0.6 A Linear attenuation coefficient (cm-1
)
T
o
mographic
unit
(T
U)
120
105
90
75
60
Experimental data Linear Fit
TU = 89.3b+ 0.61 r2 = 0.991
0.7 0.8 0.9 1.0 1.1 1.2 B Soil bulk density (g cm-3)
Figure 3. (A) Calibration curve between the tomographic units
(TUs) and linear attenuation coefficients () of different materials for 137Cs gamma-photons and (B) TUs versus soil bulk
density (b) of samples with different compaction states.
In Figure 4B, one can see a great increase in regions of higher b inside the soil sample, which represents a direct result of the two-wheel (2P) tractor passages. As these effects appear to cover almost the entire sample, it is likely that this tropical clayey soil is very susceptible to great changes in its soil pore system after agricultural machinery traffic. According to Pagliai et al. (2003), important damages can be induced in soil structure after passages of rubber tracked tractors, due mainly to the reduction of elongated pores following the same trend of total porosity.
However, it is not possible to analyze changes in the shape of soil pores through images of millimetric resolution, as obtained in this study. This type of analysis can only be made by using CT systems with micrometric resolution (VAN GEET et al., 2003).
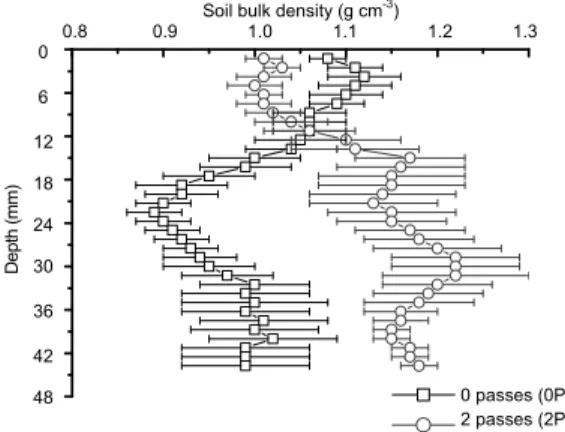
Soil bulk density variations before (0P) and after (2P) tractor wheel traffic are shown in Figure 5. It is possible to observe up to about 10 mm in depth a more dense area for the sample 0P than 2P, which can be explained by the presence of surface crusting for 0P (PIRES et al., 2007). Samples not submitted
Experimental data Linear Fit TU = 1066.8µ - 5.1 r2
= 0.992
Experimental data Linear Fit TU = 83.3pb + 0.61 r2
to tractor wheel traffic were collected exactly at the soil surface and it was not necessary to trim off the top surface.
b (g cm -3
)
Figure 4. 2-D tomographic images of core samples used for evaluating the effect of passages of tractor wheels on the structure of a Brazilian clayey soil. (A) Sample not submitted to passages of tractor wheels, and (B) sample submitted to two-wheel tractor passages. The scale represents the soil bulk density (b) distribution.
However, those submitted to machinery traffic were collected in a 3 to 7 cm deep layer, being the excessive soil carefully trimmed off and top and bottom surfaces of samples made flat. Below 10 mm in depth, a significant increase in b can be observed after 2P when compared to 0P (Table 1). The b increment ratio for 0P and 2P in relation to samples collected in the native forest shows a difference of 14% between these two treatments. The increment ratio of density (Гn) parameters obtained in this study are higher than those measured by Marsili et al. (1998) also comparing 0P and 2P (Гn=0.13).
Table 1. Mean values of soil bulk density (ρb), standard
deviations (σρb), coefficient of variation (CV), and its increment
ratio (Гn) for soil submitted to 0 and 2 passages of tractor wheels.
Treatments ρb (g cm
-3) σρ
b (g cm
-3) CV (%) Г
n
0 passes (0P) 1.00 b 0.06 6.3 0.08
2 passes (2P) 1.13 a 0.07 6.2 0.22
Forest (F) 0.92 b 0.03 2.9 -
Standard deviation represents the scatter of six ρb values for each treatment; Letters
represent subsets of mean ρb values that are statistically identical according to the
Duncan test (p < 0.05).
Through the analysis of b profiles and Гn, it is possible to obtain a better comprehension of the soil structure damages from traffic and to measure density values for layers of 1.25 mm, which cannot be provided by traditional techniques of analysis in a non-destructive way.
The increase in b after passages of tractor wheels can be explained by macropore decreases (MARSILI et al., 1998; PAGLIAI et al., 2003), once soil volume is reduced during soil surface load application by heavy vehicle traffic (Figure 6). This compaction
effect can be worsened after several passages of tractor wheels (HORN et al., 2003; PAGLIAI et al., 1998). Richards et al. (2001) observed that the structure of compacted ploughed layers is massive with very few visible pores, whereas the uncompacted ploughed layers has fragmented structure with distinct aggregates and clods. A normal distribution of i evaluated by image analysis can be observed before tractor wheel traffic, with the highest concentration of porosity values ranging from 62 to 68%. After two-wheel tractor passages, the i distribution changes greatly with a significant reduction in the number of high porosity values found in the matrix of TU, which can be probably explained by the decrease in the amount of large pores inside the samples. The highest concentration of i values for 2P ranged from 44 to 50%. Horn et al. (2003) showed that the pore size distribution after machinery traffic is changed to smaller diameters with a reduction of inter-aggregate pores, while single aggregates remain stable.
Soil bulk density (g cm-3)
0.8 0.9 1.0 1.1 1.2 1.3
D e pth (mm) 0 6 12 18 24 30 36 42
48 0 passes (0P)
2 passes (2P)
Figure 5. Soil bulk density (b) variations along depth for core
samples not submitted and submitted to two-wheel tractor passages. Errors bars are 95% confidence intervals.
F req uen cy 0 50 100 150 200 250 300 350 400 38-41 41-44 44-47 47-50 50-53 53-56 56-59 59-62 62-65 65-68 68-71 71-74 74-77 77-80 80-83 83-86 86-89 89-92 92-95 95-98
0 passes (0P) 2 passes (2P)
Soil porosity by image (%)
Figure 6. Changes in the soil porosity by image (i) for core samples
not submitted and submitted to two-wheel tractor passages. The frequency represents the number of points added in the matrix of soil bulk density (b) used to reconstruct the 2-D tomographic images.
Table 2 presents data of soil porosity by image variation between samples before (0P) and after (2P) tractor’s wheel traffic. These i were obtained by using CT data (Equation 2) and represent values of TU for one selected line of the matrix of TU data. The results show that i suffers important changes (decreases) after machinery traffic confirming the qualitative analysis of soil structure damages observed in Figure 4. These damages are mainly related to decreases in soil macropores, which in clayey soils affect the hydraulic conductivity and root development that are closely associated with the macropores configuration (PAGLIAI et al., 2003; PERRET et al., 1999).
Table 2. Mean values of soil porosity by image (i) obtained by
the computed tomography (CT) method and the relative error (%RE) between values of i for samples submitted to 0 and 2
passages of tractor wheels.
Layer* 1 2 3 4 5 6 7 8 9 10
0 passes (0P) 61.4 61.0 60.2 64.9 64.3 61.9 66.4 65.7 59.9 55.9
2 passes (2P) 50.2 55.0 53.2 42.0 45.6 48.2 44.3 50.4 63.2 60.7
%RE ** 18.2 9.8 11.7 35.2 29.1 22.1 33.3 23.2 5.5 8.6
*Each layer (4.8 mm) represents mean values of soil porosity by image (i) obtained by
the sum of 4 layers of 1.2 mm each; **The analysis of i variation was not performed at
the same samples. The relative error was obtained by using the following equation:
100 . ) ( RE
% i0Pi2P i0P
.
Conclusion
Computed tomography (CT) data analysis showed that machinery traffic has negatively affected the structural state of a Brazilian clayey soil caused by an increase of soil bulk density with depth for samples collected at the soil surface. Using CT, it was possible to measure average densities for thin soil layers allowing a better characterization of soil structure modification by machinery traffic. It was also possible by using CT data to obtain a soil porosity distribution by image before and after passages of tractor wheels. The data show that the total soil porosity by image is greatly affected after two passages of tractor wheels by a reduction of the percentage of macropores.
Acknowledgements
The author is thankful to Dr. Osny O. S. Bacchi and Dr. Klaus Reichardt of the Laboratory of Soil Physics of the Center for Nuclear Energy in Agriculture for the discussions regarding the gamma computed tomography method and to the Conselho Nacional de Desenvolvimento Científico e Tecnológico (CNPq) for PQ grant.
References
BALOGUN, F. A.; CRUVINEL, P. E. Compton scattering tomography in soil compaction study. Nuclear
Instruments and Methods in Physics Research A, v. 505, n. 1-2, p. 502-507, 2003.
BEUTLER, A. N.; CENTURION, J. F.; FREDDI, O. S.; ANDRIOLI, I. Efeito da compactação do solo na estabilidade de agregados e no conteúdo gravimétrico de água. Acta Scientiarum. Agronomy, v. 27, n. 2, p. 193-198, 2005.
CRESTANA, S.; MASCARENHAS, S.; POZZI-MUCELLI, R. S. Static and dynamic three-dimensional studies of water in soil using computed tomographic scanning. Soil Science, v. 140, n. 5, p. 326-332, 1985. FAO-Food and Agriculture Organization. World reference base for soil resources. Rome, 1998.
FLINT, A. L.; FLINT, L. E. The solid phase: Particle density. In: DANE, J. H.; TOPP, G. C. (Ed.). Methods of soil analysis: part 4. Physical methods. Madison: Soil Science Society of America Book Series, 2002. p. 229-240. GANTZER, C. J.; ANDERSON, S. H. Computed tomographic measurement of macroporosity in chisel-disk and no-tillage seedbeds. Soil and Tillage Research, v. 64, n. 1-2, p. 101-111, 2002.
HORN, R.; WAY, T.; ROSTEK, J. Effect of repeated tractor wheeling on stress/strain properties and consequences on physical properties in structured arable soils. Soil and Tillage Research, v. 73, n. 1-2, p. 101-106, 2003.
KAK, A. C.; SLANEY, M. Principles of computerized tomographic imaging. New York: IEEE Press, 1988. MARSILI, A.; SERVADIO, P.; PAGLIAI, M.; VIGNOZZI, N. Changes of some physical properties of a clay soil following passage of rubber- and metal-tracked tractors. Soil and Tillage Research, v. 49, n. 3, p. 185-199, 1998.
MICROVIS. Programa de reconstrução e visualização de imagens tomográficas. São Carlos: Embrapa-CNPDIA, 2000. (Guia do usuário).
PAGLIAI, M.; MARSILI, A.; SERVADIO, P.; VIGNOZZI, N.; PELLEGRINI, S. Changes in some physical properties of a clay soil in central Italy following the passage of rubber tracked and wheeled tractors of medium power. Soil and Tillage Research, v. 73, n. 1-2, p. 119-129, 2003.
PAGLIAI, M.; ROUSSEVA, S.; VIGNOZZI, N.; PIOVANELLI, C.; PELLEGRINI, S.; MICLAUS, N. Tillage impact on soil quality. I. Soil porosity and related physical properties. Italian Journal of Agronomy, v. 2, n. 1, p. 11-20, 1998.
PERRET, J.; PRASHER, S. O.; KANTZAS, A.; LANGFORD, C. Three-dimensional quantification of macropore networks in undisturbed soil cores. Soil Science Society of America Journal, v. 63, n. 6, p. 1530-1543, 1999.
PIRES, L. F.; BACCHI, O. O. S.; REICHARDT, K.; DIAS, N. M. P. Gamma-ray computed tomography as a tool to evaluate porosity changes along depth for surface crusted soils. Nukleonika, v. 52, n. 3, p. 125-131, 2007. RADFORD, B. J.; BRIDGE, B. J.; DAVIS, R. J. Changes in the properties of a Vertisol and responses of wheat after compaction with harvester traffic. Soil and Tillage Research, v. 54, n. 3-4, p. 155-170, 2000.
RICHARDS, G.; COUSIN, I.; SILLON, J. F.; BRUAND, A.; GUÉRIF, J. Effect of compaction on the porosity of a silty soil: influence on unsaturated hydraulic properties. European Journal of Soil Science, v. 52, n. 1, p. 49-58, 2001. SAS-Statistical Analisys System. System for information. Cary: SAS Institute Inc., 1996.
VAN GEET, M.; LAGROU, D.; SWENNEN, R. Porosity measurements of sedimentary rocks by means of microfocus X-ray computed tomography (μCT). In:
MEES, F.; SWENNEN, R.; VAN GEET, M.; JACOBS, P. (Ed.). Applications of X-ray computed tomography in the geosciences. London: Geological Society, 2003. p. 51-60.
VAZ, C. M. P.; CRESTANA, S.; MASCARENHAS, S.; CRUVINEL, P. E.; REICHARDT, K.; STOLF, R. Computed tomography miniscanner for studying tillage induced soil compaction. Soil Technology, v. 2, n. 3, p. 313-321, 1989.
Received on August 8, 2008. Accepted on April 22, 2009.