http://dx.doi.org/10.1590/1413-70542018421005217
Soil compaction during harvest operations in five tropical soils with
different textures
under eucalyptus forests
Compactação do solo durante as operações de colheita em cinco solos tropicais de diferentes texturas sob florestas de eucalipto
Paula Cristina Caruana Martins1*, Moacir de Souza Dias Junior1, Ayodele Ebenezer Ajayi2, Ernesto Norio Takahashi3, Diego Tassinari1
1Universidade Federal de Lavras/UFLA, Departamento de Ciência do solo/DCS, Lavras, MG, Brasil 2Federal University of Technology, Akure, Ondo State, Nigeria
3Fibria, Tecnology Center, Três Lagoas, MS, Brasil *Corresponding author: [email protected]
Received in March 20, 2017 and approved in August 18, 2017
ABSTRACT
Traffic of farm machinery during harvest and logging operations has been identified as the main source of soil structure degradation in forestry activity. Soil susceptibility to compaction and the amount of compaction caused by each forest harvest operation differs according to a number of factors (such as soil strength, soil texture, kind of equipment, traffic intensity, among many others), what requires the adequate assessment of soil compaction under different traffic conditions. The objectives of this study were to determine the susceptibility to compaction of five soil classes with different textures under eucalyptus forests based on their load bearing capacity models; and to determine, from these models and the precompression stresses obtained after harvest operations, the effect of traffic intensity with different equipment in the occurrence of soil compaction. Undisturbed soil samples were collected before and after harvest operations, being then subjected to uniaxial compression tests to determine their precompression stress. The coarse-textured soils were less resistant and endured greater soil compaction. In the clayey LVd2, traffic intensity below four Forwarder passes limited compaction to a third of the samples, whereas in the sandy loam PVd all samples from the 0-3 cm layer were compacted regardless of traffic intensity. The Feller Buncher and the Clambunk presented a high potential to cause soil compaction even with only one or two passes. The use of soil load bearing capacity models and precompression stress determined after harvest and logging operations allowed insight into the soil compaction process in forestry soils. Index terms: Harvester; forwarder; feller buncher; clambunk; precompression stress.
RESUMO
O tráfego de máquinas durante as operações de colheita e baldeio da madeira tem sido identificado como a principal fonte de degradação da estrutura do solo no sistema de produção florestal. A suscetibilidade à compactação e a compactação causada por cada operação de colheita florestal diferem de acordo com inúmeros fatores (como resistência mecânica do solo, textura, tipo de equipamento, intensidade de tráfego, entre muitos outros), o que demanda a adequada avaliação da compactação do solo sob diferentes condições de tráfego. Os objetivos deste estudo foram determinar a suscetibilidade à compactação de cinco classes de solo com diferentes texturas sob florestas de eucalipto através de seus modelos de capacidade de suporte de carga; e determinar, com o uso destes modelos e da pressão de pré-consolidação obtida após as operações de colheita florestal o efeito da intensidade de tráfego com diferentes maquinários na ocorrência de compactação do solo. Amostras indeformadas foram coletadas antes e após as operações de colheita florestal, sendo então submetidas a ensaios de compressão uniaxial para determinação das pressões de pré-consolidação. Os solos de textura mais grosseira sofreram maior compactação. No LVd2 argiloso, a intensidade de tráfego de até quatro passadas do Forwarder limitou a ocorrência de compactação a um terço das amostras, enquanto no PVd franco-arenoso todas as amostras na camada de 0-3 cm foram compactadas independente da intensidade de tráfego. O Feller Buncher e o Clambunk apresentaram alto potencial de provocar compactação do solo mesmo com apenas uma ou duas passadas. O uso dos modelos de capacidade de suporte de carga e da pressão de pré-consolidação após as operações de colheita e baldeio permitiram melhor compreensão do processo de compactação em solos florestais. Termos para indexação: Harvester; forwarder; feller buncher; clambunk; pressão de pré-consolidação.
INTRODUCTION
Brazil is the fifth largest exporter of wood pulp in the world and currently ranks fifteenth in paper and cardboard exports. These increases in exports has been associated with an expansion of eucalyptus
in the early 90’s (Sampietro; Lopes, 2011). This rapid and usually full-scale mechanization of forest harvesting has accelerated the rate of soil structure deterioration in planted forests due to the increase traffic intensity (Sampietro; Lopes, 2011; Silva et al., 2011). This could hamper the long-term productivity of forest soils and may constitute a major limitation to sustainable forest development, if machinery traffic is not properly managed (Silva et al., 2011).
Soil compaction by harvesting equipment may deteriorate the root environment due to changes in soil pore structure and increased penetration resistance (Ampoorter et al., 2010; Silva et al., 2011). Soil compaction during forest harvesting affects the soil physical fertility by impeding the storage and supply of water and nutrients while decreasing infiltration and water holding capacity, thereby reducing fertilization efficiency and consequently crop yield (Ajayi et al., 2013). The key factors in assessing the impact of harvesting operations on soil quality include an evaluation of the magnitude of soil compaction due to machinery traffic, and the effect of traffic intensity of the equipment used in wood transport (Ampoorter et al., 2010; Silva et al., 2011).
The susceptibility of soils to compaction and the extent of soil compaction can be evaluated with different properties of the soil, such as bulk density, porosity, penetration resistance, hydraulic conductivity (Ampoorter et al., 2010; Silva et al., 2011; Moreira et al., 2012; Braga et al., 2013; Lopes et al., 2015; Silva et al., 2016), and more recently, the precompression stress (Araujo-Junior et al., 2011; Figueiredo et al., 2011; Pacheco; Cantalice, 2011; Ajayi et al., 2013). Precompression stress is generally considered as (a) an indicator of the soil mechanical strength (Ajayi et al., 2013); (b) the maximum pressure that should be applied to the soil to prevent compaction (Severiano et al., 2010; Araujo-Junior et al., 2011), and (c) the required pressure by the root system to enable the root elongation (Iori et al., 2013). The use of precompression stress as an indicator of soil structure sustainability is based on the fact that it divides the soil compression curve into regions of elastic (recoverable) deformations and plastic (non-recoverable) deformations (Oliveira et al., 2011; Vasconcelos et al., 2012; Iori et al., 2013).
Therefore, to minimize the risk of compaction in forest soils, traffic planning for harvesting and transport of harvested wood must be done with due consideration of the precompression stress (Pacheco; Cantalice, 2011; Silva et al., 2011). It is also important to understand the dynamics of the soil compaction
process in relation to the traffic intensity of the harvest and logging equipment. We hypothesized that the soil strength would vary according to the soil class and horizon due to differences in soil attributes, such as texture; and these differences would influence the pattern of soil compaction according to the equipment used. Therefore, the objectives of this study were to determine the susceptibility to the compaction of five soil classes with different textures under eucalyptus forests based on their load bearing capacity models; and to determine, from these models and the precompression stresses obtained after harvest operations, the effect of traffic intensity with different equipment in the occurrence of soil compaction.
MATERIAL AND METHODS
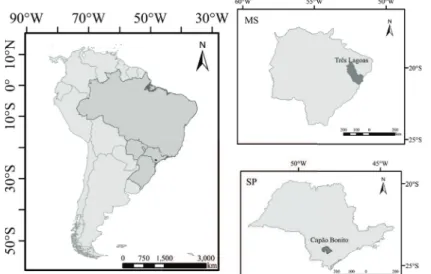
This study was carried out in commercial forest belonging to FIBRIA, in Capão Bonito, SP, and Três Lagoas, MS (Figure 1). The sites were chosen because of the distinct differences in the soil classes at both sites. Whereas soils at Capão Bonito, SP, are more clayey, those from Três Lagoas, MS, are coarse-textured. The climate in Capão Bonito County (average altitude of 705 m) according to Köppen classification is Cfb, sub-temperate with an average temperature of 21 °C and total annual rainfall of 1,285 mm. In Três Lagoas county (average altitude of 370 m) the climate is tropical hot and humid (Aw according to Köppen classification), with an average temperature of 26 °C and total annual rainfall between 900 mm and 1,400 mm. In both sites, the eucalyptus forests are planted for cellulose production.
In Capão Bonito the soils were classified as typic dystrophic Red Latosol (Oxisol) (LVd1 and LVd2), with
moderate A horizon and gently and wavy slope; and dystrophic Red Argisol (Ultisol) (PVd) with moderate
A horizon, and gentle slope (Santos et al., 2013). In Três Lagoas the soils were classified as typic dystrophic Latosol (Oxisol) (LVd3) with moderate A horizon and
nearly-level slope; and dystrophic Red Latosol (Oxisol)
(LVd4), with moderate A horizon and nearly-level slope (Santos et al., 2013).
According to the manufacturer’s manual or information provided by equipment support and maintenance engineers, the mass and pressures applied by each equipment used in the harvest operations are as follows: Feller Buncher (John Deere model 930k with tracks) with a mass of 27,180 kg and applied pressure of 59 kPa; Harvester (John Deere model excavator 200DLC) with a mass of 26,000 kg and applied pressure of 47.7 kPa; Forwarder (Valmet-Komatsu 890.3, 6 x 8 tires with removable mats for use in rainy/ slope situations) with a loaded mass of 37,100 kg and applied pressure not reported by the manufacturer; and Clambunk (Valmet-Komatsu 890.3 6x8, adapted Forwarder), with an empty mass of 18,000 kg and applied pressure not reported by the manufacturer. The values of applied pressure by the Forwarder varied from 92.6 to 152 kPa (Fernandes; Souza, 2003; Dias Junior et al., 2005), and by the Clambunk they vary from 26.67 to 60 kPa (Dias Junior et al., 2005, Fernandes et al., 2008). This experimental design for this study was according to the actual fi eld operations of the company in terms of equipment used, harvesting strategy, and traffi c intensity.
Soil sampling in this study was done in two stages: before and after harvest operations. In both instances, the samples were collected in the various soil classes at two layers, 0-3 cm and 10-13 cm, which were chosen after a manual investigation of the soil profi les with a knife, as the soil layers with highest
mechanical resistance. Samples were collected with and Uhland sampler, wrapped in plastic fi lm, and covered with paraffi n wax in the fi eld to maintain structure and moisture. The trimmed soil from the core samples was used to determine texture (Gee; Bauder, 1986) and particle density (Blake; Hartge, 1986a) (Table 1).
The samples collected before harvest operations (15 undisturbed soil samples collected in 6.4 cm x 2.54 cm cylindrical rings for each soil class and layer, resulting in 150 samples) were used to characterize the load bearing capacity (LBC) of each soil class and layer. The samples were saturated by capillarity for at least 24 hours, air dried in the laboratory until the desired volumetric moisture (ranging from 0 to 0.50 m3 m-3) were
attained, and then submitted to uniaxial compression tests (Bowles, 1986). Water content was determined after oven-drying (Gardner, 1986) and bulk density was determined according to Blake and Hartge (1986b).
For the uniaxial compression tests, the undisturbed soil samples were kept within the coring cylinders, which were placed into the compression cell, and then submitted to pressures steps of 25, 50, 100, 200, 400, 800 and 1600 kPa (Bowles, 1986), using electronic-pneumatic consolidometers (Durham Geo Slope® Model S-450
Terraload). Each pressure step was applied until 90% of the maximum deformation was reached, determined by the square-root of the time method (Taylor, 1948), and then the pressure was increased to the next level without any stress relief between the steps.
Figure 1: South America political map, highlighting Brazil and depicting the state boundaries for Mato Grosso do
The applied pressure versus deformation data was used to construct the soil compression curves, from which the precompression stress (sp) were determined following the procedure from Dias Junior and Pierce (1995). The precompression stress values were then plotted against the soil water content, and a regression curve was fitted using the equation sp = 10(a +bq) (Araujo Junior et al., 2011; Iori
et al., 2013), which is the load bearing capacity model of each soil. It represents an adjustment of precompression stress to varying water contents. The regression analyses were accomplished using the Sigma Plot® software (Jandel
Scientific, San Rafael, CA, USA). For each model, the 95% confidence intervals of the population were obtained and were used to evaluate the compaction induced by forest harvest operations as explained later.
Homogeneity of the variances of the load bearing capacity models was tested using the Snedecor and Cochran (1989) procedure. The exponential models sp
= 10(a +bq) were transformed to the linear models log (s p)
= a +bq. The homogeneity test for linear models first compares the residual variances of two models, and if these variances are homogeneous by the F test, then the
linear “a” and the angular “b” coefficients are compared.
If the linear and angular coefficients are not significantly different by the F test, the precompression stress and volumetric water content data from both models are pooled together and a new equation is then adjusted to these values. However, if the linear “a” and/or the angular
“b” coefficients are significantly different; the data are
kept apart in each initial model.
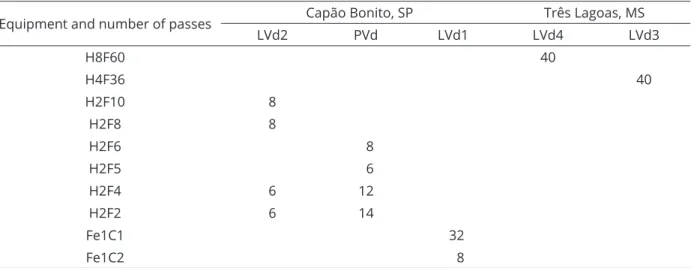
To evaluate the impact of the traffic intensity from the different equipment during the harvest and
logging operations, soil samples were collected randomly in the traffic lines of both the harvest (Harvester and Feller Buncher) and logging equipment (Clambunk and Forwarder) at the soil 0-3 cm and 10-13 cm layers, as shown in the Table 2. These samples (total of 188) were collected in a similar way to those collected before harvesting. All these samples were also subjected to uniaxial compression tests, and the precompression stress was determined following the same procedure described earlier, but the water content of these samples was that of the field moisture during traffic.
To estimate the extent of compaction by the equipment, the precompression stress values determined after operations at their respective volumetric water content were plotted in the load bearing capacity models (generated from the samples collected before harvest operation). The percentage of compacted samples was then determined according to the criteria proposed by Dias Junior et al. (2005).
According to these criteria, the 95% confidence interval of the population divides the load-bearing capacity model into three regions: a) above the upper limit of the confidence interval, in which samples are assumed to have experienced additional soil compaction; b) within the boundaries of the 95% confidence interval, indicating that the samples have yet been compacted, but have the tendency to become compacted in subsequent loadings if the applied pressures are greater than the precompression stress from the upper limit of the confidence interval; and c) where the precompression stress values determined after traffic are lower than the lower limit of the confidence interval, which is considered as a region without compaction.
Table 1: Physical characteristics and textural classes for the soil classes of the studied sites.
ρp: particle density; Sa. Cl. Lo.: Sandy Clay Loam; Sa. Lo.: Sandy Loam; Lo. Sa.: Loamy Sand. Mean values of three repetitions.
Soil class ρp
Mg m-3
Clay Silt Sand ρ
p
Mg m-3
Clay Silt Sand
Textural class
g kg-1 g kg-1
Capão Bonito, SP
0-3 cm 10-13 cm
LVd1 2.66 277 87 636 2.66 313 77 610 Sa. Cl. Lo. LVd2 2.51 507 237 256 2.62 513 227 260 Clay
PVd 2.59 180 273 547 2.68 190 250 560 Sa. Lo. Três Lagoas, MS
0-3 cm 10-13 cm
LVd3 2.68 143 37 820 2.71 163 40 797 Lo. Sa.
RESULTS AND DISCUSSION
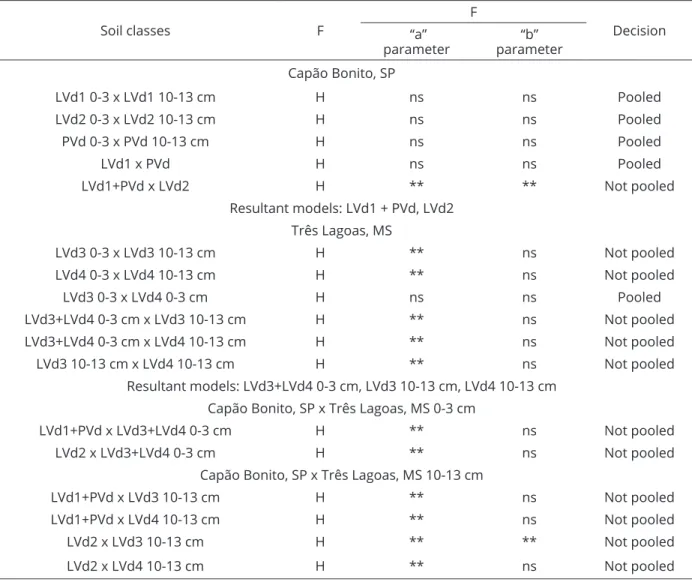
The LBC models for the soils from Capão Bonito (LVd1, LVd2 and PVd) did not show any significant differences between the 0-3 cm and the 10-13 cm layers (Table 3). For these soils, the data from both layers were merged into a single model for each soil class. These soils presented moderate A horizons and both sampling depths could be located within the same horizon, what could explain the lack of significant differences between the sampled layers. The more coarse-textured soils from Capão Bonito (LVd1 and PVd) did not differ from each other, and were pooled together in a single model, which was significantly different from the clayey LVd2. In Três Lagoas, the models from the 0-3 cm layer differed from those at the 10-13 cm layer, and were therefore kept apart. The two soil classes did not differ in the 0-3 cm layer, and they were merged into a single model, whereas in the 10-13 cm layer they were significantly different and were therefore not pooled together.
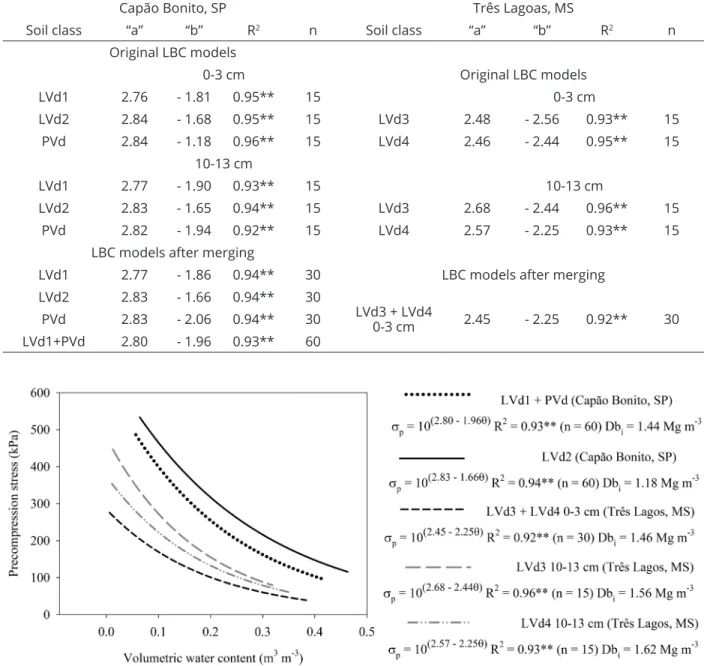
The coefficients of determination for the LBC models ranged between 0.92 and 0.96 (Table 4). The
“a” and “b” regression adjustment parameters varied,
respectively, from 2.45 to 2.84 and from -1.18 to -2.56 in the 0-3 cm layer; and in the 10-13 cm from 2.57 to 2.83 and from -1.65 to -2.44. The “a” parameter values were
somewhat higher in the soil classes from Capão Bonito, while the “b” parameter was always higher (in absolute
values) in the soil classes from Três Lagoas. A higher
“a” parameter indicates a higher precompression stress,
especially when the soil is dry, being higher in the soils
with higher clay contents. This is in accordance with the general behavior of clay, which undergoes considerable strengthening of the particle to particle bonds when dry (Ajayi et al., 2010; Ajayi et al., 2013).
The more sandy soils from Três Lagoas had higher absolute values for the “b” parameter (Table 4). These
higher values could be related to the usually lower water contents reached in the LBC models for these soils (always below 0.4 g g-1, whereas the others soil often reached higher
threshold, as can be seen in Figure 2). As a consequence, this equation parameter had to reach higher values during regression adjustment, so lower values of precompression stress could be obtained (the curves for the soils from Três Lagoas, MS, were always below those from Capão Bonito, SP, in the LBC models graph, as can be seen in Figure 2).
The three soil classes from Capão Bonito, SP (LVd1, LVd2, and PVd) were more resistant to compaction when compared to the two soil classes (LVd3, LVd4) from Três Lagoas, MS (Figure 2). This is most likely due to the higher contents of clay in samples from Capão Bonito when compared to those from Três Lagoas. The soil classes from Três Lagoas has single grain structure, with little cohesion between particles, while those from Capão Bonito has sub-angular blocky structure, which promote higher load bearing capacity because of higher interparticle cohesion (Oliveira et al., 2011; Sampietro; Lopes, 2016). Ampoorter et al. (2007) and Andrade et al. (2017) also observed higher compaction in soils with higher sand contents after harvesting and logging operations in forest soils. Severiano Equipment and number of passes Capão Bonito, SP Três Lagoas, MS
LVd2 PVd LVd1 LVd4 LVd3
H8F60 40
H4F36 40
H2F10 8
H2F8 8
H2F6 8
H2F5 6
H2F4 6 12
H2F2 6 14
Fe1C1 32
Fe1C2 8
H = Harvester; F = Forwarder, Fe = Feller Buncher, C = Clambunk. The numbers after the letters H, F, Fe and C indicate the
number of passes of the equipment.
Table 2: Number of undisturbed soil samples collected in each soil class from the studied sites after harvest and
et al. (2013), studying soils from the Brazilian Cerrado region, found higher load bearing capacity for the more coarse-textured soils, but this trend may only be valid for soils of oxidic mineralogy with predominance of gibbsite. In a more comprehensive study comparing Oxisols of varying mineralogy Ajayi and Dias Junior (2012) also state that the more clayey soils had higher mechanical strength, in agreement with our findings.
Soil compaction in the LVd2 after traffic with the Harvester and the Forwarder is presented in the LBC models (Figure 2). The soil class which is more resistant to compaction had fewer compacted samples than the least
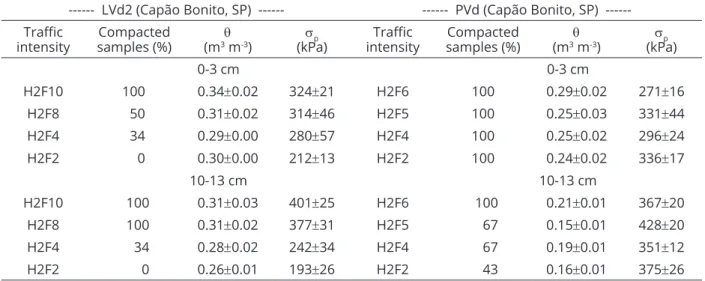
resistant (PVd), especially in the 0-3 cm layer (Table 5). In the PVd, all samples were compacted in the 0-3 cm layer even with the lowest traffic intensity, whereas in the 10-13 cm layer soil compaction was more severe from four Forwarder passes on (67% of compacted samples, Table 5). Higher compaction after forestry equipment traffic is usually reported in the most superficial soil depths (Sampietro; Lopes; 2011; Lopes et al., 2015; Andrade et al., 2017) and the logging of harvested wood with Forwarder was identified by Silva et al. (2011), Lopes et al. (2015) and Andrade et al. (2017) as the operation that caused the most severe soil compaction during forest harvesting.
Soil classes F
F
Decision “a”
parameter
“b” parameter
Capão Bonito, SP
LVd1 0-3 x LVd1 10-13 cm H ns ns Pooled
LVd2 0-3 x LVd2 10-13 cm H ns ns Pooled
PVd 0-3 x PVd 10-13 cm H ns ns Pooled
LVd1 x PVd H ns ns Pooled
LVd1+PVd x LVd2 H ** ** Not pooled
Resultant models: LVd1 + PVd, LVd2 Três Lagoas, MS
LVd3 0-3 x LVd3 10-13 cm H ** ns Not pooled LVd4 0-3 x LVd4 10-13 cm H ** ns Not pooled
LVd3 0-3 x LVd4 0-3 cm H ns ns Pooled
LVd3+LVd4 0-3 cm x LVd3 10-13 cm H ** ns Not pooled LVd3+LVd4 0-3 cm x LVd4 10-13 cm H ** ns Not pooled LVd3 10-13 cm x LVd4 10-13 cm H ** ns Not pooled
Resultant models: LVd3+LVd4 0-3 cm, LVd3 10-13 cm, LVd4 10-13 cm
Capão Bonito, SP x Três Lagoas, MS 0-3 cm
LVd1+PVd x LVd3+LVd4 0-3 cm H ** ns Not pooled LVd2 x LVd3+LVd4 0-3 cm H ** ns Not pooled
Capão Bonito, SP x Três Lagoas, MS 10-13 cm
LVd1+PVd x LVd3 10-13 cm H ** ns Not pooled LVd1+PVd x LVd4 10-13 cm H ** ns Not pooled
LVd2 x LVd3 10-13 cm H ** ** Not pooled
LVd2 x LVd4 10-13 cm H ** ns Not pooled
Table 3: Comparison of the load-bearing capacity models (sp = 10(a +bq)) according to the procedure described in Snedecor and Cochran (1989).
In the LVd2, soil compaction was more pronounced from the eighth Forwarder passes, although after four passes about a third of the samples had some degree of additional compaction. In a study with two coarse-textured Ultisols, Dias Junior et al. (2008) concluded that eight Forwarder passes could be adopted as a critical
limit for traffic intensity with this equipment to prevent severe soil compaction. Although this recommendation would be adequate for the LVd2, it would fail to prevent compaction in the PVd. This reinforces the need to couple mechanized operations with knowledge of soil load bearing capacity, in order to properly avoid additional
Figure 2: Load bearing capacity models of the soil classes from Capão Bonito, SP, and Três Lagoas, MS. Bbi: initial
bulk density.
Capão Bonito, SP Três Lagoas, MS
Soil class “a” “b” R2 n Soil class “a” “b” R2 n
Original LBC models
0-3 cm Original LBC models
LVd1 2.76 - 1.81 0.95** 15 0-3 cm
LVd2 2.84 - 1.68 0.95** 15 LVd3 2.48 - 2.56 0.93** 15 PVd 2.84 - 1.18 0.96** 15 LVd4 2.46 - 2.44 0.95** 15
10-13 cm
LVd1 2.77 - 1.90 0.93** 15 10-13 cm
LVd2 2.83 - 1.65 0.94** 15 LVd3 2.68 - 2.44 0.96** 15 PVd 2.82 - 1.94 0.92** 15 LVd4 2.57 - 2.25 0.93** 15
LBC models after merging
LVd1 2.77 - 1.86 0.94** 30 LBC models after merging LVd2 2.83 - 1.66 0.94** 30
LVd3 + LVd4
0-3 cm 2.45 - 2.25 0.92** 30 PVd 2.83 - 2.06 0.94** 30
LVd1+PVd 2.80 - 1.96 0.93** 60
soil compaction. A further drawback of this approach is the apparent inconsistency between the pressure applied by the equipment and the soil precompression stress. Although the reported values for pressures applied to the soil surface by the Forwarder fall within the range from 92.6 to 152 kPa (Fernandes; Souza, 2003; Dias Junior et al., 2005), the precompression stress was often higher than these prior to traffic, and much higher
after (Table 5). This confirms the need for studies such as the present one, in order to assess more accurately the impact of farm machinery traffic in the occurrence of soil compaction under different soil and management conditions.
The excessive number of Forwarder passes caused compaction in every sample from the soil classes LVd3 and LVd4 from Três Lagoas, MS (Table 6). Although the 10-13 cm layer from the LVd3 showed a higher load
--- LVd2 (Capão Bonito, SP) --- PVd (Capão Bonito, SP)
---Traffic
intensity
Compacted
samples (%) (m3q m-3)
sp
(kPa) intensityTraffic
Compacted
samples (%) (m3q m-3)
sp (kPa)
0-3 cm 0-3 cm
H2F10 100 0.34±0.02 324±21 H2F6 100 0.29±0.02 271±16 H2F8 50 0.31±0.02 314±46 H2F5 100 0.25±0.03 331±44 H2F4 34 0.29±0.00 280±57 H2F4 100 0.25±0.02 296±24 H2F2 0 0.30±0.00 212±13 H2F2 100 0.24±0.02 336±17
10-13 cm 10-13 cm
H2F10 100 0.31±0.03 401±25 H2F6 100 0.21±0.01 367±20 H2F8 100 0.31±0.02 377±31 H2F5 67 0.15±0.01 428±20 H2F4 34 0.28±0.02 242±34 H2F4 67 0.19±0.01 351±12 H2F2 0 0.26±0.01 193±26 H2F2 43 0.16±0.01 375±26
Traffic
intensity
Compacted
samples (%) (m3q m-3)
sp
(kPa) samples (%)Compacted (m3q m-3)
sp (kPa)
--- 0-3 cm --- --- 10-13
cm---LVd3 (Três Lagoas, MS)
H4F36 100 0.17 ± 0.00 221 ± 9 100 0.16 ± 0.00 305 ± 9
LVd4 (Três Lagoas, MS)
H8F60 100 0.17 ± 0.01 300 ± 20 100 0.18 ± 0.01 301 ± 13
LVd1 (Capão Bonito, SP)
Fe1C1 75 0.27 ± 0.01 286 ± 17 63 0.25 ± 0.00 295 ± 17 Fe1C2 100 0.32 ± 0.01 288 ± 31 100 0.32 ± 0.02 328 ± 31
H: Harvester; F: Forwarder. The numbers following these letters indicate the number of passes of the equipment.
Table 5: Percentage of compacted samples determined according to the criteria proposed by Dias Junior et al.
(2005), volumetric moisture (q) and precompression (sp) stress values (mean ± mean standard error) for the
samples collected after harvest operations in the typic dystrophic Red Latosol (LVd2) and dystrophic Red Argisol (PVd) from Capão Bonito, SP.
Table 6: Percentage of compacted samples determined according to the criteria proposed by Dias Junior et al.
(2005), volumetric moisture (q) and precompression (sp) stress values (mean ± mean standard error) for the
samples collected after harvest operations in the typic dystrophic Red Latosol (LVd1) from Capão Bonito, SP; and the typic dystrophic Latosol (LVd3) and dystrophic Red Latosol (LVd4) from Três Lagoas, MS.
H: Harvester; F: Forwarder; Fe: Feller Buncher; C: Clambunk. The numbers following these letters indicate the number of passes
bearing capacity compared to the LVd4 (Figure 2), the excessive number of passes of the Forwarder, resulted in compaction of all the samples collected irrespective of the obvious differences in the load bearing capacities of these layers. Such an excessive number of passes more than doubled the precompression stress in the 0-3 cm layer in comparison to the original LBC models; the precompression stress values after traffic were 104% higher in the LVd3 and 174% higher in the LVd4. In this layer, both soil classes had the same load bearing capacity (Figure 2), but the increase in precompression stress after traffic varied due to differences in traffic intensity (36 passes in the LVd3 and 60 in the LVd4), although some previous studies on forest harvesting noted that most soil modifications, such as compaction, occur during the first few trips of the harvest machines (Ampoorter et al., 2010; Sampietro; Lopes, 2016; Andrade et al., 2017).
One pass of the Feller Buncher with only one pass of the Clambunk was enough to result in 75% and 63% of compacted samples in the 0-3 cm and the 10-13 cm layers respectively (Table 6). Again, higher compaction occurred in the shallowest depths, as the pressures transmitted to the deeper layers are attenuated (Keller; Lamandé, 2010; Arvidsson et al., 2011). An additional pass of the Clambunk resulted in compaction of all samples and increased precompression stress values in 93% and 129% in the 0-3 cm and the 10-13 cm layers respectively in comparison to the original LBC model. Forest harvest operations performed with the Feller Buncher and Clambunk also promote significant soil compaction, especially with increasing number of passes of the Clambunk, in agreement with Lopes et al. (2006).
The results from this study agree with some other researchers on the extensive structural degradation associated with forest harvesting and logging equipment, especially when the traffic of such equipment does not take into account the prevailing soil load bearing capacity and moisture condition (Silva et al., 2011; Lopes et al., 2015; Sampietro, Lopes, 2016; Andrade et al., 2017). Considering that the wood logging is the operation that most degrade the soil structure (Lopes et al., 2015; Andrade et al., 2017), and that it occur only at the end of the eucalyptus cycle (or once every seven years or so), it is important to further investigate possible natural recovery of the soil structure during the following eucalyptus cycle. This could be done using the original LBC models and the precompression stress values determined over time.
CONCLUSIONS
The coarse-textured soils from Três Lagoas, MS (LVd3 and LVd4) were more susceptible to compaction than the soils from Capão Bonito, SP (LVd1, LVd2 and PVd), and the soil with higher clay content was the more resistant to compaction (LVd2). The amount of soil compaction after traffic varied between the different soil classes and depends on the load bearing capacity models. The proportion of compacted samples was higher in the 0-3 cm layer than in the 10-13 cm layer. In the clayey LVd2, four Forwarder passes resulted in the compaction of a third of the samples, whereas in the sandy loam PVd all the samples from the 0-3 cm layer were compacted regardless of the traffic intensity. An excessive number of Forwarder passes (36 in the LVd4 and 60 in the LVd3) not only resulted in compaction of all samples, but also increased soil precompression stress up to 174%. The Feller Buncher and the Clambunk has a high potential to cause soil compaction even at low traffic intensity.
ACKNOWLEDGMENTS
The authors acknowledge Fapemig, CNPq, Capes and Fibria for funding the study.
REFERENCES
AJAYI, A. E.; DIAS JUNIOR, M. S. Mineralogy and Strength
Attributes of Soils: Strength of soils. 1. ed. Saarbrücken: Lambert Academic Publishing, 2012. 96p.
AJAYI, A. E. et al. Assessment of vulnerability of Oxisols to compaction in the Cerrado region of Brazil. Pedosphere,
20(2):252-260, 2010.
AJAYI, A. E. et al. Compressive response of some agricultural soils influenced by the mineralogy and moisture.
International Agrophysics, 27:239-246, 2013.
AMPOORTER, E. et al. Impact of mechanized logging on compaction status of sandy forest soils. Forest Ecology
and Management, 241:162-174, 2007.
AMPOORTER, E. et al. Assessing the effects of initial soil characteristics, machine mass and traffic intensity on forest soil compaction. Forest Ecology and Management, 260:1664-1676, 2010.
ANDRADE, M. L. C. et al. Soil compaction caused by harvest and logging operations on eucalyptus Forest in coarse-textured soils from northeastern Brazil. Ciência e Agrotecnologia,
ARAUJO-JUNIOR, C. F. et al. Capacidade de suporte de carga e umidade crítica de um Latossolo induzida por diferentes
manejos. Revista Brasileira de Ciência do Solo,
35(1):115-131, 2011.
ARVIDSSON, J. et al. Rubber track system for conventional
tractors - Effects on soil compaction and traction. Soil and
Tillage Research, 117:103-109, 2011.
BLAKE, G. R.; HARTGE, K. H. Bulk Density. In: KLUTE, A. (ed).
Methods of Soil Analysis. 2. ed. Madison: ASA/SSSA,
1986a. Part 1, p.363-375.
BLAKE, G. R.; HARTGE, K. H. Particle density. In: KLUTE, A (ed.).
Methods of Soil Analysis. 2. ed. Madison: ASA/SSSA,
1986b. Part 1, p.377-381.
BOWLES, J. E. Engineering properties of soils and their
measurements. 3. ed. New York: McGraw Hill, 1986. 218p.
BRAGA, R. M. et al. Physical attributes of distroferric Red Latosol under four eucalypt species over the long term. Ciência e
Agrotecnologia, 37(4):313-322, 2013.
CARVALHO, K. H. A. et al. Desempenho das exportações brasileiras de papel. Scientia Forestalis, 38(86):263-271, 2010.
DIAS JUNIOR, M. S. et al. Traffic effects on the soil preconsolidation
pressure due to eucalyptus harvest operations. Scientia
Agricola, 62(3):248-255, 2005.
DIAS JUNIOR, M. S.; PIERCE, F. J. A simple procedure
for estimating preconsolidation pressure from soil compression curves. Soil Technology, 8(2):139-151, 1995.
DIAS JUNIOR, M. S. et al. Assessment of the soil compaction
of two Ultisols caused by logging operations. Revista
Brasileira de Ciência do Solo, 32(6):2245-2253, 2008.
FERNANDES, H. C.; SOUZA, A. P. Compactação de um Latossolo Vermelho causada pelo tráfego do “Forwarder”. Revista
Árvore, 27(3):279-284, 2003.
FERNANDES, H. C. et al. Avaliação da resistência do solo à penetração em razão de cargas aplicadas pelo rodado de duas máquinas florestais e pelo arraste de madeira.
Revista Ceres, 55(1):21-27, 2008.
FIGUEIREDO, G. C. et al. Desenvolvimento de um consolidômetro
pneumático: Modelagem da compactação, penetrometria e
resistência tênsil de agregadosde solo. Revista Brasileira
de Ciência do Solo, 35(1):389-402, 2011.
GARDNER, W. H. Water content. In: KLUTE, A. (ed). Methods
of Soil Analysis. 2. ed. Madison: ASA/SSSA, 1986. Part 1,
p.493-544.
GEE, G. W.; BAUDER, J. W. Particle-size analysis. In: KLUTE, A.
Methods of Soil Analysis. 2. ed. Madison: ASA/SSSA, 1986.
Part 1. p.383-409.
IORI, P. et al. Comparison of Field and labortory models of
the load bearing capacity in coffee plantations. Ciência e
Agrotecnologia, 37(2):130-137, 2013.
KELLER, T.; LAMANDÉ, M. Challenges in the development
of analytical soil compaction models. Soil and Tillage
Research, 111:54-64, 2010.
LOPES, E. S. et al. Compactação de um solo submetido ao tráfego do Harvester e do Forwarder na colheita de
madeira. Floresta e Ambiente, 22(2):223-230, 2015.
LOPES, S. E. et al. Compactação de um solo de uso florestal
submetido ao tráfego de arraste de madeira. Revista
Árvore, 30(3):369-376, 2006.
MOREIRA, W. H. et al. Atributos físicos de um Latossolo
distroférrico em sistema de integração lavoura-pecuária.
Revista Brasileira de Ciência do Solo, 36(2):389-400, 2012.
OLIVEIRA, V. S. et al. Compressibilidade de um Argissolo
Amarelo distrocoeso submetido a diferentes manejos.
Revista Brasileira de Engenharia Agrícola e Ambiental,
15(5):435-442, 2011.
PACHECO, E. P.; CANTALICE, J. R. B. Compressibilidade, resistência a penetração e intervalo hídrico ótimo de um Argissolo Amarelo cultivado com cana-de-açúcar nos
tabuleiros costeiros de Alagoas. Revista Brasileira de
Ciência do Solo, 35(2):403-415, 2011.
SAMPIETRO, J. A.; LOPES, E. S. Compactação de um Cambissolo
e Neossolo submetido a diferentes intensidades de tráfego de Feller Buncher e Skidder. Scientia Forestalis,
39(90):265-272, 2011.
SAMPIETRO, J. A.; LOPES, E. S. Compactação de um Cambissolo causada por máquinas de colheita florestal espacializada
com geoestatística. Revista Floresta, 46(3):307-314, 2016.
SANTOS, H. G. et al. Sistema Brasileiro de Classificação de
Solos. 3. ed. Brasília: Embrapa, 2013. 353p.
SEVERIANO, E. C. et al. compactação de solos cultivados com cana-de-açúcar: II - Quantificação das restrições às funções edáficas do solo em decorrência da compactação prejudicial. Engenharia Agrícola, 30(3):414-423, 2010.
SILVA, A. R. et al. Avaliação da intensidade de tráfego e carga de um Forwarder sobre a compactação de um Latossolo
Vermelho-Amarelo. Revista Árvore, 35(3):547-554, 2011.
SILVA, R. B. et al. Contac pressures and the impact of farm
equipment on Latosol with the presence and absence of sugarcane straw. Ciência e Agrotecnologia,
40(3):265-278, 2016.
SNEDECOR, G. W.; COCHRAN, W. G. Statistical Methods. 8. ed.
Ames: Iowa State University Press, 1989. 503p.
SOUZA, E. P. et al. Desempenho do setor florestal para a
economia brasileira: Uma abordagem da matriz insumo-produto. Revista Árvore, 34(6):1129-1138, 2010.
TAYLOR, D. W. Fundamentals of Soil Mechanics. New York:
John Wiley & Sons, 1948. 700p.
VASCONCELOS, R. F. B. et al. Compressibilidade de um
Latossolo amarelo distrocoeso não saturado sob diferentes sistemas de manejo da cana-de-açúcar. Revista Brasileira