Wire Arc Additive Manufacturing (WAAM)
Process Analysis on Stainless Steel Built Samples
Master degree in Mechanical Engineering – Industrial Production
Ricardo Jorge da Silva Viola
Wire Arc Additive Manufacturing (WAAM)
Process Analysis on Stainless Steel Built Samples
Master degree in Mechanical Engineering – Industrial Production
Ricardo Jorge da Silva Viola
Project Report under the supervision of Doctor Mário António Simões Correia, Doctor Maria Leopoldina Mendes Ribeiro de Sousa Alves, both Professors from Polytechnic of Leiria and Doctor Pierre Michaud, Responsible of Additive Manufacturing in Addimadour, France.
This project report is original, made only for this purpose, and all authors whose studies and publications were used to complete it are duly acknowledged.
Partial reproduction of this document is authorized, provided that the Author is explicitly mentioned, as well as the study cycle, i.e., Master degree in Mechanical Engineering – Industrial Production, 2019/2020 academic year, of the School of Technology and Management of the Polytechnic Institute of Leiria, and the date of the public presentation of this work.
I would like to express my truly acknowledgments to my family and friends, for their constructive contribute, their support and for always believing in me.
I would also like to thank to all my Professors that contributed so much for my training throughout the master, specially to Doctor Mário Correia and Doctor Leopoldina Alves, for all the motivation, their knowledge, dedication ad contribution for my academic, professional and personal growth.
A special thanks to Doctor Pierre Michaud and his great team at Addimadour, for hosting me warmly, for their availability and knowledge provided throughout the entire time.
The increasing developed complexity parts geometry demanded by the industry nowadays, represents a challenge itself, not only for the standard production processes that do not have an answer for it, but also to repair these and other parts in a more cost effectively process with a short delivery period. A technological response to these needs is relying on the Wire Arc Additive Manufacturing (WAAM) process development.
This thesis was developed in Addimadour, an additive manufacturing research platform, located in Bayonne France, that has as objective the development of the Laser Metal Deposition Powder (LMD-P), Laser Metal Deposition Wire (LMD-W), Selective Laser Melting (SLM), ColdSpray – ArcSpray, Fused Deposition Modelling Robotized (FDMR) and Wire Arc Additive Manufacturing (WAAM) technologic processes, procedures, and providing consistent production parameters to industrial partners.
The starting point for this thesis was an extensive research, regarding the chosen material that was a duplex stainless-steel ER2209 applied by WAAM technology. This process consists in deposing layer by layer material through an electric arc with the help of a robot that runs the paths to generate the defined geometry. Relying on an innovator process with lower process temperatures named Cold Metal Transfer (CMT) technology, different experiments were done with the aim to understand the relations between process parameters and results obtained.
Firstly, three experiments were done to establish direct links between input parameters and the shape of depositions achieved. Secondly, other two experiments were done, with the aim of understand the existing dynamic between two or more cords produced together, but also to achieve the best shape possible to ensure the finishing of the surface quality. At last, two walls were produced as a result of all the knowledge collected.
All the experiments done, were followed by analysis and observation of all macroscopic and microscopic specifications. Regarding the microscopic observations and measurements, it was used a microscope and software, specially designed for this type of analysis.
carried out in all samples, using a Vickers testing machine. The results of these tests were a pattern and a range of values. For the second test, a three-point flexural test was made on samples, regarding the values of flexural force-displacement to evaluate flexural behaviour of the built samples.
Keywords: WAAM, CMT, ER2209 duplex stainless-steel, Built deposition, HAZ, Microhardness
Na indústria dos dias de hoje existe uma crescente necessidade de produzir peças de geometrias cada vez mais complexas, geometrias estas que, por si só, são um desafio à produção através dos processos convencionais, uma vez que estes processos não têm capacidade de resposta para esta necessidade, assim como para a reparação das mesmas e outras passíveis de reparar por este processo, de uma forma rentável e com períodos de entrega mais curtos. A resposta tecnológica para estas necessidades pode estar associada ao desenvolvimento do processo de Wire Arc Additive Manufacturing (WAAM).
Esta tese foi desenvolvida no Addimadour, uma plataforma de pesquisa dedicada ao fabrico aditivo, localizada em Bayonne, França, que tem como objetivo o desenvolvimento dos processos tecnológicos e seus respetivos procedimentos das tecnologias de Laser Metal Deposition Powder (LMD-P), Laser Metal Deposition Wire (LMD-W), Selective Laser Melting (SLM), ColdSpray – ArcSpray, Fused Deposition Modeling Robotized (FDMR) and Wire Arc Additive Manufacturing (WAAM), e o fornecimento de parâmetros de produção consistentes, aos seus parceiros industriais.
O ponto de partida desta tese foi uma extensa pesquisa de acordo com o material escolhido, aço inox duplex ER2209, utilizado pela tecnologia WAAM. Este processo consiste em depositar material camada a camada, através dum arco elétrico com a ajuda de um robot que, percorre os trajetos que realizará a geometria definida. Baseado num processo tecnológico inovador, com temperaturas de processo baixas, denominado Cold Metal Transfer (CMT), foram feitas diferentes experiências com o objetivo de relacionar parâmetros de processo introduzidos com os resultados obtidos.
Inicialmente, foram feitas três experiências para estabelecer relações entre os parâmetros introduzidos e a forma das deposições que foram atingidas. De seguida, outras duas experiências foram realizadas, com o objetivo de entender a dinâmica existente entre dois ou mais cordões, produzidos juntos, mas também para atingir o melhor formato e superfície possível, para cada deposição. Por fim, duas paredes foram produzidas como resultado de todo o conhecimento adquirido.
microscópicas, foi usado um microscópio, e um software especialmente desenvolvido para este tipo de análise.
Foram realizados dois testes mecânicos diferentes às amostras, com o objetivo de caracterizar o material produzido por este processo de produção. Um deles é o teste de dureza, que foi levado a cabo em todas as amostras com recurso a uma máquina que realiza o teste de Vickers. Destes testes, resultaram um padrão na disposição de valores, assim como um intervalo de valores consistente em todas as amostras.
No segundo teste, o teste de flexão em três pontos, foi feito em amostras tendo em atenção os valores de força-deslocamento para avaliar o comportamento à flexão das amostras construídas.
Originality and Copyright ... iii
Acknowledgments ... iv
Abstract ... v
Resumo ... vii
List of Figures ... xiii
List of Tables ... xvi
List of Abbreviations and Acronyms ... xvii
Introduction ... 1
1.1. Additive Manufacturing Process ... 1
1.2. The Investigation Centre... 2
1.3. Thesis Objectives ... 3
1.4. Thesis Structure ... 4
State of the Art of the WAAM Processes ... 6
2.1. WAAM Classification ... 6
2.2. WAAM Processes ... 6
2.3. Materials ... 7
2.4. Process Parameters... 7
2.5. Technology ... 9
2.5.1. CMT – Cold Metal Transfer ... 9
2.5.2. Synergic Laws ... 10
2.5.3. CMT Innovation ... 11
2.5.4. Advantages and Disadvantages of CMT ... 13
2.5.8. Shielding Gas ... 16
2.5.9. Weld Imperfections and Defects ... 16
Equipment and materials ... 18
3.1. Equipment used ... 18
3.1.1. Equipment used in the production ... 18
3.1.2. Equipment used in the samples construction ... 19
3.1.3. Equipment used to analyse materials ... 19
3.2. Material used for these experiments ... 22
3.2.1. Microstructures ... 23
Experimental Methodology ... 25
4.1. General Procedure ... 25
4.2. Defined parameters ... 26
4.3. Defined tests ... 31
4.4. Marks and cuts ... 34
4.5. Microstructure samples preparation ... 34
4.5.1. Microstructure samples Protocol preparation ... 34
4.5.2. Polishing microstructure samples ... 36
4.5.3. Polishing Protocol ... 36
4.5.4. Chemical Attack ... 37
Results and discussion ... 39
5.1. Laws Experiment ... 39
5.1.1. Cords deposition Macroscopic Analysis ... 39
5.1.2. Process temperatures ... 40
5.2.2. Process Temperatures ... 48
5.2.3. Comparison between all cords ... 49
5.2.4. Cords Deposition Microscopic Analysis ... 49
5.2.5. Detailed analysis of cord 1.6 ... 50
5.3. Wire Feed Speed Experiment ... 55
5.3.1. Cords Deposition Macroscopic Analysis ... 55
5.3.2. Process temperatures ... 57
5.3.3. Comparison between all cords ... 57
5.3.4. Cord Deposition Microscopic Analysis ... 58
5.3.5. Detailed analysis of cord 2.0 ... 60
5.4. Multi-cord Experiment ... 63
5.4.1. Deposition Macroscopic Analysis ... 63
5.4.2. Process Temperatures ... 65
5.4.3. Comparison between all depositions ... 65
5.4.4. Deposition Microscopic Analysis ... 66
5.4.5. Detailed analysis of 2.7 and 2.8 depositions ... 70
5.5. Walls Try-out Experiment ... 73
5.5.1. Deposition Macroscopic Analysis ... 73
5.5.2. Process Temperatures ... 75
5.5.3. Comparison between all walls ... 75
5.5.4. Detailed Analysis of the wall... 76
5.6. Deposition Macroscopic Analysis in Wall Construction ... 77
5.7. Microhardness Analysis ... 78
5.7.1. Laws Experiment ... 78
5.7.2. Robot Speed Experiment ... 80
5.7.3. Wire Feed Speed Experiment ... 82
5.7.4. Multi-cord Experiment ... 83
Conclusions ... 87
Future Work ... 89
Bibliography ... 90
Figure 1.1 – Steps of Additive Manufacturing production ... 2
Figure 1.2 – Addimadour Infrastructures (Compositadour, 2018) ... 2
Figure 2.1 – Examples of parts produced by WAAM technology (Huntingdon Fusion Techniques (A); Material district (B); Avianik (C)) ... 7
Figure 2.2 – Scheme of Fronius steps and interaction in WAAM equipment ... 9
Figure 2.3 – Distribution of the information introduced in Fronius ... 10
Figure 2.4 – Illustration of a Synergic Law (Adapted from Fronius, 2014) ... 11
Figure 2.5 – “Basic CMT process, one cycle” (Fronius, 2014) ... 12
Figure 2.6 – “Wire speed rate, current and voltage curves during a CMT Pulse cycle” (Tapiola, 2017) ... 13
Figure 3.1 - CMT Scheme of all the equipment and flux of data (adapted from Alcaraz, 2015) ... 18
Figure 3.2 – Robot KUKA’s angles and main components (Spez KR 100 HA, 2006 Datasheet) ... 18
Figure 3.3 – Leica DM 1750 M ... 20
Figure 3.4 – Vickers Microtech MX7 (Presi catalog, 2020)... 20
Figure 3.5 – Roell Zwick Z100 ... 21
Figure 3.6 – Microstructures and values of microhardness of Duplex Stainless-steel (FSH Welding Group) 23 Figure 3.7 – Representation of A-the transition between the weld/deposited material and the substrate/base metal (adapted from Nilsson, 2016) and B –“the duplex stainless steel weld metal” (Kobelco) ... 24
Figure 4.1 – Description of the diminutive and names used in this analysis ... 27
Figure 4.2 – Deposition 2.4 scheme ... 29
Figure 4.3 – Deposition 2.5 to 2.9 scheme ... 29
Figure 4.4 – Deposition 3.0 to 3.3 scheme ... 30
Figure 4.5 – Depositions wall trajectory: A-3.0; B-3.1; C-3.2 ... 30
Figure 4.6 – 3.3 deposition wall trajectory ... 31
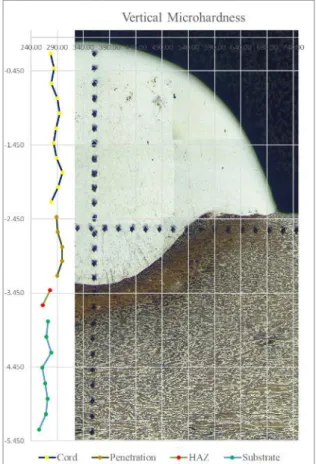
Figure 4.7 – Vertical microhardness reference image ... 32
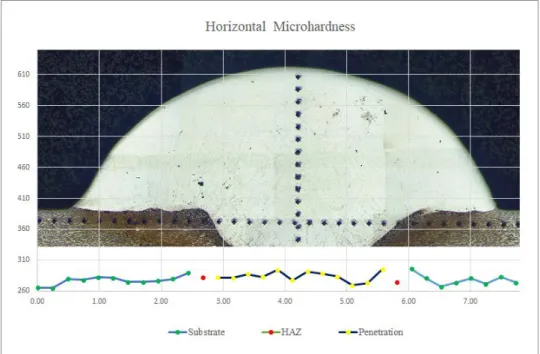
Figure 4.8 – Horizontal microhardness reference image ... 33
Figure 4.9 – A-Three-point flexural test example; B-Cords orientation in the sample ... 33
Figure 4.10 – A-marks and B-cuts, made, reference image... 34
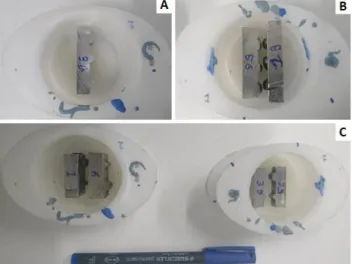
Figure 4.13 – A-Sample after liquid placement; B and C-View from the top of the sample; D-Both samples for
analysis ... 36
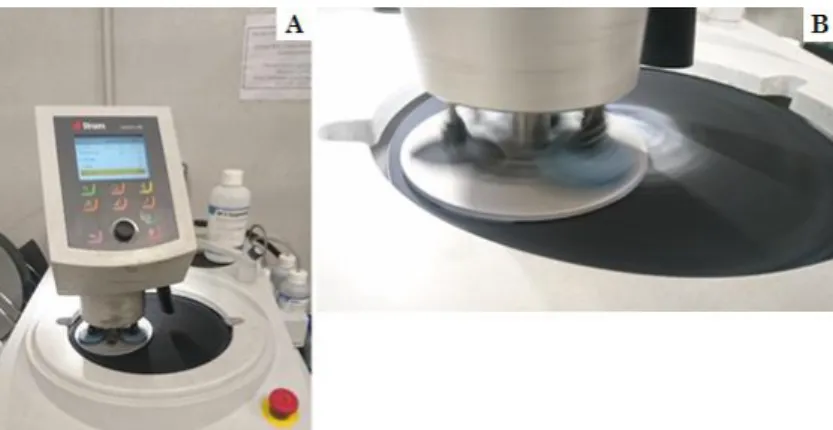
Figure 4.14 – A-Pre-polishing; B-Polishing the samples ... 37
Figure 4.15 – Samples after all the polishing procedure ... 37
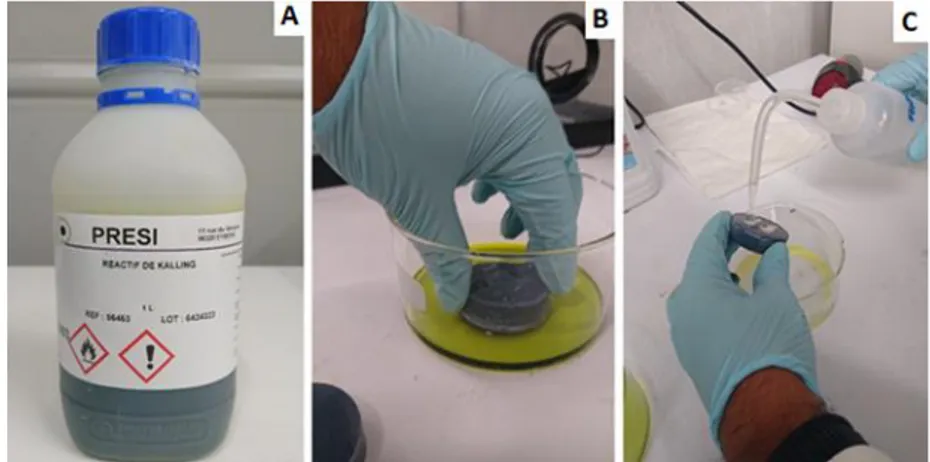
Figure 4.16 – A-Reagent Kalling; B-Procedure of exposure the sample and C-washing it with alcohol ... 38
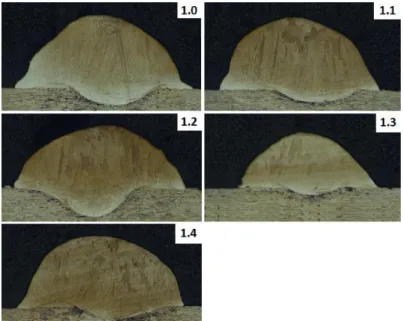
Figure 5.1 – Law Experiments five cords ... 39
Figure 5.2 – Image of all the Laws Experiment cords’ deposition ... 42
Figure 5.3 – Overview of the cord 1.2 ... 42
Figure 5.4 – Complete analysis of the cord 1.2 and its measurements ... 43
Figure 5.5 – Measurements of the cord 1.2 (middle cut) ... 44
Figure 5.6 – Flaws of the 1.2 cord ... 45
Figure 5.7 – Cut of the chosen cord 1.2 with microstructures and their localization ... 45
Figure 5.8 – Robot Speed Experiment’s four cords... 47
Figure 5.9 – Image of all the Robot Speed Experiment cords deposition ... 49
Figure 5.10 – Overview of the cord 1.6 ... 51
Figure 5.11 – Complete analysis of the cord 1.6 and its measurements ... 51
Figure 5.12 – Measurements of the 1.6 cord (middle cut) ... 52
Figure 5.13 – Flaws of the cord 1.6 ... 53
Figure 5.14 – Cut of the chosen cord 1.6 with microstructures and their localization ... 54
Figure 5.15 – Wire Feed Speed Experiment five cords ... 55
Figure 5.16 – Comparison between cord 1.9 and cord 2.3 ... 58
Figure 5.17 – Comparison between cords 2.0, 2.1 and 2.2 ... 59
Figure 5.18 – Overview of the cord 2.0 ... 60
Figure 5.19 – Complete analysis of the cord 2.0 and its measurements ... 60
Figure 5.20 – Measurements of the cord 2.0 (middle cut) ... 61
Figure 5.21 – Cut of the chosen cord 2.0 with microstructures and their localization ... 62
Figure 5.26 – Measurements of the deposition 2.4 ... 70
Figure 5.27 – Areas of the deposition 2.4 ... 70
Figure 5.28 – Measurements of the deposition 2.7 (middle cut) ... 71
Figure 5.29 – Areas measurements of the deposition 2.7 (middle cut) ... 71
Figure 5.30 – Measurements of the deposition 2.8 (middle cut) ... 72
Figure 5.31 – Areas’ measurements of the deposition 2.8 (middle cut) ... 72
Figure 5.32 – Walls Try-out Experiment ... 73
Figure 5.33 – Comparison between walls 3.0 to 3.2... 76
Figure 5.34 – Overview of the wall 3.2 ... 77
Figure 5.35 – Chosen wall after chemical attack. A-Beginning cut; B-Middle cut ... 77
Figure 5.36 – Wall’s Construction ... 77
Figure 5.37 – Vertical Hardness of cord 1.2 ... 78
Figure 5.38 – Horizontal Hardness of cord 1.2 ... 79
Figure 5.39 – Vertical Microhardness of cord 1.6 ... 80
Figure 5.40 – Horizontal Microhardness of cord 1.6 ... 81
Figure 5.41 – Vertical Microhardness of cord 2.0 ... 82
Figure 5.42 – Horizontal Microhardness of cord 2.0 ... 82
Figure 5.43 – Vertical Microhardness of wall 2.8 ... 83
Figure 5.44 – Microhardness indentations of Wall 3.2 (middle cut) ... 84
Figure 5.45 – Vertical Microhardness Values of Wall 3.2 (middle cut) ... 85
Figure 5.46 – Sample ready for Three-point Flexural test ... 85
Figure 5.47 – Three-point flexural test. A-Initial; B-Final ... 86
Table 3.1 – Chemical composition of Duplex Stainless-steel (Aircraft Materials) ... 22
Table 3.2 – Typical Mechanical Properties of Duplex Stainless-steel (Aircraft Materials) ... 23
Table 4.1 – Defined parameters (Law; Robot and Wire Speed Experiments) ... 27
Table 4.2– Defined parameters (Multi-cord and Walls Try-out Experiment; Wall Construction) ... 28
Table 5.1 – Laws Experimental process temperatures ... 40
Table 5.2 – Laws Experimental macroscopic measurements ... 41
Table 5.3 – Laws Experiment microscopic measurements ... 42
Table 5.4 –Microscopic measurements of the cord 1.2 ... 43
Table 5.5 – Robot Speed Experimental process temperatures ... 48
Table 5.6 – Robot speed experiment macroscopic measurements... 49
Table 5.7 – Robot Speed microscopic measurements ... 50
Table 5.8 –Microscopic measurements of the cord 1.6 ... 52
Table 5.9 – Wire speed experimental process temperatures ... 57
Table 5.10 – Wire’s Speed Experiment macroscopic measurements ... 57
Table 5.11 – Wire speed experiment microscopic measurements ... 59
Table 5.12 – Microscopic measurements of the cord 2.0 ... 61
Table 5.13 – Multi-cord Experiment process temperatures ... 65
Table 5.14 – Multi-cord Experiment macroscopic measurements (deposition 2.4) ... 65
Table 5.15 – Multi-cord experiment macroscopic measurements (depositions 2.5 to 2.9) ... 66
Table 5.16 – Multi-cord Experiment microscopic measurements (deposition 2.4) ... 69
Table 5.17 – Multi-cord experiment microscopic measurements (depositions from 2.5 to 2.9) ... 69
Table 5.18 – Wall Try-out Process Temperatures ... 75
ALC Arc Length Correction
AM Additive Manufacturing
ASTM American Society for Testing and Materials
CMT Cold Metal Transfer
DMLS Direct Metal Laser Sintering
EBM Electron Beam Melting
ESTG School of Technology and Management FDMR Fused Deposition Modelling Robotized
DC Dynamic Correction
GMAW Gas Metal Arc Welding
HAZ Heat Affected Zone
HV Vickers Hardness
LMD-P Laser Metal Deposition Powder LMD-W Laser Metal Deposition Wire
MAG Metal Active Gas
MIG Metal Inert Gas
SLM Selective Laser Melting
Introduction
This thesis is focused on analysis of the process of building parts on stainless-steel by Wire Arc Additive Manufacturing (WAAM). These types of technologies and variants are increasing weight in our society. Sometimes due to the need for repair of damaged components, in other situations to produce geometrically complex components and on the other hand to reduce the environmental impact on the production and repair of these components. With the rising of the environmental concerns, and the need for a better resources’ management associated to the production, the use of the additive manufacturing might be the solution required. The simplicity and adaptability of the WAAM process made it the optimal choice for this development.
In terms of materials, stainless-steel is one of the most important used industrially. The mechanical, thermic and chemical behaviour is already largely studied. It is also known for its added-value or for its expensive cost production due to the pouring process. For it to be cost-effective, it has to be used to produce large parts with limited geometries. Having this in mind, duplex stainless-steel is the optimal material to be studied in the development of this thesis.
1.1. Additive Manufacturing Process
Additive manufacturing processes are usually designated by 3D printing. It is possible to use different types of technology to produce a 3D metal part by these processes such as Wire Arc Additive Manufacturing (WAAM), Selective Laser Melting (SLM), Electron Beam Melting (EBM), Direct Metal Laser Sintering (DMLS), among others. (Compositadour, 2018)
This type of processes has the main characteristic of being produced layer by layer, on top of a substrate or without it depending on the used technology. Every single one of them consists in adding material with approximately parts geometry.
The process starts with a CAD 3D model of the part. Then, it is used a software to create a mesh and to slice it in order to be constructed layer by layer. The number of layers depends on the surface finish required (Figure 1.1).
Figure 1.1 – Steps of Additive Manufacturing production
1.2. The Investigation Centre
The experimental part of the thesis took place in Bayonne, France, in Addimadour, which is a new platform for innovation and technology transfer focused on metal additive manufacturing. It is one of the first centre in France to offer manufacturers solutions in this field (Figure 1.2).
Figure 1.2 – Addimadour Infrastructures (Compositadour, 2018)
Addimadour was co-conceived with a group of manufacturers, due to the efforts and the financings of the “Communauté d’Agglomération Pays Basque” and the “Nouvelle Aquitaine Region”.
This platform is managed by ESTIA – École Supérieure Des Technologies Industrielles Avancées (also located in Bayonne), and is part of Compositadour which is specialized in Robotics and Composites.
The Investigation Centre focus on the development of the following research themes:
“Mechanical characteristics’ improvement of parts obtained by additive manufacturing. ➢ Development of optimal process parameter ensuring good material properties; ➢ Real time instrumentation development for monitoring and feedback;
➢ Development of deposition strategies adapted to additive manufacturing processes.
Numerical modelling of multi-physics additive manufacturing processes:
➢ Thermal, mechanical and metallurgical simulation for behaviour prediction (residual stresses and deformation);
➢ Topological optimization (finite elements sizing for improving the performance / mass ratio of high value-added parts).” (Compositadour, 2018)
1.3. Thesis Objectives
The analysis of the additive manufacturing cords produced by WAAM technology were performed according two different aspects:
➢ The Material Properties: in this approach, generally, it is done an initial study to understand what the predicted microstructures and the type of internal structures should be. The experimental procedure produces the structures to be analysed using different parameters to obtain the cords;
➢ The Geometry of the cords: in this approach an ideal shape of the exterior and the interior of the cord is analysed.
The present work and analysis were done following the geometry of the cords approach. In this type of approach, the external shape of the cord is analysed according to its height, width, geometry, length, colour and eventually some defects that might appear on surface, like spatter. It is also very important to do a correct analysis of cords interior to identify porosity, inclusions, dimensions of the cords and the magnitude of the penetration.
1. To understand the main characteristics of the deposited material with the WAAM process;
2. The optimization of the process parameters as amperage, voltage, robot speed and wire feed speed aiming to optimal cord geometry;
3. The correlation between input parameters and defects;
4. Development of a correlation between the obtained microstructures with the parameters used on the experiments;
5. Find the microhardness pattern values inside the cords.
A microscopic analysis is done to all cords produced, all the different parameters, to fully understand the implications of each parameter in its construction. This analysis allows to compare the main results with those available on the bibliography.
To complete the analysis of each cord, microhardness tests are performed in the middle cut of cord. This test has the purpose to understand if there is a pattern in the microhardness values regarding start and end of deposition. The same evaluation was made concerning down and top of the cord.
The final goal of this thesis is to build two walls by WAAM using the parameters defined/optimized by the first experiments. Three-point flexural tests were performed on samples withdraw from those walls in order to achieve flexural mechanical properties such as young modulus and the maximum strength that allows to understand how the process influences the material properties.
1.4. Thesis Structure
In Chapter 1 (this Chapter) it is made the introduction of technology, materials, investigation centre, main objectives and thesis structure description.
Chapter 2, gives a brief explanation about WAAM process, the materials used by this technology, the process parameters that influences the outcome products made by this technology. On its last topic, it is explained how the complex technology of CMT works and the parameters and the limitations associated with this equipment.
The Chapter 3 introduces the experimental methodology and gives a brief presentation of all the equipment and material used in all the experiments.
Chapter 4 details all the experimental procedures, such as general procedure, the defined parameters and tests.
In the Chapter 5 the main results obtained are presented, where is provided all the collected data, the chosen cords and depositions from the experiments, the comparison between cords and walls, and all the analysis (macroscopic, microscopic, microstructure, microhardness and three-point flexural test).
The last chapter, Chapter 6, summarizes the main conclusions obtained from the experiments and their analysis and future developments are suggested.
State of the Art of the WAAM Processes
2.1. WAAM Classification
The American Society for Testing and Materials (ASTM) developed a standard ASTM F42 with several guidelines that classifies the Additive Manufacturing processes in seven categories:
➢ Vat Photopolymerization ➢ Material Jetting
➢ Binder Jetting ➢ Material Extrusion ➢ Power Bed Fusion ➢ Sheet Lamination
➢ Directed Energy Deposition
The process used in this thesis (WAAM) could be included on the Direct Energy Deposition processes.
2.2. WAAM Processes
The WAAM process has the meaning of Wire Arc Additive Manufacturing. This process consists in an electric arc, as a heat source, that melts the wire and the substrate where the material is being deposited. WAAM builds parts, with the required geometry, by adding material, layer by layer. Currently, the CMT process is equipped with a complex equipment that controls the wire feeding, the electric arc and the gas volume added. The trajectory of the layers is the only parameter that is controlled by the robot software.
This production process consists in designing CAD model, slicing into layers, tool-path generating, choosing welding parameters, material deposition and post-processing.
According to Posch, Chladil & Chladil (2017), to produce wings, turbine blades and valves, and many other big components by AM, “economic considerations are more dominant and it is necessary to reduce the additive manufactured component costs”.
2.3. Materials
The materials used in the WAAM process (processes that are being currently in development) are the Titanium (TiAl6V4B) used in the aeronautic and chemical industries; the Inconel 7718 (NiFe19Cr19Nb5Mo3) used in aeronautic industry and on the manufacturing of tools dedicated to work with high temperatures; Steel (ER316LSi, SMV3S, ER2209 duplex) used on the assembly and repair of stainless-steel parts, boilers and tubes, in under pressure equipment, in metallic constructions that do not exceed the work temperature of 400 ºC, in constructions near the sea, in moulds for glass, dies and insert for stamping, and in the naval industry; and Aluminium (AlSi5, AlSi5GrY, AlMg5Cr, AlSi7Mg0,5Ti, AlCu6MnZrTi) used on extruded aluminium parts and repair of foundries parts, naval construction, on railroads, on roads and in aerospace and aeronautic industries. The materials to this process come in wire spools in which the wire can have different thicknesses according to their final purpose, mainly provided by the supplier Selectarc Welding.
2.4. Process Parameters
The process parameters usually depend on the material to be used and the geometry of the parts to be produced (Figure 2.1).
Figure 2.1 – Examples of parts produced by WAAM technology (Huntingdon Fusion Techniques (A); Material district
(B); Avianik (C))
Developing parts for different markets have different challenges. The starting point is always the basic understanding and the number of parameters that are directly linked or that restraint the final product achieved. Developing the basis of a production technology requires a deep understanding of the key parameters that correctly tune and allow to achieve a good result.
Simple precautions with the material, like keeping the filler wire “clean and dry, and stored in a covered container until use” are assured while handling it (TMR Stainless, 2014). Vignesh (2017) states that “a deposition strategy limitation, required in additive manufacturing, is that the processing tool should be always normal to the working plane; thus the inclination is chosen to be constant at 90 degrees”, and also “to minimize aspiration of air into the shielding gas” (TMR Stainless, 2014) the angle is kept constant in all the experiments.
Using the correct procedures like maintaining the width of the root gap carefully, “to ensure consistent heat input and dilution in the root pass”, or initiating the gas flow “several seconds ahead of striking the arc, and it should be maintained for several seconds after the arc is extinguished, ideally long enough for the weld and HAZ to cool below the oxidation range of the stainless steel” must be followed carefully. Respecting these procedures suggested by the TMR Stainless (2014) as well as the flow rates of 12-18 l/min would help to protect “from atmospheric oxidation and contamination” and to achieve a good result and, as according to Vignesh (2017), the flow rate gas and the gas itself used during WAAM, “influences many factors such as surface appearance”.
Vignesh (2017) stated that the parameters of amperage, voltage, wire feed speed and welding speed “are very crucial to obtain the desired weld bead geometry and properties for WAAM deposition”; and that when they have a “properly calculated combination” the weld shows the best quality “in terms of geometrical aspects such as Bead Width (W), Height (H) and Depth of Penetration (P) and metallurgical aspects such as defect free weld beads, less spatter and inclusions”.
According to Posch et.al. (2017) “the wire feed rate was set to 4.2 m/min, the welding speed was 36 cm/min” related with the amperage that “was 145 A” and “the voltage 11.9 V” that shown good results in a blade production. The wire manufacturers also indicate, for 1.2 diameter of wire, similar values regarding the amperage and voltage but there are other parameters to consider and explore, like paths’ strategies as Vignesh (2017) states. These values are going to be the basis for the search for the right law in the Fronius equipment.
The influence of the parameters, stated by Vignesh (2017) are “the current (amps) produces the heat and penetration, the voltage produces the arc that carries this heat and the travel
speed supports this heat and the resulting molten metal to be deposited on the substrate.” These are the parameters with the most importance and where the focus of the thesis would be.
2.5. Technology
2.5.1. CMT – Cold Metal Transfer
The Cold Metal Transfer (CMT) was the process chosen for this thesis development as it is “a highly developed version of Metal Inert Gas / Metal Active Gas (MIG/MAG) arc welding process with a precise process control and low heat input to the base material.” (Imoudu, 2017).
The CMT equipment was developed by an Austrian company called Fronius, to help the user to achieve better depositions through setting some parameters inside each law. Fronius developed “synergic laws” that have instructions to be used regarding the material chosen. Inside each “synergic law” it is possible to adjust only some parameters like the wire’s feeding speed or the arc’s hardness, while others are unaltered by the user but changed automatically by the processes controller Fronius, adjusting them to the changes introduced by the user (Figure 2.2 and Figure 2.3).
Figure 2.3 – Distribution of the information introduced in Fronius
2.5.2. Synergic Laws
According to Imoudu (2017), Fronius developed a concept designated by synergic law “for different filler materials and filler diameters”. There is a major importance of this synergic laws “in the CMT welding process because they provide the basic parameters automatically to each filler material” and each filler diameters. A good choice of this law, together with good adjustment of the welding parameters, controlled by the CMT, should provide quality welds. Because the amount of data in each law, there is a need to choose the right one using the tables supplied by Fronius, where it is referred the indicated laws for each type of material and upload them to the CMT equipment, through the remote control.
The creation of a synergic law has, as a fixed parameter, a low value of wire feed speed and, with the help of an oscilloscope and a high-speed camera, a process of detailed examination of the different characteristics and optimization is developed, achieving an ideal value of voltage. This optimization process is developed for all the wire feeding speed values, presented in each law.
The gathered voltage values, collected by the arc length correction, are in a range of 60%, being 30% above the ideal and 30% below it, defining an ideal value, for each wire feeding speed. This range is shown, in yellow defining the working area, in the Figure 2.4.
Figure 2.4 – Illustration of a Synergic Law (Adapted from Fronius, 2014)
The wire feed speed has a direct link with the power, controlling it in agreement with the synergic law used but other links, with the wire feed speed are referred by Selvi, Vishvaksenan & Rajasekar (2018): “the wire feed rate and the cycle arcing phase are controlled to realise sufficient energy to melt both the base material and a globule of filler wire” that have a great importance for the CMT process.
The correction parameters also have a major influence in the process as stated in Imoudu (2017), ALC (Arc Length Correction) and DC (Dynamic Correction) “also have effect on the wire feed rate”, this relation is also to take into account.
As referred before, the wire feed speed parameter has a direct influence on the CMT process in different aspects. According to Almeida (2010), it was possible to observe that the real wire feed speed actually was different from the defined on Fronius control. Not being the wire feed speed constant, knowing that the direction of the wire (forward and backward) changes with high-frequency, according to the signal controller, it is possible to have to introduce some changes to achieve a good balance between parameters.
2.5.3. CMT Innovation
The innovation on the CMT process is the movement associated to the wire tip. The equipment relies in two electric engines to control the wire (one in the wire feeder and one in the torch). The combination of wire movements done by these engines and the existence of a buffer, allow the wire tip to do high frequency movements, forward and backward,
minimum arc burning time. This characteristic results in a process with low energy inputs that combined with “an accurate robotic movement of the CMT welding torch, geometries with minimum thicknesses in the range of 2–4 mm can be built up layer by layer” (Posch,
et.al., 2017).
Figure 2.5 – “Basic CMT process, one cycle” (Fronius, 2014)
The minimum wall thickness that is possible to achieve depend on the type of material, the diameter of the filler wire, the wire feed speed and heat supplied to the process, Posch, et.al. (2017) “the lower the heat input, the smaller the minimum achievable wall thickness.”
According to Posch et.al. (2017) if the need is to build thicker walls, they can be achieved by using different strategies of path generated. These strategies could also be assisted with different settings in the CMT machine.
Concerning the finishing surface left by this process, Posch et.al. (2017) that it is quite smooth and “Surface roughness measurements of the CMT blade showed a comparable roughness as achieved by sand casting, hot rolling, or flame cutting” which left (if achieva-ble) only minor post processing requirements needed (depending on the type of part pro-duced).
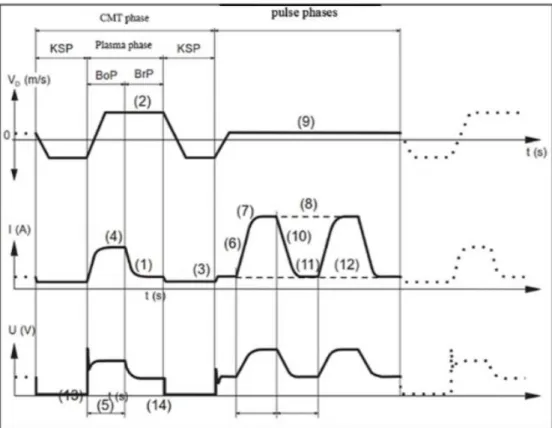
There are, in the CMT processes, some variants of the process that make it more adaptable for other material requirements and uses. These variants are the CMT Pulse, CMT Advance, CMT Pulse Advance, CMT Dynamic, CMT Pin and CMT Synchro Pulse. Each one of these variants have their own specification regarding an extra cycle, or a different cycle, done by the wire movements and its speed, the amperage and the voltage input.
The Figure 2.6 shows, as an example, a representation of the CMT and pulse cycles. The cycle done in the normal CMT is referred as CMT phase, and the cycle associated to the CMT pulse is the conjugation of the CMT phase with the referred pulse phases.
Figure 2.6 – “Wire speed rate, current and voltage curves during a CMT Pulse cycle” (Tapiola, 2017)
2.5.4. Advantages and Disadvantages of CMT
The CMT process is easily automated achieving a better control of the process, that is reflected in the management of the electric arc length done by the system. The great advantage of this process is its reduced heat input during the deposition, comparing to other conventional processes. As Posch, et.al. (2017) said “The realizable wall thicknesses are mainly determined by the welding heat input: the lower the heat input, the smaller the minimum achievable wall thickness”.
The disadvantages of CMT are the spatter formation during the construction process of the thin walls as stated in Posch, et.al. (2017), “a significant reduction of the process energy is required which increases the risk of process instabilities and spatter formation”. On the other hand, as reported by Imoudu (2017) “the short arc process no longer exists for higher currents meaning the CMT can’t be used” limiting its application to lower amperage inputs.
2.5.5. Correction Parameters
The achievement of a perfect deposition relies not only in the choice of the right synergic law for the material chosen, but also in the optimization of the process parameters.
The CMT developed what is called by Correction Parameters, to help this optimization. There are two: Arc Length Correction (ALC) and Dynamic Correction (DC). The “ALC, is used to set the spatial elongation of the arc plasma column. Shorter arc has a favourable effect on welding speed and against undercuts, and a long arc has positive effects in terms of formation of wide weld seam and edge formation”. Regarding the DC influence, this “cor-rection simulates inductance and it is used to adjust the duration and property of the short-circuit break. In other words, DC controls the arc pressure by adjusting the reignition cur-rent” (Tapiola, 2017).
2.5.6. Welding Power
The power (Watt) supplied to the CMT process has a big influence in the process. This influence is inputted in the process in the form of two parameters separately: the amperage in ampers and the voltage that comes in volts.
The formula that describes this relation is:
𝐴𝑟𝑐 𝑃𝑜𝑤𝑒𝑟 = 𝐴𝑣𝑒𝑟𝑎𝑔𝑒 𝐴𝑚𝑝𝑒𝑟𝑎𝑔𝑒 𝑥 𝐴𝑣𝑒𝑟𝑎𝑔𝑒 𝑉𝑜𝑙𝑡𝑎𝑔𝑒 (1)
In the CMT it is possible to have the same power value supplied to the system at the same time that the both parameters (amperage and voltage) could have various combinations possible, with very different values.
The theoretical heat input for this process could also be calculated in kJ/mm, according to the European standards (EN ISO 1011), by the formula:
𝐻𝑒𝑎𝑡 𝑖𝑛𝑝𝑢𝑡 = 𝑇ℎ𝑒𝑟𝑚𝑎𝑙 𝐸𝑓𝑓𝑖𝑐𝑖𝑒𝑛𝑐𝑦 𝑉𝑜𝑙𝑡𝑎𝑔𝑒 𝑥 𝐴𝑚𝑝𝑒𝑟𝑎𝑔𝑒 𝑥 60
𝑇𝑟𝑎𝑣𝑒𝑙 𝑆𝑝𝑒𝑒𝑑 (2)
This formula transcribes “the amount of electrical energy that is supplied to a weld during the welding process” according to Anand (2019).
Also, by the standards of ASME under the European system the heat input is referred as Arc energy. With this difference, the formula is:
𝐻𝑒𝑎𝑡 𝑖𝑛𝑝𝑢𝑡 = 𝑇ℎ𝑒𝑟𝑚𝑎𝑙 𝐸𝑓𝑓𝑖𝑐𝑖𝑒𝑛𝑐𝑦 𝑥 𝐴𝑟𝑐 𝑒𝑛𝑒𝑟𝑔𝑦 (3)
The appearance of the thermal efficiency parameter in the formula, is explained by the heat lost by the process in various forms, like radiation, among others, and that in reality do not contribute effectively for heating and melting the wire in the base metal. Due to this loss, there was the necessity to introduce a compensation factor (thermal efficiency) to correct the result value achieved with this formula. By default, according to Anand (2019), the value used could be the 0.8, that it is normally correlated to the conventional process of MIG/MAG, once these processes have more heat input, they generally also have more losses.
The CMT equipment records, in its memory drive, the average, amperage and voltage used during the welding. An analysis of this data, collected by the software Fronius Xplorer can provide the values for these formulas. There are also others software in the market, that associated to the CMT equipment, collect more detailed and accurate data for analysis, regarding more parameters.
2.5.7. Welding Geometries
In consonance with Imoudu (2017) and Tapiola (2017), the welding geometries and shape have a greater importance for deposition process. The cord dimensions, its exterior and interior shape reveals the influence that the input parameters have.
The physical properties that are analysed for this understanding are the cord height, width, penetration depth, as well as the geometry shown in terms of centration. The alignment of the penetration with the cords higher point, the symmetry of the external shape as the internal are also evaluated.
2.5.8. Shielding Gas
The shielding gases can be divided in two categories: the inert or semi-inert, based on their properties in accordance with EN ISO 14175. The first ones are cost effective, compared with the semi-inert, used in welding; and the second ones when used in small controlled quantities, can improve weld characteristics.
Argon is an inert shielding gas that does not react with the work piece. The benefits for its use are the improvement in wetting, and flow characteristics of the weld metal.
The characteristics of the gas CO2 is that it provides a deep penetration and, mixed with
argon in low percentage (1-2%), it reduces the surface tension of the molten area, at the same time being the least expensive shielding gas. The disadvantage of it is that it affects negatively the arc stability, enabling the appearance of spatter or creating droplets and leaving a highly oxidized surface.
The contribution of the Nitric oxide has an environmental objective to reduce the ozone production and at the same time to stabilize the electric arc during the process. The presence of nitrogen reduces the distortion of the weld part, having a positive influence in the arc stability, penetration, weld shape and colour at the same time that contributes to maintain a proper nitrogen content in the duplex stainless steels and to increase the welding speed. (in https://www.aga.se/en/products_ren/cutting_welding_gases/shielding_gases/mison_shieldi ng_gases/index.html)
2.5.9. Weld Imperfections and Defects
The CMT process is not free of flaws and defects, which could have several sources like the shielding gas used, the parameters combination, the material used, the geometry adopted among others. These flaws have a great importance regarding the process, once they contribute actively for the final result in terms of geometry and quality of the final product in its microstructure and surface finishing.
The flaws more common in the process are the porosity, inclusions, bead humping, cracking and excessive convexity as reported by Mendez (2003), and could affect the integrity of the part produced as the post process costs.
The origin of the flaws has to be analysed in each deposition to understand which are the parameters contributing for it.
Being subject of several studies, welding has already some correlation between the flaws and its probable origin, like porosity, “generally associated with gas for the period of the solidification of a weld bead and generally recognised as cavity-type discontinuity” (Imoudu, 2017), but the porosity could have more origins like the strategy for the deposition.
Another big source of flaws is the wrong combination of parameters chosen for the deposition regarding the material used. It is very important to use the right combination of the Law in CMT, the wire feed speed, the robot speed, the shielding gas chosen and the flow rate of the shielding gas. There are also other parameters contributing for the flaw’s appearance and they are the surrounding conditions like temperature, humidity, wind, among others.
Equipment and materials
3.1. Equipment used
3.1.1. Equipment used in the production CMT Welding Equipment
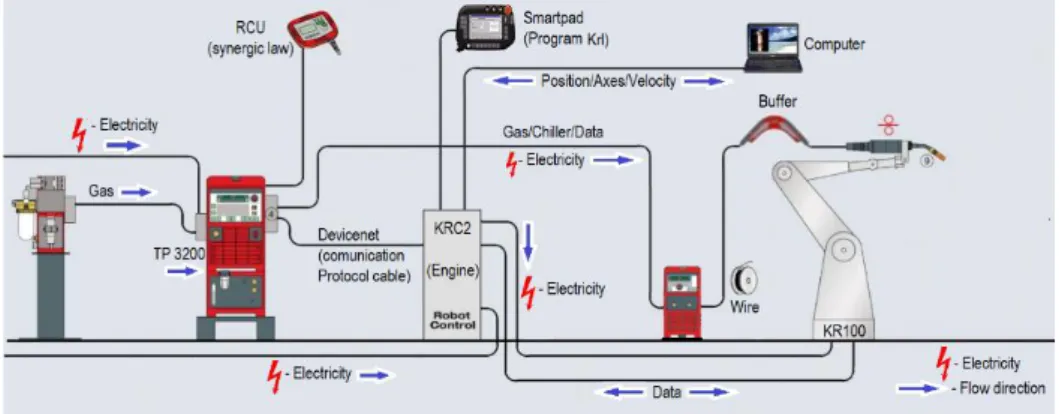
The Figure 3.1 describes all the equipment used by the CMT. As it can be seen, it is a quite complex system where all the parameters regarding the production of the parts are controlled by the TP 3200, except the robot’s speed that is controlled by KRC2.
Figure 3.1 - CMT Scheme of all the equipment and flux of data (adapted from Alcaraz, 2015)
Robot KUKA KR 100-2 HA 2000
The robot KUKA is a KR 100-2 HA 2000 model (Figure 3.2) and is used to handle the CMT torch. It is made of cast light alloy which leads to a high resistance to vibration. This robot has the important function to perform all the defined strategies for depositions.
3.1.2. Equipment used in the samples construction Cutting machine
In order to cut and prepare the samples for analysis it was used a cutting machine Labotom-5 from Struers. It is a machine without cut velocity regulation and with forward speed manually controlled. The cut is made with liquid cooling and lubrification. The work table has a dimension of 316 x 225 mm allowing to make all the cuts necessary to the samples construction (Struers Labotom 5 Datasheet).
Polishing machine
The pre-polishing / polishing machine is a Struers LaboPol30 and is located at the laboratory of metallography.
The equipment includes a “software” Struers LaboForce100 that has already pre-programmed all the procedures regarding each material to be polished. In these programs are also used the LaboDoser100, that includes chemicals used during the polishing procedure, leaving for the users the simple task of changing the polishing discs (LaboPol30 Datasheet).
Chemical Vapours Hood
The Chemcap Clearview Fume Hood BC 8004 is used to do the samples construction that are going to be polished and analysed afterwards. The main function is to protect the users from the toxic vapours released from the chemicals used during the construction in order to protect them from the vapours produced during the chemical attack (in Clearview Fume Hood Datasheet).
3.1.3. Equipment used to analyse materials Microscope
The microscope used is a Leica DM 1750 M (Figure 3.3). This equipment allows to analyse the microstructure of the samples produced with four lenses (x5, x20, x50 and x100). This
user to see and correctly tune the images and their properties (with a clear vision on a screen), with several options to work the images collected (LEICA DM 1750 M Datasheet).
Figure 3.3 – Leica DM 1750 M
Microhardness machine
The Presi Vickers Microtech MX7 (Figure 3.4) is a microhardness analysis equipment with automatic load application that was used for measuring the microhardness of all the samples.
The precision of this equipment is 0.1 µm (x200 - x1000) and the load range is from 5 to 1000gf of load application. The time and the load applied can be adjusted (Presi catalog, 2020).
Turret Milling Machine
The HOLKE F-10-V machine is a three axes manual surface milling and it was used to mill the final walls produced to construct samples for the three-point flexural test, assuring that all have the same dimensions. The main purpose of this millings was to prepare the samples for some additional superficial finish made in the surface grinder Chevalier.
The HOLKE F-10-V has a work table with 1220 x 255 mm, the spindle power is of 1.5 kW and the axle rotation goes from 57 rpm/min to 2275 rpm/min (Holke F-10-V Datasheet).
Surface Grinder machine
The Hesse Chevalier FSG-3A818 is a three axes automatic surface grinder and it was used to finish the surface of all the samples, coming from the same wall. This surface grinder has a magnetic work table with dimensions of 457 x 203 mm, with a grinding area of 457 x 203 x 450 mm, which allows to finish more than one sample at the same time (Hesse Chevalier FSG-3A818 Datasheet).
Three-point Flexural machine
The Roell Zwick Z100 (Figure 3.5) is the equipment that was used to perform the three-point flexural tests in the wall samples. These tests were performed in a controlled laboratorial environment in order to assure similar conditions for every test.
3.2. Material used for these experiments
The material used in the substrates, as to perform all the experiments described above, was the Stainless-steel ER2209, a duplex stainless-steel. It was chosen the Ø1.2-mm classified as G 22 9 3 N L by EN ISO 14343-A, SS2209 according to EN ISO 14343-B and ER2209 according to AWS A5.9.
By definition, duplex stainless-steel is a two-phase steel: with ferrite and austenite. This type of material has in its composition, ideally, 50% of ferrite and 50% of austenite microstructure. According to Padilla, Plaut & Rios (2007) duplex stainless-steel has “an interesting combination of properties: a yield strength (YS) twicer higher than the one for the austenitic and ferritic common types, greater plasticity and toughness”.
The choice of this material takes into account various and important factors in the production industry nowadays. The cost of the material was considered such as the production costs of parts with it. Having in mind that AM has, as a target market, short runs of parts for specific industries that are growing and have the need to build more complex parts, faster. To fulfil the production requirements of the industries, this material needs to have its parameters properly developed to find the right tune for each parameter. However, it plays an important role, its tonnage only represents 2.2% of the whole steel production, being austenitic stainless steels representing 60% and ferritic steels 30% of the whole stainless-steel productions (Padilla et.al., 2007)
The chemical composition of this material is described in Table 3.1.
Table 3.1 – Chemical composition of Duplex Stainless-steel (Aircraft Materials)
Weight % C Mn Si Cr Ni S P Mo Cu N ER2209 0.03 max 0.50 - 2.0 0.90 max 21.5 - 23.5 7.5 - 9.5 0.03 max 0.03 max 2.5 - 3.5 0.75 max 0.08 - 0.20
The typical mechanical properties of this material are described in Table 3.2.
Table 3.2 – Typical Mechanical Properties of Duplex Stainless-steel (Aircraft Materials)
Material Ultimate Tensile Strength Yield Strength (0.2 %) Elongation (%) MPa MPa ER 2209 720 560 26
According to the FSH Welding Group, this stainless steel has some advantages. It has high resistance to corrosion, to fatigue, to erosion and to chloride stress corrosion cracking. It also has good properties in strength, toughness, sulphide stress corrosion resistance and good characteristics in terms of welding and workability. Among other austenitic stainless steels, it is the one with higher thermal conductivity and lower thermal expansion. (FS
Figure 3.6 – Microstructures and values of microhardness of Duplex Stainless-steel (FSH Welding Group)
In the Figure 3.6, it is shown the microstructures and the values of microhardness (HV) typical of this material.
The advice given by the material supplier is that the temperature of the substrate, before welding, should be about 20ºC, without any pre-heating treatment for this material (Duplex Stainless Steel), so the parameter of heat input and range temperature can be respected.
3.2.1. Microstructures
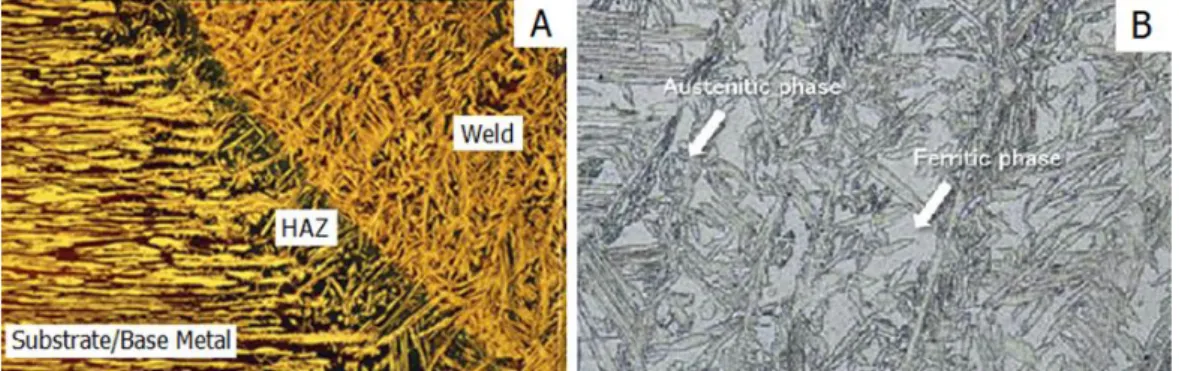
The Duplex Stainless-steel quality, in the weld area, requires a good ratio balance of austenite and ferrite deposits (Figure 3.7B). A phase balance is very important in the material. For example, if there is too much ferrite (more than 70%), it will have less ductility, less toughness and less corrosion resistance; if there is too much austenite (more than 80%),
Figure 3.7 – Representation of A-the transition between the weld/deposited material and the substrate/base metal
(adapted from Nilsson, 2016) and B –“the duplex stainless steel weld metal” (Kobelco)
As referred by Taban & Kaluç (2013) “Duplex stainless steels in general solidify as δ-ferrite, and the austenite phase forms by nucleation at ferrite grain boundaries during cooling to room temperature. Consequently, the amount of austenite resulting at room temperature in welded joints becomes a function of the thermal history experienced during welding.” This function of the thermal history is the reason to do cuts in each cord or wall to have access and understand the development of the deposition (Figure 3.7A).
The statement of Taban & Kaluç (2013) “The higher the cooling rate, the higher the ferrite content occurs in the duplex structure”, is going to be explained during the analysis of the cuts of the cords or walls, if the structure reveals where it had a faster or slower cooling rate.
Experimental Methodology
4.1. General Procedure
Each experiment followed a common procedure, regardless the changes that can be done in the different parameters:
1. This procedure starts with substrate preparation (in case it is needed). It can be grinded, polished and cleaned, or just the last two ones. The polish phase is made with the elliptical polisher with a polish disc P60;
2. The second step is to fix the substrate in the work table to prevent it from moving in any direction and to prevent the bending factor that is associated to this type of depositions; 3. The pre-deposition step includes to polish the substrate again and clean it with alcohol and paper and assure the equipment is prepared for depositions (Appendices B);
4. Next step the cord and wall deposition, according to the parameters specifications previously defined theoretically, following the safety procedures (Appendices C);
5. After the deposition, it is needed to catalogue all the cords and analyse them through a macroscopic analysis;
6. After a thorough macroscopic analysis of the cords and walls deposition, cuts are made in three points: 1) immediately after the beginning of the cord (more or less 10 mm), 2) at the middle 3) and at the end (more or less 10 mm before end). The aim of this cuts is to fit in the moulds for the samples for microscope analysis;
7. After the cuts, it is time to make the samples for the microscopic analysis (protocol described in 4.5.1. Protocol);
8. When the samples are prepared, they are polished in the Labopol 30, following the procedure previously described (protocol described in 4.6. Polishing);
9. The chemical attack is done after the polishing phase (protocol described in 4.7. Chemical Attack);
10. After the chemical attack the samples are positioned in the microscope LEICA DM 1750M to observe and describe all the internal microstructures and cords shapes (in profile); to measure the contact angles with the substrate; and to understand if there are irregularities or defects, like pores or inclusions. Photographs are taken to document the analysis with the
4.2. Defined parameters
In the first three experiments the main purpose is to find the best parameters (law, robot speed and wire feed speed) that will allow to have the cord with the best shape.
In the first experiment, with the aim to understand the influence of the automatically defined and occulted (by Fronius) deposition parameters of each law, five different laws were used, different laws that have different amperages and voltages. These laws were selected in the CMT Fronius and the criteria was the values of amperage and voltage, despite being different, they were close to the ones referred in the literature as the ideal ones for this material, setting the robot speed and the wire feed speed, with values described in Posch
et.al. (2017). The Law CMT 875 had the values of voltage, robot speed and wire feed speed
close to the reference values but a low value of amperage. This Law was chosen with the aim of trying to identify the contribution of amperage for the ensemble, keeping all the other parameters (voltage, robot speed and wire feed speed) unaltered.
After finding the right Law, different values for the robot (KUKA) speed were used in the second experiment in order to understand the influence of this parameter in the cord shapes obtained. With the right Law and the right robot speed already chosen, it was time to try different wire feeding speeds. On the CMT there is a correlation between the wire feeding speed, the amperage and the voltage. Due to this correlation, when the wire feeding speed changes, the values of the amperage and the voltage are also changed automatically by the CMT (Table 4.1).
In all these experiments there are some parameters that are going to remain the same, like the gas and the gas flow. The gas used was always the Mison 2, composed of Argon + 2.0% CO2 + NO, and the gas flow was always 17.5 l/min. Other fixed parameters are the Arc’s
Height and the Arc’s Hardness, that were always zero, and the torch mode was always 2 strokes.
In all this experiments the existing cooling system (Appendices D) was not used, the wire thickness was 1.2 mm for all the experiments, the nozzle was in a 90-degree angle and the path in these experiments was linear and with only one cord.
Table 4.1 – Defined parameters (Law; Robot and Wire Speed Experiments) Cord Synergic Law Type of Gas Gas charge (l/min) Amperage (A) Voltage (V) Robot Speed (m/min) Wire Speed (m/min) Path's Direction Law Experiment 1st substrate 1.0 CMT1093 34 Mison 2 17.5 136 13.7 0.36 4.2 Longitudinal 1.1 CMT1164 Mison 2 17.5 140 13.4 0.36 4.2 Longitudinal 1.2 CMT1093 Mison 2 17.5 151 13.1 0.36 4.2 Longitudinal 2nd substrate 1.3 CMT875 Mison 2 17.5 66 12.5 0.36 4.2 Longitudinal 1.4 CMT1098 Mison 2 17.5 150 16.1 0.36 4.2 Longitudinal Robot Speed Experiment 3rd substrate 1.5 CMT1093 Mison 2 17.5 151 13.1 0.54 4.2 Longitudinal 1.6 CMT1093 Mison 2 17.5 151 13.1 0.72 4.2 Longitudinal 1.7 CMT1093 Mison 2 17.5 151 13.1 0.9 4.2 Longitudinal 1.8 CMT1093 Mison 2 17.5 151 13.1 1.08 4.2 Longitudinal Wire Speed Experiment 4th substrate 1.9 CMT1093 Mison 2 17.5 118 11.8 0.72 3.2 Longitudinal 2.0 CMT1093 Mison 2 17.5 167 16.3 0.72 5.2 Longitudinal 2.1 CMT1093 Mison 2 17.5 185 19.1 0.72 6.2 Longitudinal 2.2 CMT1093 Mison 2 17.5 210 20.5 0.72 7.2 Longitudinal 2.3 CMT1093 Mison 2 17.5 136 12.2 0.72 3.7 Longitudinal
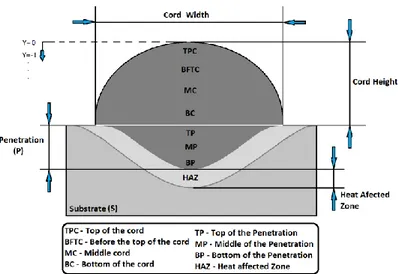
For the microscopic analysis of the cords deposition it was used some diminutive to help locating the areas that are going to be described. The Figure 4.1 is a scheme of the WAAM deposition cord with a perfect shape that is aimed to achieve. It is also to introduce some of the concept used in the measures and analysis.
Figure 4.1 – Description of the diminutive and names used in this analysis
In the second part of the work, after achieving a good set of parameters to produce the cords with the best shape, it is time to understand the behaviour in the interaction between multiple
next five deposition cords it was deposited two cords in the substrate and two on the top of that. The overlap between the pair of cords were changed from 70% to 30%, and this experiment had the purpose to confirm the fulfilment of the gap between cords and to see if the material that overlap the cords do not influence the geometry of the wall to tend to one side, leading it to grow crooked.
Table 4.2– Defined parameters (Multi-cord and Walls Try-out Experiment; Wall Construction)
Depo-sition Synergic Law Type of Gas Gas charge (l/min) Wire Speed (m/min) Robot Speed (m/min) Am-perage (A) Voltage (V) Path's Direc-tion Overlap (%) Multi-cord Ex- peri-ment 5th Sub-strate 2.4 CMT1093 Mison 2 17.5 5.2 0.72 167 16.3 Longitudinal 70/60/50 2.5 CMT1093 Mison 2 17.5 5.2 0.72 167 16.3 Longitudinal 70 2.6 CMT1093 Mison 2 17.5 5.2 0.72 167 16.3 Longitudinal 60 2.7 CMT1093 Mison 2 17.5 5.2 0.72 167 16.3 Longitudinal 50 2.8 CMT1093 Mison 2 17.5 5.2 0.72 167 16.3 Longitudinal 40 2.9 CMT1093 Mison 2 17.5 5.2 0.72 167 16.3 Longitudinal 30 Walls Try-out Ex- peri-ment 6th sub-strate 3.0 CMT1093 Mison 2 17.5 5.2 0.72 167 16.3 Longitudinal bi-directional 40 3.1 CMT1093 Mison 2 17.5 5.2 0.72 167 16.3 Longitudinal unidirec-tional 40 3.2 CMT1093 Mison 2 17.5 5.2 0.72 167 16.3 Longitudinal unidirec-tional 50 3.3 CMT1093 Mison 2 17.5 5.2 0.72 167 16.3 Transversal 40 2.4 Wall Con- struc-tion 7th sub-strate 3.4 CMT1093 Mison 2 17.5 5.2 0.72 167 16.3 Longitudinal Bi-directional 50 3.5 CMT1093 Mison 2 17.5 5.2 0.72 167 16.3 Longitudinal Bi-directional 50
The deposition 2.4 had the aim of understanding the behaviour of four cords, overlapping themselves with different percentage of overlap: 70% between first and second cords; 60% between the second and third cords; and 50% between the third and fourth cords (all made in sequence and with unidirectional path). In the Figure 4.2 it is possible to see the different overlaps used between the cords, being the first cord 2.4.1 and the last 2.4.4.
Figure 4.2 – Deposition 2.4 scheme
The Figure 4.3 is a scheme that represents the ideal shape of the four cords deposited (two on top of other two), experimented from the 2.5 to 2.9 samples.
Figure 4.3 – Deposition 2.5 to 2.9 scheme
In the fifth experiment, called Walls Try out it was tested four cords side by side, and eight layers of them. This shown the dynamic between layers as between cords. This experiment also tested different strategies of deposition, so it was possible to choose the most consistent one, that shown the best results in terms of wall quality, superficial finishing and lack of flaws.
The Figure 4.4 represents a scheme of the ideal shape of the wall and cords distribution inside the wall. The percentage of overlap could be altered accordingly to the flaws or lack of quality of the wall produced.
Figure 4.4 – Deposition 3.0 to 3.3 scheme
The programming of the 3.0 deposition wall was to do the four cords side by side, using a bi-directional and continuous deposition, where the robot only stopped during the transition from one direction to the other. The overlap between cords, for this experiment, was 40% (4.43mm) of the cord chosen on the previous experiment. The length chosen was 150 mm, to allow the process to stabilize between transitions (Figure 4.5A).
In the 3.1 deposition wall the path is the linear one (Figure 4.5B) with the cords being done always in the same direction with 150 mm of length and with an overlap of 40% between the cords. After the fourth cord of each layer is done, the robot returns to the starting point of the first cord. This process was repeated for eight layers.
For the 3.2 deposition wall (Figure 4.5C) it was tried the deposition of four cords side by side as in the 3.1 wall, but this time with the overlap of 50% between them. The aim of this deposition wall was also to achieve the eight layers’ height.
Figure 4.5 – Depositions wall trajectory: A-3.0; B-3.1; C-3.2
In the 3.3 deposition wall, the overlap used was 40% (4.43mm of the chosen cord) and the strategy adopted (Figure 4.6) was the same as in the 3.0 deposition wall, but this time with
the aim of testing different orientation (transversal instead of longitudinal). This deposition was divided in two different sub-depositions, the 3.3A where it was tested the same parameters used before, but with a different strategy; and in the 3.3B it was tested a formula developed in Addimadour that has the objective of giving back an increased robot speed as a compensation for the slower movements that the robot does due to winding paths. The robot speed developed by the formula, with the compensation factor, was 2.4 m/min.
Figure 4.6 – 3.3 deposition wall trajectory
After all the deposition walls done, a final wall with larger dimensions, was made using the parameters and strategy that presented the best results. From this final wall, some samples were taken to do some laboratorial tests.
4.3. Defined tests
During the experiments, microhardness tests are performed in all cords, with a charge of 500gf, to understand how the values are influenced by the parameters tested. This is one way to understand how the material behaves itself accordingly to the changes made.
The Microhardness test was performed by the Vickers Microtech MX7 that allows to do the indentation in every part of the cord. For a standardization and a better comprehension of the results, indentations were done, always at the minimum distance between them, as recommended by the manufacturer and according to the ISO 6507-1:2018. Measurements were taken in vertical line crossing, in all the extension of the cords and walls (Figure 4.7) until it reaches the deep substrate. This procedure had the aim to reach a vertical range pattern of values, the influence of the cooling rate on the top of the cords and walls, and the differences between the substrate affected thermally and the penetration.
Figure 4.7 – Vertical microhardness reference image
The other type of approach, to measure the microhardness, was the horizontal at a constant distance of the surface of the material (Figure 4.8). The aim of this measurement was to start in the substrate non affected thermally and cross all the material that could be affected thermally, cross the transition between heat affected and penetration zone in a horizontal line to understand if the material properties across the cord are the same in the various points of the penetration. Finally, this line of indentations crossed again the transition zone between the penetration and the heat affected zone as the area under the cord until it reaches again the substrate, virtually non-affected. The comparisons of all this data provided a good hardness pattern existing in the cords.
Figure 4.8 – Horizontal microhardness reference image
On the Roell Zwick Z100, three-point flexural tests, with a distance of 50 mm (Figure 4.9A), between two support points were performed to determine the Young Flexural Module value for this type of process production of stainless-steel cords, the limits of elasticity, maximum strength and fracture strength. This tests also provided the graphic with the distribution force vs. displacement.
Figure 4.9 – A-Three-point flexural test example; B-Cords orientation in the sample
The Figure 4.9B is a schematic representation of the cords disposition in the sample for the three-point flexural test. The samples were withdrawn from the bottom of the walls, without reaching the first layer.