ISSN 1611-1699 / eISSN 2029-4433 2016 Volume 17(3): 414–429 doi:10.3846/16111699.2014.978361
FUZZY APPROACH TO DISCRETE DATA REDUCTION:
AN APPLICATION IN ECONOMICS FOR ASSESSING
THE SKILL PREMIUM
Abdul SULEMAN1, Fátima SULEMAN2, Elizabeth REIS3 1Department of Mathematics, Instituto Universitário de Lisboa (ISCTE – IUL),
BRU, Av. Forças Armadas, 1649-026 Lisbon, Portugal
2Department of Political Economy, Instituto Universitário de Lisboa (ISCTE – IUL), DINAMIA’CET, Av. Forças Armadas, 1649-026 Lisbon, Portugal
3Department of Quantitaive Methods for Management and Economics, Instituto Universitário de Lisboa (ISCTE – IUL), BRU, Av. Forças Armadas, 1649-026 Lisbon, Portugal
E-mails: 1[email protected] (corresponding author); 2[email protected]; 3[email protected]
Received 27 September 2013; accepted 15 October 2014
Abstract. Measures of stock of skills alternative to human capital have raised fresh
dif-ficulties, especially in data managing. We propose to empirically compare the efficiency of a hierarchical cluster analysis and a fuzzy clustering in reducing discrete skill data. The outcomes of both methods are subsequently used to measure the impact of skills on earnings in addition to human capital. The proposed methodological comparison was made using an original dataset of retail bankers’ skills assessed by supervisors. Empirical evidence shows that the fuzzy approach is more efficient than the hierarchical clustering: the resulting clusters are fewer and easier to interpret. Furthermore, the earnings equation enriched with skill variables allowed us to correct the education premium, and provides information on monetary incentives related to individual skills. Our paper attempts to raise researchers’ and practitioners’ awareness of data reducing methods, and their implications for wage determinants.
Keywords: human capital, skills, earnings, data reduction, hierarchical cluster analysis,
fuzzy sets, grade of membership model.
JEL Classification: C38, I24, J24.
Introduction
The role of skills in economic performance or individual incomes continues to attract the interest of researchers and policy makers. Researchers focus on the quantification of skill premium, i.e. the price the market is willing to pay for the skills endowed by workers. However, there has been much controversy over measuring the workers’ stock of skills. Our paper joins this research stream by discussing the complexities of alterna-tive measures of skills. The question arising in this context is therefore how to improve
the contribution of human capital (Becker 1964) which, when measured by the years of schooling, is essentially limited to education.
Empirical research in economics of education has given rise to a variety of measures of skills, and highlights the dimensions of skills that might be addressed to overcome the limitations of human capital (Allen, van der Velden 2005). Moreover, skill assessment is usually made by means of a detailed list of skill-items based on a Likert scale response format, and often resulting in a large amount of data (van der Velden, Allen 2011). So we might expect the skill data to be correlated and consequently carry redundant infor-mation. It is therefore necessary to reduce the data prior to evaluating the skill premium in the labour market (Heijke et al. 2003). The unanswered question is then how can we reduce categorical ordinal data compiled from a skill assessment survey and eventually use the resulting reduced form of skills to predict earnings?
Data reduction or dimensionality reduction is a process of deriving a smaller number of features which can be used to reproduce most of the variability present in the original dataset (Ghodsi 2006). The underlying assumption of this procedure is that the original variables are correlated. Practitioners often perform a PCA – principal components analysis (Green 1998; Ashton et al. 1999), which implicitly assumes the data to be vec-tors of a real space. Although this is convenient for practical purposes, in general there is no formal statistical justification to support this assumption. Borland et al. (2001) suggest the use of a kind of cluster analysis for data reduction in the case of discrete responses. Basically, they perform a dimensionality reduction by means of a hierarchi-cal cluster analysis applied to variables. We alternatively propose a fuzzy clustering approach as a means to reduce discrete categorical data. The fuzzy approach to data analysis underlies the concept of partial membership of the fuzzy sets theory. We used a grade of membership (GoM) model (Woodbury, Clive 1974) to summarise the data in a more parsimonious fashion. The model is based on a fuzzy K-partition. By as-sumption, this means the data can be decomposed into K > 1 fuzzy clusters and each individual is related to those clusters by his/her unit sum vector of non-negative GoM scores. Moreover, we compared the performance of two data reduction tools, namely hierarchical cluster analysis (HCA) (Borland et al. 2001) and fuzzy clustering (FC), to illustrate the usefulness of a GoM representation of discrete data to predict earnings. The data we used were compiled in 2001 from a survey intentionally designed to study the impact of skills on earnings in the Portuguese banking sector. The empirical study is divided into two parts. First, we deal with the skill data reduction issue using both a hierarchical cluster and fuzzy cluster analysis. Then, we use the resulting reduced form of skills in a post-hoc analysis to assess how skills impact earnings. The results achieved provide researchers and practitioners with an effective analytical tool to reduce discrete data without resorting to techniques designed for real valued data.
The remainder of this paper is organised as follows. Next section provides an over-view of the literature on skill measurement in economic analysis. We briefly describe the dataset in Section 2, and in Section 3 we review the GoM model. The skill data reduction issue is presented in Section 4. In Section 5 we enrich the standard earnings
equation with reduced form of skills to examine how these variables exert influence on wage setting. Finally, in the last section we discuss the results of our research, make some concluding remarks, and give some guidelines for future research.
1. Proxies of skill
The relationship between education and earnings, referred to as the human capital model, has long been studied by economists. The earnings equation devised by Mincer (1974) formalises how investment in human capital, including education measured by years of schooling and potential experience, impacts individual earnings. However, re-searchers’ continued dissatisfaction with education as a unique proxy of individual skills (WӧBmann 2003) gave rise to empirical studies in economics of education that resulted in a variety of measures of skill. For academic purposes, these can be classified into three broad groups.
First, whereas some economists focus only on cognitive abilities which they measure by test scores (Taubman, Wales 1973), others also include non-cognitive abilities (Bowles, Gintis 1975, 2000; Edwards 1976). In either case, the aim is to obtain an unbiased esti-mate of the wage premium associated with education. This line of reasoning is grounded on the concept of “ability bias” (Arrow et al. 2000), which hypothetically underlies individuals’ unobserved abilities. Thus, earnings differentials across workers may hide causation factors that can bias the estimates of returns to education.
Second, considerable advances have been made since the 1990s in improving skill measurements. Following Krueger (1993), several studies were conducted to ascertain the impact of computer skills on earnings (Entorf et al. 1999; Borland et al. 2001). Under this axis, the mastery of computer skills was assessed by differentiating between users and non-users (Krueger 1993); by discriminating users according to the type of IT (Information Technology) tools (Entorf et al. 1999; Borghans, ter Weel 2004); or by directly assessing the ability to use the range of tools associated with IT (Borghans, ter Weel 2004). These examples clearly target specific skills, namely IT or computer skills. Finally, a number of authors stress the multidimensional nature of human capital, and consider both individuals and jobs to be vectors of productive skills (Léné 1999) or capabilities (Hartog 1981). This third trend somehow revisits the human capital theory by raising the problem of the match between acquired and required skills. Examples include the studies carried out by Green (1998), Allen, van der Velden (2001), Heijke
et al. (2003), Loo and Semeijn (2004). The topic continues to deserve attention as can
be seen from recently published papers by McGuinness and Sloane (2011), Sgobbi and Suleman (2013), Teijeiro et al. (2013), or Deželan et al. (2014). These studies were suc-cessful in their attempt to show that the matching of acquired and required skills shapes the monetary returns to skills. However, this record of success has been questioned by the data the researchers have to handle.
While IQ tests deserved to be labelled as measures of intelligence (Flynn 2000), cata-logues of skills like the British Skill Survey have supported the research on the work-force’s stock of skills (Green 1998), and higher education graduate surveys (Pavlin 2010; van der Velden, Allen 2011). Virtually all of the research that seeks to specifying
human capital calls for some kind of data reduction technique that allows the control of correlations. For instance, Flynn (1987) derived general measures of intelligence from factor analysis, Heijke et al. (2003) use classical hierarchical cluster analysis (HCA) to decompose the data based on more than thirty skills items into eight clusters, while Green (1998) applied a principal component analysis (PCA) to obtain a smaller number of skill categories that captures a large amount of the variance of observable data. However, there are relevant drawbacks in the data reduction techniques, especially in the type of skill variables. Green (1998) underlines the lack of a single criterion to sup-port the decision on the number of components in PCA, which is therefore based on the data and on interpretability issues. The same can be said for HCA where the number of clusters is not known a priori and is determined through a visualisation of the dendro-gram, and then subjectively decided on by the users.
There is no clear evidence of the quality of skill data reduction techniques in the existing literature. Measures of the effectiveness of different techniques to support researchers’ decisions are still missing. There is indeed scope for exploring the comparison between two or more techniques and, then, to indirectly evaluate how they affect the earnings model.
2. Description of the data
We used a dedicated cross-sectional survey of non-manager retail bankers employed at 86 geographically distributed branches of the five largest Portuguese banking firms in three financial corporations. Our survey was conducted at the end of 2001, and provides detailed information on retail bankers: human capital, skills and performance ratings, demographic characteristics, and earnings; job characteristics: job position; and employ-ers’ characteristics (see A. Suleman, F. Suleman 2012).
The data were collected through interviews with supervisors who were asked to as-sess each retail banker in 30 different skill items or variables, giving them a rating for each item on a 5-point Likert scale as follows: 1 – Very Low; 2 – Low; 3 – Medium; 4 – High; and 5 – Very High. The 30 variables comprise four different skill dimensions namely Knowledge; Relational Skills; Organisational Skills; and Cognitive and
Techni-cal Skills. Table 1 accounts for the number of variables in each dimension. The final sample size is N = 600.
Table 1. Number of variables in each skill dimension Skill dimension Number of variables
Knowledge 3
Relational skills 6
Organisational skills 12
Cognitive and technical skills 9
3. Grade of membership model
Principal component analysis (PCA) is the usual statistical method to explore an as-sociation among variables. PCA is, however, designed to be applied to metric data. The skill variables we are addressing here are measured in discrete scales, specifically in a 5-point Likert scale. Hierarchical cluster analysis (HCA) and grade of membership (GoM) analysis emerge as attractive solutions to reduce skill data. While HCA is widely disseminated (see Leese 2005, for a survey), GoM is less known in the social science literature. For this reason we give a brief account of the model underlying this data reduction technique. Readers interested in more details about GoM model may refer to Manton et al. (1994).
Theoretically, the GoM analysis is an alternative version of PCA for discrete data (Bun-tine, Jakulin 2004). It aims to identify related groups or fuzzy clusters which, by as-sumption, represent the unknown structure of discrete data. For statistical analysis pur-poses, we used the GoM model devised by Woodbury and Clive (1974), and it is based on a fuzzy K-partition. Thus, the population under study is hypothetically divided into K fuzzy clusters and each individual, say individual i, is related to those clusters by his/ her unit sum grade of membership scores vector:
(
1, 2, ,)
= …
i g gi i giK
g . (1)
The generic GoM score gik≥0,1 ≤ ≤k K is called grade of membership of individual i
in fuzzy cluster k. The GoM model can be stated as follows. Let Xi =
(
X Xi1, i2, ,… XiJ)
, 1≤ ≤i N, be the vector of outcomes of individual i in J categorical measurement vari-ables, where Xij∈{
1,2, ,… L , 1≤ ≤j}
j J , and Lj ≥2 categories. In our case, J = 30 skill items, Lj = 5 for every skill item and the sample size is N = 600. The GoM criterion function, given K, is:1 1 1 1 , = = = = = l
∏∏∏ ∑
N J Lj K hijl K ik kjl i j l k g L , (2)where hijl is an indicator variable which is equal to 1 if Xij = l and is equal to 0 other-wise, and lkjl is the probability that a full member of fuzzy cluster k has the outcome
l in variable j, i.e.
Pr | 1 .
l =kjl Xij=l gik =
The quantities lkjl account in probabilistic terms for the prevalence of original variables categories in fuzzy clusters. Their estimates are therefore used in practice to profile fuzzy clusters in a similar way as with the principal components in the case of multi-variate real data. Unlike PCA, in GoM analysis the individual factor scores are obtained simultaneously with the components lkjl, by means of grade of membership scores vector as in (1), and are not a product of a post-estimation process. This particular feature provides the GoM model with the dual nature of clustering and discrimination (Woodbury, Manton 1982).
The parameters gik and lkjl are estimated by maximising the criterion function (2). The model’s goodness-of-fit is assessed approximately by a likelihood ratio test that
com-pares LK in (2) with the null-model L1 the so-called independence model with a single cluster. Under the null hypothesis, i.e. when L1 is the true model, the log-likelihood ratio statistic, 1 2ln , = − K L T L (3)
is approximated by a qui-square distribution with n degrees of freedom. The quantity n is equal to the number of estimated parameters (for further details, see Manton et al. 1994).
Having obtained a good fit to data with LK, the next concern is to profile the K clusters that have been derived from the GoM analysis of the data. For this purpose, we have closely followed the criteria established by Berkman et al. (1989). With the excep-tion of high frequencies, the variable-category pair (j, l) is considered to contribute substantively to discriminating the fuzzy cluster k if the estimate of lkjl, that is ˆlkjl, is at least (1 + d) times higher than the corresponding observed relative frequency fjl. In the present study we set subjectively d = 0.20. For high frequencies, the conjunction
and
ˆ 0.90ˆ
l >kjl fjl l >kjl , when true, was also used to flag the pair (j, l) as discriminant. The whole set of the estimates ˆlkjl that match either condition are then used to label the fuzzy cluster k.
4. Skill data reduction
4.1. Hierarchical cluster analysis
The first stage of our data analysis consisted of reducing skill data variables by group-ing them into homogeneous clusters. In this regard, we followed the same procedure as Borland et al. (2001), and used a hierarchical cluster analysis (HCA). The authors claim cluster analysis is a consistent alternative to linear PCA when questions have discrete qualitative responses. Although the primary goal of an HCA is to group individuals into clusters, the algorithms intended to cluster individuals can also be applied to clustering variables.
The 30 observed variables were initially converted into 30 × 5 = 150 dummy variables and then clustered according to Lance and William’s non-metric association measure. The different dummy variable partitions were constructed by complete linkage or fur-thest neighbour method. Subsequently, we considered all cluster solutions from 2 to 20 to measure the influence of these reduced forms of skills on wages. This allowed us to avoid the subjective approach of selecting the more likely cluster solutions based on the observation of the dendrogram.
No matter what cluster solution was chosen, we adopted the same subjective criterion as Borland et al. (2001) to set the individual outcome in each cluster, explained as follows. Consider the solution of T clusters (in this caseT =2, 3, 20… ), t=1, 2, ,…T a cluster indexing variable, and denote by Cit the outcome of individual i in cluster t. Then:
{
}
max | ,
= ∈
it ijl ijl t
C h h C ,
Recall that hijl = 1 if the observed variable Xij=l and hijl = 0 otherwise, where 1, 2, ,600; 1, 2, ,30; 1, 2, ,5
= … = … = …
i j l , as stated above. In the end, given T, the
indi-vidual i is represented by the coordinate vector:
(
1, ,)
,= …
i i iT
C C C (4)
where Cit = 0,1. In this way each individual can be fully associated with either a single cluster or several clusters of variables at the same time. For example, for T = 3, the indi-vidual represented by the vector Ci =
(
1,0,1)
has membership in cluster 1 and cluster 3.4.2. Fuzzy clustering
In the second stage of our study, we subjected the skill data to a GoM analysis. The fuzzy clustering of these data has already proven effective (A. Suleman, F. Suleman 2012). The estimation process of GoM model parameters, namely gik and lkjl, was carried out using DsiGoM Software (Decision System, Inc. 1999). We first ran this software on a trial basis, ranging the value of K from 2 to 5, to find the optimal number of clusters. The results achieved show that the solution of K = 4 fuzzy clusters is the best fit to data (see Table 2). The goodness-of-fit was assessed through the test statistic
T, as in (3), using the transformation:
1/3 2 1 9 , 2 9 − − u u = u T Z
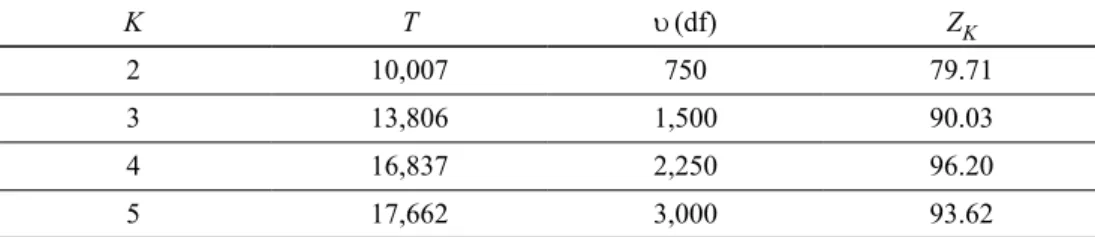
which converts a statistic with a chi-square distribution to a statistic with a distribu-tion closely approximating a standard normal distribudistribu-tion (Wilson, Hilferty 1931). In this formula the quantity u is the number of degrees of freedom. Table 2 displays the empirical values of the statistic Z for different competing GoM models. The higher the value of Z, the better the fit.
Table 2. Goodness-of-fit assessment of GoM models according to the number of fuzzy clusters
K T u (df) ZK
2 10,007 750 79.71
3 13,806 1,500 90.03
4 16,837 2,250 96.20
5 17,662 3,000 93.62
We must stress that all four models provide a better fit to data than the single cluster model implied by the null hypothesis, at the significance level of 5% (ZK >1.645, 2, 5K= … ). Having obtained the estimates of the GoM model based on a solution of K = 4 fuzzy clusters, which we denote by I, II, III and IV, we looked at the lkjl parameter estimates to identify skill typologies latent in the Portuguese banking sector. Empirical evidence shows that the four fuzzy clusters are somehow ordered by skill from the lowest (I)
to the highest (IV). Indeed, we found out that full fuzzy cluster members are likely to have increasing skills rates as we move from fuzzy cluster I to fuzzy cluster IV in all but one observed variable. This finding therefore leads us to label fuzzy clusters I, II, III and IV as Low (skill), Medium, High and Very High, respectively. The resulting fuzzy partition of skill data yields readily interpretable results. The GoM score estimates of individual i, g , ˆi1 g , ˆi2 g and ˆi3 g , can be used to get a fair notion of the overall skill ˆi4 levels of that individual. Individuals with lower skills are characterised by high values of g , whereas high values of ˆi1 g (e.g. greater than 0.80) signal high skilled individu-ˆi4 als. This interpretation potentially provides guidance on how skills are accounted for in wage setting, as we shall see further ahead. In sum, in the GoM analysis of skill data, the individual i can be represented by the non-negative scores of unit sum vector:
(
1, ,2 3 4)
ˆi = ˆi ˆi ,ˆi , ˆi
g g g g g (5)
where each coordinate has a clear interpretation. It quantifies how the range of measured skills is distributed on each individual. As ˆ
∑
ik =1k
g , the GoM analysis provided a data reduction from J = 30 skill items to three effective typological variables. In sum, Ci in (4) and ˆg in (5) must be interpreted as a reduced form of skills, provided by HCA and i GoM analysis, respectively.
5. Influence of skills on earnings
In order to examine the possible influence exerted by skills on earnings, we have taken the Mincer earnings equation as our starting point and extended it in a second phase by reduced forms of skill variables, Eqs (4) and (5). We first considered a basic model consisting of the usual determinants of earnings, namely number of years of schooling, potential experience, gender, and a dummy variable to control the tenure effect, which is equal to 1 if the employee has tenure of over one year and is equal to zero otherwise. This model is written as follows:
2
0 1 2 3 4 5
lnwi =B +B school´ i+B exp´ i +B exp´ i +B ´gender B tenurei + ´ dummyi + ei, (6) where ln w is the natural logarithm of the total monthly wage of individual i, exp the i potential experience and ei the error term which is assumed to have zero mean and unknown constant variance s2. It is important to mention that some other common de-terminants of wages, such as age or tenure, have been omitted from the analysis because they are implicit in the potential experience.
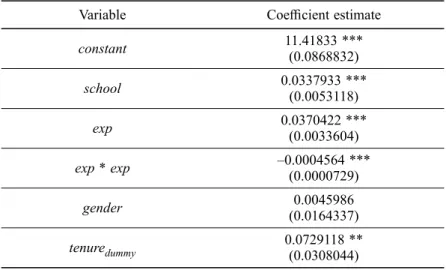
Instead of an OLS regression, we estimated a Tobit model (Amemiya 1984) for the monthly wage paid because wages cannot fall below a low threshold defined for the employee job category. The goodness-of-fit of the Tobit model was measured by Mc-Kelvey and Zavoina’s pseudo-R squared, following the arguments of Veall and Zim-mermann (1994). Table 3 displays the estimates of regression coefficients as well as the corresponding standard errors.
Table 3. Determinants of total wage paid (Tobit model, Pseudo R2 = 0.47)
Variable Coefficient estimate
constant 11.41833 *** (0.0868832) school 0.0337933 ***(0.0053118) exp 0.0370422 ***(0.0033604) exp * exp –0.0004564 *** (0.0000729) gender (0.0164337)0.0045986 tenuredummy 0.0729118 ** (0.0308044)
Observations: 1. The dependent variable is the natural logarithm of total wage paid; 2. Uncensored
or non-missing data observations: 518; 3. *** significant at 1% level; ** significant at 5% level; 4. Standard errors are in parentheses.
Tobit estimates indicate the education premium in the banking industry. Each additional year of schooling increases employees’ earnings by 3.4%, holding all other variables constant. Now we consider the extensions of the earnings equation (6) by incorporating skill variables in their different forms. In order to facilitate the writing of different mo-dels, we denote by Basic all but the error term of the right side of equation (6). That is:
2
0 1 2 3 4 5
Basic = + ´ + ´ + ´ + ´ + ´ .
i
i i i i dummy
B B school B exp B exp B gender B tenure . We can divide the extended models into three major groups. The first group comprises the full model which includes all non-redundant dummy variables. It can be written as
follows: 30 4 1 1 ln Basic . = = = +
∑∑
d +e i jl ijl i j l w h (7)So from 150 dummy variables, we dropped 30 redundant variables related to the Very High category. The second group accounts for the variables based on hierarchical cluster analysis, and can generally be represented by the equation:
( )
1 ln Basic , = = + g∑
T +e i t it i t w C T (8)where C T is the outcome assigned to individual i in cluster of variables indexed it
( )
by t, in a T clusters solution. In this study, we considered all cluster solutions from T = 2 to T = 20 to ascertain whether any solution describes the earnings better than the one obtained from the fuzzy clustering approach. Finally, the wage equation model related to fuzzy skill variables is represented by the equation:
4 2 ln Basic ˆ , = = +
∑
π +e i k ik i k w g (9)where only 3 out of 4 non-redundant GoM scores are considered. We dropped the GoM score related to the lowest skills, that is g . ˆi1
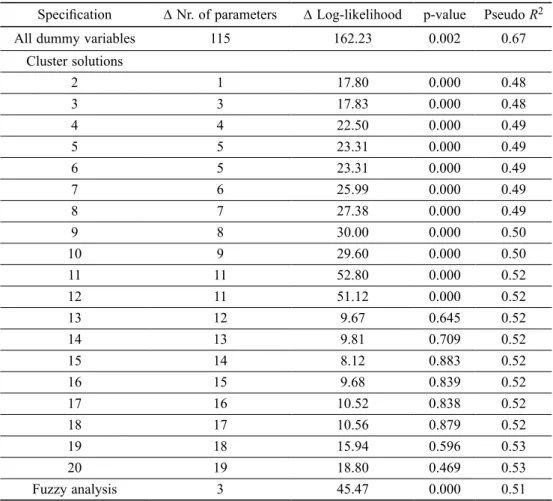
Our operational strategy to assess the impact of skills on earnings comprised two steps. First, we compared each extended model with the basic model to examine if it would be worth adding skill variables. As the basic model (6) is nested in all models implied by the equations (7), (8) and (9), we used a chi-square likelihood ratio test to achieve this objective. The results obtained (Table 4) show that not all enrichments of the basic model were statistically significant. The reduced form of skills derived from the cluster solutions higher than 12 provide no empirical evidence of improvement over the basic model to predict wages. In any case, we believe that the p-values have not been sub-stantively influenced by the number of observations as might be expected to happen with larger samples (Raftery 1995).
Table 4. Likelihood ratio test of goodness-of-fit between nested models
Specification Δ Nr. of parameters Δ Log-likelihood p-value Pseudo R2
All dummy variables 115 162.23 0.002 0.67
Cluster solutions 2 1 17.80 0.000 0.48 3 3 17.83 0.000 0.48 4 4 22.50 0.000 0.49 5 5 23.31 0.000 0.49 6 5 23.31 0.000 0.49 7 6 25.99 0.000 0.49 8 7 27.38 0.000 0.49 9 8 30.00 0.000 0.50 10 9 29.60 0.000 0.50 11 11 52.80 0.000 0.52 12 11 51.12 0.000 0.52 13 12 9.67 0.645 0.52 14 13 9.81 0.709 0.52 15 14 8.12 0.883 0.52 16 15 9.68 0.839 0.52 17 16 10.52 0.838 0.52 18 17 10.56 0.879 0.52 19 18 15.94 0.596 0.53 20 19 18.80 0.469 0.53 Fuzzy analysis 3 45.47 0.000 0.51
Notes: Parameters leading to collinearity were excluded from the calculation of the difference in
number of parameters. The difference (Δ) in number of parameters as well as in log-likelihood is relative to the basic model which has 7 parameters. The Pseudo R2 refers to the adjustment of the corresponding model.
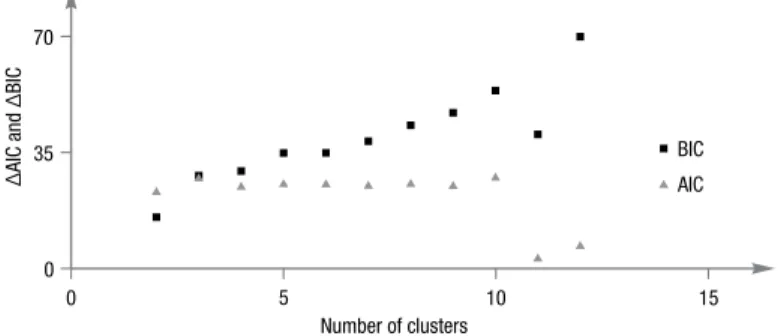
In order to evaluate the importance of the models described above, we considered the earnings model resulting from adding fuzzy skill variables (9) as the baseline. Then we used two scalar measures of fit, namely information measures, to compare each of the remaining models with the baseline. The use of measures of information is appropriate when the competing models are non-nested as in this case. They can also be used to evaluate nested models, although here we opted for likelihood ratio tests to cover this situation.
In relation to the measures of information, we considered two statistics here, namely the Akaike’s Information Criterion (AIC) and the Bayesian Information Criterion (BIC) (Burnham, Anderson 2004) to compare the full model and 11 hierarchical cluster based models with the baseline. We did not consider the models enriched with the remain-ing reduced forms of skills obtained from hierarchical cluster analysis, from 13 to 20 clusters, as they are not significantly different from the basic model, as noted earlier. In any case, whether the criterion is AIC or BIC, the smaller the value of the statis-tic (or more negative), the better the fit. Explicitly, let ICm be the information meas-ure of a given model and ICb the information associated with the baseline model. If
0 − >
m b
IC IC then the baseline model is preferable to the model under consideration, whereas the converse holds true if ICm−ICb<0. Figure 1 shows how the negative difference −
(
ICm−IC varies according to the number of clusters for both AIC and b)
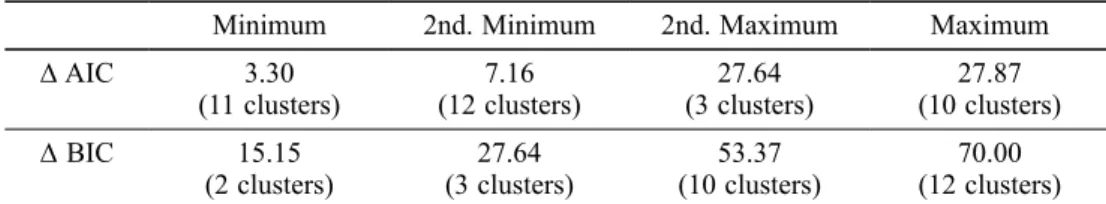
BIC statistics. Table 5 provides some numerical results about these statistics. The full model is accounted for further ahead.
With the exception of the solutions of 11 and 12 clusters, both information measures provide very strong support for the fuzzy based model (Raftery 1995; Burnham, An-derson 2004). The AIC gives this model lesser empirical support when compared to the two exceptional cases (Fig. 1). However, the number of variables associated with them is much larger than in a GoM analysis.
Finally, for the full model, we found a considerable difference in both AIC and BIC statistics, 130.93 and 1132.70, respectively, which leaves this model completely out of the race.
Fig. 1. Evaluation of relative goodness-of-fit of wage models enriched with skill cluster variables compared with fuzzy model (9)
Number of clusters 0 5 10 15 Δ Δ AIC and BIC 0 35 70 BIC AIC
Now we compare the earnings model obtained by adding fuzzy variables (9) to the basic model as expressed in (6). Table 6 shows the estimates of the parameters involved in each model. We repeat here the results displayed in Table 3 to facilitate the comparison of models. Some important findings are worth noting. The coefficients of fuzzy vari-ables are all significant, although the one associated with medium skills g at a level ˆ2i of significance of 10%. These coefficients have increasing values toward the higher skills. Therefore, the results drawn from Table 6 provide evidence which is consistent
Table 5. Extreme relative values of information measures for cluster based wage models Minimum 2nd. Minimum 2nd. Maximum Maximum
Δ AIC 3.30
(11 clusters) (12 clusters)7.16 (3 clusters)27.64 (10 clusters)27.87 Δ BIC 15.15
(2 clusters) (3 clusters)27.64 (10 clusters)53.37 (12 clusters)70.00
Table 6. Earnings model: basic versus fuzzy
Variable (basic model)Coefficient (fuzzy model)Coefficient
constant 11.41833 *** (0.0868832) 11.35282 *** (0.0871154) school 0.0337933 ***(0.0053118) 0.0293002 *** (0.0051256) exp 0.0370422 *** (0.0033604 0.0399006 *** (0.003258) exp * exp –0.0004564 *** (0.0000729) –0.0004922 *** (0.0000705) gender (0.0164337) 0.0045986 (0.0157915)0.0056682 tenuredummy 0.0729118 ** (0.0308044) (0.0299941)0.03597 g2i (medium skills) ---- 0.0711129 * (0.0417516) g3i (high skills) ---- 0.1578881 *** (0.0349548) g4i (very high skills) ---- 0.2407339 *** (0.0446603)
Observations 518 518
Log-Likelihood 148.83 171.56
Pseudo R2 0.466 0.511
AIC –283.66 –323.13
with the hypothesis that wage inequality in the banks is partially related to skill lev-els. The positive and significant estimates indicate that the firms are willing to reward employees for their skills. This also suggests a significant wage gap between high and low-skilled employees.
Another important finding is that the coefficient of schooling decreased about 15%, by adding skill variables. This quantity can be regarded as an estimate of the ability/skill bias of education in the basic model. The empirical evidence strengthens our hypothesis that employers are willing to pay more for employees exhibiting productive skills. Skill premium also seems to contribute to a change in tenure estimates. Employers probably privilege the information arising from a skill assessment made by the supervisor over a simple proxy of specific skills as measured by tenure within firm.
Extensive literature has nevertheless appeared in recent decades attempting to explain the widening of wage dispersion related to demand-side factors, namely the wage policy of firms (e.g. Cardoso 2000). However, this is beyond the scope of this research. Here we attempted to illustrate how different solutions for reducing skill data impact the earnings model. Our findings favour the use of GoM model and the associated fuzzy clustering.
Conclusions
Empirical research into the return to skills has illustrated researchers’ disappointment with education as a proxy of individual skill. There have been many attempts to over-come this limitation. Nevertheless, new skill measures have given rise to fresh difficul-ties especially in data managing. Our goal was to examine the methodological quality of statistical tools for reducing skill data. The empirical results indicate that the tools actually present different levels of effectiveness.
Both the hierarchical cluster analysis (HCA) and the fuzzy clustering (FC) proved to be attractive approaches for the classification of skills. While the assigning of the indi-vidual’s outcomes to each estimated typology was based on subjective criteria in HCA, the FC offers a simultaneous process of variable clustering and individual assignment. The results achieved show that FC performs better than HCA in that it leads to a lower number of clusters and provides meaningful interpretation.
The findings from earning equations reveal that wage inequality is in fact partially related to skills. The estimates suggest that banks use monetary incentives to reward highly skilled employees. Empirical findings are also consistent with the bias of returns to schooling related to unobserved abilities/skills. It is important to stress that adding skill ratings to the equation reduces the coefficient of years of education by 15%; oth-erwise we would be overestimating the impact of schooling on earnings.
While this analysis has contributed to improving our knowledge on factors that increase dispersion of wages, the statistical tools adopted to reduce data raise some questions. HCA offers the possibility of testing different typology solutions, whereas the FC pro-duces simpler results but the number of typologies should be fixed a priori. The Mincer
model enriched by fuzzy based skill variables illustrated a positive relationship between performance and earnings. We think that the reproduction of this study using a broader skill survey data is a challenging task for future work.
Although the methodological discussion addressed herein is primarily of concern to scholarly research, we believe that human resources managers would profit by utilising this expertise to deal with performance and skill appraisal data.
References
Allen, J.; van der Velden, R. 2001. Educational mismatches versus skill mismatches: effects on wages, job satisfaction, and on-the-job training, Oxford Economic Papers 3: 434–452.
http://dx.doi.org/10.1093/oep/53.3.434
Allen, J.; van der Velden, R. 2005. The role of self-assessment in measuring skills, in the
Work-shop in Transition in Youth, 8–10 September 2005, ROA, Maastricht, The Netherlands.
Amemiya, T. 1984. Tobit models: a survey, Journal of Econometrics 24: 3–61.
http://dx.doi.org/10.1016/0304-4076(84)90074-5
Arrow, K.; Bowles, S.; Durlauf, S. 2000. Meritocracy and economic inequality. New Jersey: PUP. Ashton, D.; Davies, B.; Felstead, A; Green, F. 1999. Work skills in Britain. SKOPE, ESRC, The University of Warwick, The University of Oxford.
Becker, G. S. 1964. Human capital: a theoretical and empirical analysis. New York: Columbia University Press.
Berkman, L.; Singer, B.; Manton, K. 1989. Black/white differences in health status and mortality among elderly, Demography 26(4): 661–678. http://dx.doi.org/10.2307/2061264
Borghans, L.; ter Weel, B. 2004. Are computer skills the new basic skills? The return to computer, writing and math skills in Britain, Labour Economics 11(1): 85–98.
http://dx.doi.org/10.1016/S0927-5371(03)00054-X
Borland, J.; Hirschberg, J.; Lye, J. 2001. Data reduction of discrete responses, Applied Economic
Letters 8: 149–153. http://dx.doi.org/10.1080/13504850150504496
Bowles, S.; Gintis, H. 1975. The problem with human capital theory – a Marxian critique,
Ameri-can Economic Review 65(2): 74–82.
Bowles, S.; Gintis, H. 2000. Does schooling raise earnings by making people smarter, in K. Ar-row, S. Bowles, S. Durlauf (Eds.). Meritocracy and economic inequality. New Jersey: Princeton University Press, 118–136.
Buntine, W.; Jakulin, A. 2004. Applying discrete PCA in data analysis, in Proceedings of the
20th Conference on Uncertainty in Artificial Intelligence (UAI) 2004, 7–11 July, 2004, Banff,
Canada, 59–66.
Burnham, K. P.; Anderson, D. R. 2004. Multimodel inference: understanding AIC and BIC in model selection, Sociological Methods and Research 33(2): 261–304.
http://dx.doi.org/10.1177/0049124104268644
Cardoso, A. R. 2000. Wage differentials across firms: an application of multilevel modelling,
Journal of Applied Econometrics 15(4): 343–354.
http://dx.doi.org/10.1002/1099-1255(200007/08)15:4<343::AID-JAE565>3.0.CO;2-6
Decision System, Inc. 1999. User documentation for DSIGoM. Version 1.0.
Deželan, T.; Hafner, D. F.; Melink, M. 2014. First-job educational and skill match: an empiri-cal investigation of politiempiri-cal science graduates in Slovenia, International Journal of Manpower 35(4): 553–575. http://dx.doi.org/10.1108/IJM-05-2013-0103
Edwards, R. C. 1976. Individual traits and organizational incentives: what makes a “good” work-er?, The Journal of Human Resources 11(1): 51–68. http://dx.doi.org/10.2307/145073
Entorf, H.; Gollac, M.; Kramarz, F. 1999. New technologies, wages, and worker selection,
Jour-nal of Labor Economics 17(3): 464–491. http://dx.doi.org/10.1086/209928
Flynn, J. R. 1987. Massive IQ gains in 14 nations: what IQ tests really measure, Psychological
Bulettin 101(2): 171–191. http://dx.doi.org/10.1037/0033-2909.101.2.171
Flynn, J. R. 2000. IQ trends over time: intelligence, race, and meritocracy, in K. Arrow, S. Bowles, S. Durlaf (Eds.). Meritocracy and economic inequality. New Jersey: Princeton Univer-sity Press, 36–60.
Ghodsi, A. 2006. Dimensionality reduction: a short tutorial [online], [cited 27 September 2013]. Available from Internet:
www.cis.temple.edu/~latecki/Courses/AI-Fall11/Lectures/Embeddings.pdf
Green, F. 1998. The value of skills [online], [cited 27 September 2013]. Available from Internet: ftp://ftp.ukc.ac.uk/pub/ejr/RePEc/ukc/ukcedp/9819.pdf
Hartog, J. 1981. Personal income distribution. A multicapability theory. The Netherlands: Kluwer Academic Publishers Group.
Heijke, H.; Ramaekers, G.; Meng, C. 2003. An investigation into the role of human capital com-petences and their pay-off, International Journal of Manpower 24(7): 750–775.
http://dx.doi.org/10.1108/01437720310502113
Krueger, A. B. 1993. How computers have changed the wage structure: evidence from microdata, 1984–1989, The Quarterly Journal of Economics 108(1): 33–60.
http://dx.doi.org/10.2307/2118494
Leese, M. 2005. Hierarchical clustering, in B. S. Everitt, D. C. Howell (Eds.). Encyclopedia of
statistics in behavioral science. John Wiley and Sons, Inc. 799–805.
Léné, A. 1999. La formation en alternance, production de compétences et stratégies d’entreprises: PhD Thesis. University of Sciences and Technology, France.
Loo, J. van; Semeijn, J. 2004. Defining and measuring competences: an application to graduate surveys, Quantity and Quality 38(3): 331–349.
http://dx.doi.org/10.1023/B:QUQU.0000031320.86112.88
Manton, K. G.; Woodbury, M. A.; Tolley, H. D. 1994. Statistical applications using fuzzy sets. John Wiley & Sons, Inc.
Mcguinness, S.; Sloane, P. J. 2011. Labour market mismatch among UK graduates: an analysis using REFLEX data, Economics of Education Review 30: 130–145.
http://dx.doi.org/10.1016/j.econedurev.2010.07.006
Mincer, J. 1974. Schooling, experience and earnings. NBER. New York, Columbia University Press.
Pavlin, S. (coord.). 2010. HEGESCO: Higher education as a generator of strategic competences. Lujbljana: University of Lujbljana.
Raftery, A. E. 1995. Bayesian model selection in social research, Sociological Methodology 25: 111–163. http://dx.doi.org/10.2307/271063
Sgobbi, F.; Suleman, F. 2013. A methodological contribution to measuring skill (mis)match, The
Manchester School 81(3): 420–437. http://dx.doi.org/10.1111/j.1467-9957.2012.02294.x
Suleman, A.; Suleman, F. 2012. Ranking by competence using a fuzzy approach, Quality &
Quantity 46(1): 323–339. http://dx.doi.org/10.1007/s11135-010-9357-1
Taubman, P.; Wales, J. 1973. Higher education, mental ability and screening, The Journal of
Teijeiro, M.; Paolo, R.; Freire, M. J. 2013. Graduate competencies and employability: the impact of matching firms’ needs and personal attainments, Economics of Education Review 34: 286–295.
http://dx.doi.org/10.1016/j.econedurev.2013.01.003
Veall, M. R.; Zimmermann, K. F. 1994. Practitioners corner, goodness of fit measures in the tobit model, Oxford Bulletin of Economics and Statistics 56(4): 485–499.
http://dx.doi.org/10.1111/j.1468-0084.1994.tb00022.x
van der Velden, R.; Allen, J. 2011. The flexible professional in the knowledge society: required competencies and the role of higher education, in J. Allen, R. van der Veldon (Eds.). The flexible
professional in the knowledge society. Higher education dynamics 35: 15–53.
Wilson, E. B.; Hilferty, M. M. 1931. The distribution of chi-square, Proceedings of the National
Academy of Sciences 17: 684–688. http://dx.doi.org/10.1073/pnas.17.12.684
WӧBmann, L. 2003. Specifying human capital, Journal of Economic Surveys 17(3): 239–270.
http://dx.doi.org/10.1111/1467-6419.00195
Woodbury, M. A.; Clive, J. 1974. Clinical pure types as a fuzzy partition, Journal of Cybernetics 4: 111–121. http://dx.doi.org/10.1080/01969727408621685
Woodbury, M. A.; Manton, K. G. 1982. A new procedure for analysis of medical classifications,
Methods of Information in Medicine 21: 210–220.
Abdul SULEMAN is professor at ISCTE-IUL and senior researcher at BRU. He received his PhD
degree in Quantitative Methods from ISCTE-IUL, Portugal. His research interests focus on multivari-ate analysis statistical tools, especially fuzzy clustering. He has recently published in Fuzzy Sets and
Systems and Pattern Recognition Letters.
Fátima SULEMAN is professor at ISCTE-IUL and senior researcher at DINAMIA’CET. She received
her PhD degree in Economics from ISCTE-IUL, Portugal and University of Bourgogne, France. Her research interests are related to wage and employment flexibility in the labour market. She has recently published in Cambridge Journal of Economics and Scottish Journal of Political Economy.
Elizabeth REIS is full professor at the Department of Quantitative Methods for Management and
Economics of ISCTE-IUL and senior researcher at BRU. She received her PhD degree in Social Statistics from the University of Southampton, UK. Her research interests are data collection and data analysis methodologies.