(IJACSA) International Journal of Advanced Computer Science and Applications, Special Issue on Artificial Intelligence
138 | P a g e www.ijacsa.thesai.org
Clustering Student Data to Characterize Performance
Patterns
Bindiya M Varghese Dept. of Computer Science,
Rajagiri College of Social Sciences, Kalamassery
Kerala, India
Jose Tomy J Rajagiri College of Social
Sciences, Kalamassery Kerala, India
Unnikrishnan A Sciencist G, NPOL Kochi
Poulose Jacob K Dean, Dept. of Computer
Science, CUSAT Kochi
Abstract— Over the years the academic records of thousands of students have accumulated in educational institutions and most of these data are available in digital format. Mining these huge volumes of data may gain a deeper insight and can throw some light on planning pedagogical approaches and strategies in the future. We propose to formulate this problem as a data mining task and use k-means clustering and fuzzy c-means clustering algorithms to evolve hidden patterns.
Keywords- Data mining; k-means Clustering; Fuzzy C-means; Student performance analysis.
I. INTRODUCTION
Data mining techniques are used to extract useful and valid patterns from huge databases. Large amount of data is accumulated in universities and colleges concerning the students. The proactive knowledge gained by these techniques will help the stakeholders for decision making that likely to
effect on student’s learning outcomes. The model developed
helps achieve measurable student progress monitoring process and identifies the features that profoundly influence the performance, thus benefiting stakeholders in the educational system and the wider community.
II. CLUSTERING
Clustering is a method to group data into classes with identical characteristics in which the similarity of intra-class is maximized or minimized. Clustering is a descriptive task that seeks to identify homogeneous groups of objects based on the values of their attributes [1][2]. Current clustering techniques can be broadly classified into three categories; partitional, hierarchical and locality-based algorithms. Given a set of objects and a clustering criterion, the partitional clustering obtains a partition of objects into clusters such that the objects in a cluster are more similar to the objects inside the cluster than to objects in different clusters. Partitional clustering algorithms attempt to decompose the dataset directly into a set of k disjoint clusters, provided k is the number of initial clusters. An iterative optimization is done to emphasize the local structure of data, which involves minimizing some measure of dissimilarity in the objects within the cluster, while maximizing the dissimilarity of different clusters. Partitional algorithms are generally iterative in nature and converge to some local optima. Given a set of data points xi ∈ ℜd, i = 1,…,N , partitional clustering algorithms aim to organize them
into K clusters {C1, …, CK} while maximizing or minimizing a pre-specified criterion function J.
A. K-Means Clustering Algorithm
K-means is one of the simplest unsupervised learning algorithms used for clustering. K-means partitions n observations into k clusters in which each observation belongs to the cluster with the nearest mean [3]. This algorithm aims at minimizing an objective function, in this case a squared error function. The algorithm aims to minimize the objective function. K-means is one of the simplest unsupervised learning algorithms used for clustering. K-means partitions n observations into k clusters in which each observation belongs to the cluster with the nearest mean. This algorithm aims at minimizing an objective function, in this case a squared error function. The algorithm aims to minimize the objective function ∑ ∑ ‖ ‖ where ‖ ‖ is a chosen distance measure between a data point and the cluster centre , is an indicator of the distance of the n data points from their respective cluster centres.
B. Fuzzy C- Means Algorithm
Fuzzy c-means clustering allows one data element to belong to two or more clusters. Given a finite set of data, X, the problem of clustering in X is to find several cluster centres that can properly characterize relevant classes of X. In classical cluster analysis, these classes are required to form a partition of X such that the degree of association is strong for data within blocks of the partition and weak for data in different blocks. However, this requirement is too strong in many practical applications, and it is thus desirable to replace it with a weaker requirement.
When the requirement of a crisp partition of X is replaced with a weaker requirement of fuzzy partition we refer to the emerging problem area as fuzzy clustering. Fuzzy pseudo partitions are often called fuzzy c-partitions, where c designates the number of fuzzy classes in the partition. This method was developed by Dunn in 1973 and improved by Bezdek in 1981. It is based on minimization of the following objective function:
∑ ∑ ‖ ‖ , 1≤m<,
where m is any real number greater than 1, uij is the degree
d-(IJACSA) International Journal of Advanced Computer Science and Applications, Special Issue on Artificial Intelligence
139 | P a g e www.ijacsa.thesai.org
dimensional measured data, cj is the d-dimension center of the
cluster.
Fuzzy partitioning is carried out through an iterative optimization of the objective function shown above, with the update of membership uij and the cluster centers cj by:
∑ {‖ ‖‖ ‖} ,
given ∑∑
.
This iteration will stop when {| |} where is a termination criterion between 0 and 1, whereas k
are the iteration steps. This procedure converges to a local minimum or a saddle point of Jm.
Let X={x1,x2,x3,…,xn} be a set of given data. A fuzzy pseudo partition or fuzzy c-partition of X is a family of fuzzy subsets of X, denoted by P={A1,A2,A3,…,Ac} which satisfies ∑ for all ∈ and ∑ for all i∈Nc, where c is a positive integer.
III. DATASET
The dataset consisted of details of students of five consecutive years. The main features are the following attributes for each course attended by the student
i. Attendance
ii. Internal mark assessment iii. Seminar assessment
iv. Class assignment assessment v. University marks scored
The dataset consisted of approximate 8000 records. The attributes internal assessment, seminar assessment and the class assignment were transformed and consolidated into proper normal forms appropriate for mining. Normalization was done on these attributes so that data should fall within a small specified range and hence does not outweigh the measurement of other attributes.
IV. RESULTS AND DISCUSSION
Both, k-means and Fuzzy C-means were applied on the dataset. The prominent results from both the experiments are shown below.
FIGURE 1.A. FIRST INTERNAL ASSESMENT TEST (K-MEANS) FIGURE 1.B. FIRST INTERNAL ASSESMENT TEST (FUZZY C-MEANS)
FIGURE 2.A. SECOND INTERNAL ASSESMENT TEST (K MEANS) FIGURE 2.B. SECOND INTERNAL ASSESMENT TEST (FUZZY C-MEANS)
(IJACSA) International Journal of Advanced Computer Science and Applications, Special Issue on Artificial Intelligence
140 | P a g e www.ijacsa.thesai.org
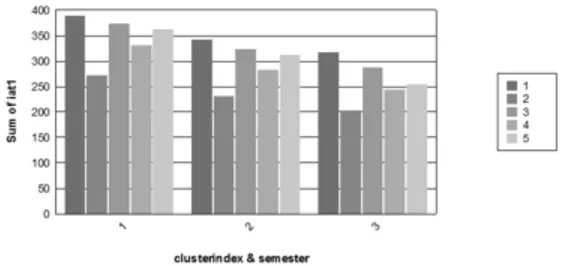
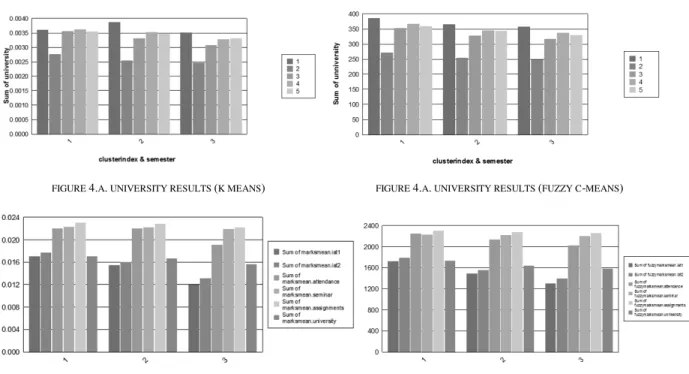
FIGURE 4.A. UNIVERSITY RESULTS (K MEANS) FIGURE 4.A. UNIVERSITY RESULTS (FUZZY C-MEANS)
FIGURE 5.A. AGGREGATE PERFORMANCE (K-MEANS) FIGURE 5.A. AGGREGATE PERFORMANCE (FUZZY C-MEANS)
Following interpretations are made out of the results. The fluctuations in internal assessment marks decreases with each passing semester. The graphs indicate a directly proportional link between attendance and student aggregate performance and that the performance decreases with decreasing attendance. Except for second semester all university marks are equal to or just below first semester university marks. The first semester mark can be considered as an indicator of what can be expected of a student in further semesters.
The graphs of both the algorithms support the same facts that students score more in second internal assessment which is conducted after 30 sessions of the semester than in the first internal assessment conducted after 15 sessions and university mark is almost the same or just above internal assessment marks
This pilot study provides fundamental inferences to develop basic heuristics for the course. The clustering process provides us with different perspectives which can made use while preparing the schedule for internal assessments and the curriculum. The Internal Assessment Scores are clearly an indicator for the student’s academic performance and at the end of First Internal Assessment remedial classes can be designed and implemented. As a future research, clustering can be directly applied to more expounded data, so that more relations between the different attributes are emerged.
REFERENCES
[1] Ester, M., Frommelt, A., Kriegel, H.-P., and Sander, J. 1998. Algorithms for characterization and trend detection in spatial databases. In Proc. 4th Int. Conf. on Knowledge Discovery and Data Mining, New York City, NY, pp. 44-50.
[2] Kaufman, Leonard and Peter J. Rousseeuw. Finding Groups in Data: An Introduction to Cluster Analysis (Wiley Series in Probability and Statistics). Wiley-Interscience, March 2005.
[3] MacQueen, J. B. (1967). "Some Methods for classification and Analysis of Multivariate Observations". 1. Proceedings of 5th Berkeley Symposium on Mathematical Statistics and Probability. University of California Press. pp. 281–297. MR0214227. Zbl 0214.46201. Retrieved 2009-04-07.
[4] http://en.wikipedia.org/wiki/Data_clustering#Fuzzy_c-means_clustering [5] Richard Nock, Frank Nielsen, "On Weighting Clustering," IEEE
Transactions on Pattern Analysis and Machine Intelligence, pp. 1223-1235, August, 2006
AUTHORS PROFILE
Bindiya M Varghese is a researcher in the field of data ming, specilizing on fuzzy quadtree based algorithms. Currently works as the Assistant Professor in the Department of Computer Science, Kalamassery Kerala, India.
Jose Tomy is currently with Tata Consultancy Services, Kochi as a software Engineer.
Unnikrishnan A Ph.D is with Naval Physical Oceanographic Laboratory , an organization under defence ministry of India, as Senior Scienctist. Poulose Jacob K Ph.D is the Dean and HOD of the department of Computer