I “Exploratory Analysis of pH Reference Materials for Quality Control Acceptance by
Chemometrics Algorithms”
European Master in Quality in Analytical Laboratories (EMQAL)
Under the supervision of:
Dr. Regina A. Easley (NIST)
Prof. Isabel Cavaco (UAlg)
University of Algarve
Faculty of Science and Technology
II “Exploratory Analysis of pH Reference Materials for Quality Control Acceptance by
Chemometrics Algorithms”
Declaration of Authorship
I declare that I am the author of this work, which is original. The work cites other authors and works, which are adequately referred in the text and are listed in the bibliography.
_____________________________________________ (Madonna Atef Boulos Salib)
Copyright: Madonna Salib
The University of Algarve has the right to keep and publicize this work through printed copies in paper of digital form, or any other means of reproduction, to disseminate it in scientific repositories and to allow its copy and distribution with educational and/or research objectives, as long as they are non-commercial and give credit to the author and editor.
III
I would like to thank Erasmus Mundus committee for the opportunity to pursue my master degree in Europe.
I would like to thank the National Institute of Standards and Technology (NIST) for the opportunity to pursue my research in the United States of America, and the National Institute of Metrology, Standardization and Industrial Quality in Brazil (INMETRO) for their contribution in the research.
I thank Prof Isabel for her advice. Her guidance helped me in all the time of writing of this thesis.
I thank Dr Regina for her patience, encouragement and guidance throughout the course of this project. I am very grateful.
I thank Dr Werickson for teaching and introducing chemometrics to me.
I thank Dr Oleksii Kuznetsov, Chief of Materials Metrology Division at INMETRO for collecting the XRD data for my samples.
Finally, I would like to thank my family, Noha and Rania, for their love, support and understanding. I would like to dedicate this thesis to my mom. I wish you were here, I have always felt your presence. I hope I made you proudest the angel up there. Your prayers for me were what sustained me thus far.
IV Abstrato
O National Institute for Standards and Technology (NIST) tem procedimentos definidos para a aceitação dos seus Materiais de Referência Certificados (MRC) para medição de pH. Estes procedimentos são morosos e destrutivos para a amostra. A sua substituição por métodos quimiométricos recorrendo a técnicas de análise não destrutivas traria grandes benefícios, por um lado em termos da rapidez e simplicidade do procedimento de aceitação de MRC.
Neste trabalho recolheram-se espectros no infravermelho próximo (NIR) e espectros Raman e trataram-se os dados através de análise de componentes principais (PCA), a fim de realizar uma análise qualitativa de três diferentes MRC de pH: carbonato de cálcio (CaCO3), tetraborato de sódio decahidratado ( bórax) e hidrogeno ftalato de potássio (KHP).
O método foi testado para distinguir entre MRCs produzidos pelo NIST e outros materiais candidatos a MRC, assim como amostras comerciais de menor pureza que serviram como controlo negativo.
Uma coleção de 87 amostras de CaCO3, 52 amostras de bórax e 63 amostras de KHP foi analisada por espectroscopia NIR e Raman. No caso do CaCO3, o PCA alcançou uma boa discriminação, coerente com o método de referência NIST para aceitação de MRC de pH. No caso do bórax, obteve-se boa discriminação entre as amostras, mas que se revelou inadequada para controle de qualidade dos materiais candidatos. No caso do KHP, a discriminação entre amostras foi insuficiente, mas não exclui a possibilidade de aplicar o método proposto ao controle de qualidade de materiais candidatos visto o método de referência NIST também foi incapaz de distinguir os controlos negativos.
A diferenciação obtida por PCA para o caso do CaCO3 foi explicada por difração de raios-X, tendo-se verificado que os diferentes grupos observados por PCA correspondem a diferentes polimorfos de calcite, aragonite e vaterite.
No caso do bórax, a análise termogravimétrica revelou que o bórax tende a perder parte de sua água de cristalização ao longo do tempo de armazenamento e se transforma lentamente na forma pentahidratada. A análise por PCA diferenciou grupos de acordo com o grau de hidratação das amostras.
V
nos cristais de KHP.
Este estudo prova que o uso de quimiometria e sua capacidade de discriminar entre amostras quimicamente diferentes é potencialmente uma ferramenta poderosa para garantir a identidade e a qualidade de MRC para pH, e para simplificar o procedimento de aceitação de novos MRC.
VI Abstract
Spectra collected with near infrared (NIR) and Raman spectroscopic methods were used along with unsupervised pattern recognition, namely, principle component analysis (PCA), to conduct a qualitative analysis of three different pH materials: calcium carbonate (CaCO3), sodium
tetraborate decahydrate (borax) and potassium hydrogen phthalate (KHP).
The NIR and Raman based fingerprinting with PCA were tested to distinguish between standard reference materials (SRM‘s) produced by the National Institute of Standards and Technology (NIST), and other potential candidate materials, and commercial samples of lower purity. A collection of 87 samples of CaCO3, 52 samples of borax and 63 samples of KHP were
measured by NIR and Raman spectroscopy. In the case of CaCO3, PCA achieved a good
discrimination coherent with the NIST reference method for acceptance of pH SRM‘s. In the case of borax, good discrimination was obtained between the samples but inadequate for quality control of candidate materials. In the case of KHP, insufficient discrimination was obtained between samples. This does not exclude the possibility of applying the proposed method to the quality control of candidate materials, because the NIST reference method was also unable to distinguish negative controls from SRMs.
The PCA clusters were further explained by X-ray diffraction (XRD) in case of calcium carbonate, which revealed that the PCA discrimination is based on the phase transformation of polymorphs of calcite, aragonite and vaterite.
In the case of borax, thermogravimetric analysis (TGA) revealed that borax is not a stable substance but it tends to lose some of its crystallization water and transforms slowly into the pentahydrate. This is in good agreement with the different groups distinguished on the PCA. KHP was characterized by the impurities within the samples. The dominant impurity was proven to be the occluded water.
This study proves that the use of chemometrics and its ability to discriminate between chemically different samples could be a powerful tool to assure the identity and quality of the pH buffer materials and to streamline the acceptance procedure of new issues of SRM‘s.
VII 1. INTRODUCTION ... 1 1.1. Objectives ... 1 1.2. NIST pH SRM program ... 2 1.3. pH concept... 2 1.4. Certification of NIST pH SRMs... 6
1.5. Pharmaceutical case study ... 11
1.6. Non-destructive techniques ... 12
1.7. Chemometrics... 13
1.8. Methodology ... 14
2. MATERIALS AND METHODS ... 16
2.1. Samples and Reagents ... 16
2.2. Measurement of liquid buffers with glass pH electrode (Reference method)... 16
2.2.1. Calcium Carbonate... 19
2.2.2. Sodium Tetraborate Decahydrate (Borax) ... 19
2.2.3. Potassium Hydrogen Phthalate (KHP)... 20
2.3. NIR and Raman measurement... 20
2.3.1. Calcium Carbonate... 22
2.3.2. Sodium Tetraborate Decahydrate (borax) ... 22
2.3.3. Potassium Hydrogen Phthalate (KHP)... 22
2.4. X-ray powder diffraction (XRD)... 22
2.5. Thermogravimetric Analysis (TGA) ... 22
3. DATA ANALYSIS ... 23
3.1. Data reduction ... 24
3.2. Spectral Pretreatment ... 26
4. RESULTS AND DISCUSSION ... 28
4.1. PCA and HCA ... 28
4.1.1. Calcium carbonate ... 28
4.1.2. Sodium Tetraborate Decahydrate (borax) ... 35
4.1.3. Potassium Hydrogen Phthalate (KHP)... 39
4.2. Reference electrochemical pH method ... 44
VIII
4.2.2. Sodium Tetraborate Decahydrate (borax) ... 48
4.2.3. Potassium hydrogen phthalate (KHP) ... 52
4.3. X-ray powder diffraction (XRD)... 55
4.4. Thermogravimetric analysis (TGA) ... 57
5. CONCLUSION ... 60
IX SRM® Standard Reference Material®
NIST National Institute of Standards and Technology
NIR Near infrared spectroscopy
Borax Sodium Tetraborate Decahydrate
KHP Potassium Hydrogen Phthalate
PCA Principal Component Analysis
HCA Hierarchical Cluster Analysis
XRD X-ray powder diffraction
SEM Scanning Electron Microscopy
TGA Thermogravimetric Analysis
NMI’s National Metrology Institutes
IUPAC International Union of Pure and Applied Chemistry
SI units International System of units
CRM Certified Reference Material
ORM Office of Reference Materials
SED Statistical and Engineering Department
PAT Process Analytical Technology
PCs Principal Components
SOM Self-Organizing Map
X INMETRO National Institute of Metrology, Standardization and Industrial Quality
XI
Figure 1 - Structure of the combination pH glass electrode ... 3 Figure 2 - Development of the junction potential caused by unequal mobility of Na+ and Cl- ... 6 Figure 3 - Harned cell ... 7 Figure 4 - Schematic Outline of the main steps in producing a pH Standard Reference Material ... 10 Figure 5 - Workflow of the study design ... 13 Figure 6 - Keithley model 6514 electrometer connected to a Thermo Scientific Orion Micro combination pH electrode ... 17 Figure 7 - Two-point calibration or bracketing of a glass electrode ... 18 Figure 8 - Bruker® Vertex 70 FT-IR spectrometer and Spectralon (polytetrafluoroethylene, PTFE) fitted inside the HPLC vial ... 21 Figure 9 - Bruker® Vertex 70 FT-IR with RAM II module (near-infrared dispersive Raman spectroscopy technique) ... 21 Figure 10 - NIR Raw Spectra. (a) calcium carbonate N=87; (b) borax N=52 and (c) KHP N=63. Subplots (d), (e), and (f) show representative spectra from each batch for CaCO3, borax, and KHP, respectively ... 25 Figure 11 - Raman Raw Spectra. (a) calcium carbonate N=87; (b) borax N=52 and (c) KHP N=63. Subplots (d), (e), and (f) show representative spectra from each batch for CaCO3, borax, and KHP, respectively ... 26 Figure 12 - NIR preprocessed Spectra. (a) calcium carbonate; (b) borax and (c) KHP. Subplots (d), (e), and (f) show Raman preprocessed Spectra for CaCO3, borax, and KHP, respectively .. 28 Figure 13 - PCA scores plots of calcium carbonate samples for (a) NIR and (b) Raman ... 31 Figure 14 - PCA loadings plots of calcium carbonate samples for (a) NIR and (b) Raman... 32 Figure 15 - Raw Raman spectra of SRM batches versus (a) Baker and Sigma and (b) Home Science and Fishbone ... 33 Figure 16 - Dendrogram calculated with the PCA scores of calcium carbonate for (a) NIR and (b) Raman... 34 Figure 17 - PCA scores plots of borax samples for (a) NIR and (b) Raman ... 37 Figure 18 - SRM’s Samples. (a) SRM 187f; (b) SRM 187e ... 37 Figure 19 - Dendrogram calculated with the PCA scores of borax for (a) NIR and (b) Raman . 38
XII
Figure 20 - PCA scores plots of KHP samples for (a) NIR and (b) Raman ... 41 Figure 21 - PCA scores plots of pH standards versus acidimetric standard for (a) NIR and (b) Raman ... 42 Figure 22 - PCA scores plots of ground / not ground acidimetric standard for (a) NIR and (b) Raman ... 42 Figure 23 - Dendrogram calculated with the PCA scores of KHP for (a) NIR and (b) Raman... 43 Figure 24 - XRD pattern for calcium carbonate samples... 56 Figure 25 - TGA curve for borax samples for (a) SRM 187f; (b) Home Science; (c) SRM 187e and (d) Merck ... 59
XIII
Table 1 - The seven pH standards as Standard Reference Materials (SRMs) by NIST ... 8 Table 2 - The seven pH standards as Standard Reference Materials (SRMs) by NIST ... 9 Table 3 - Summary of pH Materials Examined by NIR, Raman, and Supplementary Analysis .. 15 Table 4 - pH values pH(S1) and pH(S2), were used to bracket the unknown pH(X) ... 18 Table 5 - Acceptance testing for calcium carbonate ... 46 Table 6 - Results of acceptance testing for our samples of calcium carbonate versus the results of homogeneity assessment for SRM 2193b provided by NIST Statistical Engineering Division analysis ... 47 Table 7 - Acceptance testing for borax ... 50 Table 8 - Results of acceptance testing for our samples of borax versus the results of homogeneity assessment for SRM 187 series provided by Pratt ... 51 Table 9 - Acceptance testing for potassium hydrogen phthalate ... 53 Table 10 - Results of acceptance testing for our samples of KHP versus the results of homogeneity assessment for SRM 185 series provided by Pratt ... 54
1 1. INTRODUCTION
1.1. Objectives
The most frequently measured chemical quantity, often described as a master descriptive variable, is pH. Measurement of pH serves as a key indicator for acid/base equilibria, metal speciation, mineral saturation states and the bioavailability of metals, organic ligands, and proteins. Accurate measurements of pH depend on the availability of pH Certified Materials (CRM‘s). National metrology institutes such as the National Institute of Standards and Technology (NIST) supply primary pH buffers to ensure the quality of pH measurements worldwide.
The overall control of the quality of NIST pH standard reference materials (SRMs) starts from the candidate pH raw material and continues through the value assignment process which involves the preparation of liquid buffer solutions from solid buffers and an inter-comparison of the new buffer with the former one. The process to examine the quality of candidate materials can be time consuming and non-destructive methods to quickly screen materials is desired. An alternative procedure would involve spectroscopic fingerprinting. Spectroscopic fingerprinting has been widely used as a tool for the quality control of raw materials. However, discussions are still on-going as to whether a single technique provides adequate information to control the quality of pH buffer reference materials. In this study, we applied near infrared spectroscopy (NIR) and Raman spectroscopy in combination with chemometrics approaches to streamline the production process of three pH reference materials: calcium carbonate (used as saturated Ca(OH)2 solution), sodium tetraborate decahydrate (borax) and potassium hydrogen phthalate
(KHP). We aimed to reduce the time as well as the procedure needed to accept new candidate pH raw materials. NIR and Raman spectroscopy are known as fast, low cost, non-destructive tools with no or minimal sample preparation; and with the application of chemometrics, we tested the ability to distinguish between different quality levels of raw materials for use as primary pH standards. To accomplish this goal, former batches of pH SRM‘s were compared against potential candidate materials. Common commercial samples were also tested, functioning as negative control samples.
2
believe that the use of an unsupervised classification method for multivariate data treatment such as principal component analysis (PCA) and hierarchical cluster analysis (HCA) would provide a quick and non-destructive qualitative tool to characterize the buffer samples.
It is worth mentioning that the traditional method of characterization is a univariate method using glass electrodes which does not provide as much information as the application of multivariate methods. Therefore, we consider the use of rapid analytical techniques NIR and Raman to examine variance in the buffer materials and supplemented these findings with analysis by techniques such as X-ray powder diffraction (XRD) and thermogravimetric analysis (TGA) for further explanation and interpretation of the results.
1.2. NIST pH SRM program
Measurement and control of pH is required nearly in every laboratory where industrial processes and research work are carried out. It is claimed that commercial pH glass electrodes can measure pH values with a reproducibility of 0.01 and therefore, standard solutions are used to calibrate the electrode reading system. The pH values of the tested samples are compared to those of standard solutions of known pH. National metrology institutes like NIST provide high quality materials which link these pH values to the International System of Units (SI units). Guidelines developed by research and through standard practice at NIST and then agreed upon by the International Union or Pure and Applied Chemistry (IUPAC) outline the qualifications needed to produce a primary pH reference material1. These guidelines ensure that pH values assigned to primary pH buffer materials are reproducible and have well defined uncertainties. The pH of six primary standards (potassium hydrogen tartrate, potassium dihydrogen citrate, potassium hydrogen phthalate, potassium dihydrogen phosphate/disodium hydrogen phosphate, sodium tetraborate decahydrate and sodium bicarbonate/sodium carbonate and two secondary (potassium tetroxalate and calcium hydroxide) reference standards are routinely assigned.2
1.3. pH concept
3
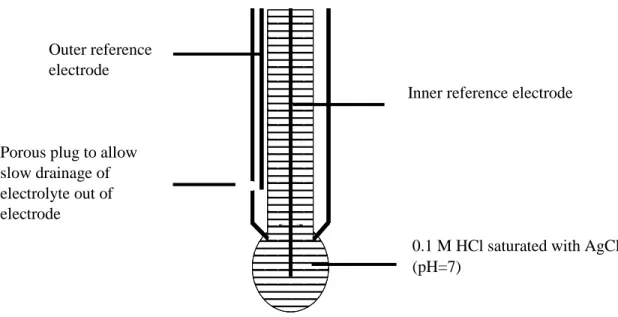
last decade of the 19th century; he introduced the theory of electrolytic dissociation where the dissociation constant of water was determined by providing the relationship between hydrogen ions (H+) and hydroxyl ions (OH-). This was followed by the establishment of the acidity scale by Friedenthal in 1904 where he examined the color change of indicator dyes in 14 solutions of known hydrogen concentration. Later in 1909, Sørensen, a Danish chemist, introduced the concept of pH with regard to the concentration derived from the ionic product of water with a (zero to 14) scale at 25 ºC. The application of glass electrode (shown in Figure 1) to acidimetric titrations was introduced by Haber and Klemensiewicz in the same year.3 Later, the concept of pH (Equation 1) was proposed by Sørensen and K. Linderstrøm-Lang as the activity of the hydrogen ions in solution.3
(Equation 1)
where aH is the relative (molality basis) activity; γH is the molal activity coefficient of the
hydrogen ion H+ at the molality mH; and m° is the standard molality (equal to 1 mol.kg-1).
Figure 1 - Structure of the combination pH glass electrode
Values for pH can be expressed as the convention of excess hydrogen ions (proton pressure) or hydrogen ions deficiency (proton deficiency) in water. Measurements of pH can be made using different techniques. Indicator dyes provide a visual way of assessing pH while the hydrogen ion
Eléctrodo de
referência exterior
Diafragma
Eléctrodo de
referência interior
Solução tampão
interior (Cl
-, pH=7)
Eléctrodo de
referência exterior
Diafragma
Eléctrodo de
referência interior
Solução tampão
interior (Cl
-, pH=7)
Inner reference electrode
0.1 M HCl saturated with AgCl (pH=7)
Outer reference electrode
Porous plug to allow slow drainage of electrolyte out of electrode
4
and applies to solutions where the ionic strength is sufficiently low in concentration and where the activity coefficient of the hydrogen ion (γH+) does not deviate significantly from unity. To
overcome this difficulty, Roger G. Bates proposed another more practical definition where the pH is determined relative to that of a standard buffer based on the infinite dilution system from measurements obtained from cells without liquid junction.4 A buffer is an acid-base system consisting of a mixture of a weak acid/base and its conjugate base/acid. Changes of pH occur when the buffer presented in the solution reacts with the liberated hydrogen or hydroxide ion as expressed in Henderson-Hasselbatch equation (Equations 2):4
pH = pKA + log
(Equation 2)
where pH is the concentration of [H+] in mol/L; KA is the acid ionization constant, and [A] and
[B] are the concentrations of the conjugate acid and base, respectively. Ionic strength (I) may affect pH in the following way:5
1. Ionic strength is the measure of the total concentration of ions in a solution where the contribution by a given ion is influenced by its charge (Equation 3). An ion with a higher charge gives a larger contribution. This property impacts the dissociation constant and thereby the solubility of salts. High ionic strength reduces the attraction between anions and cations relatively as compared to their attraction in distilled water and therefore promoting the dissociation of salts, increasing their solubility and ultimately affecting the pH of the solution.
2. The activity coefficient depends on the ionic strength as it measures the deviation of behavior from ideality. The activity coefficient (γH
+
) approaches unity as the ionic strength approaches zero as shown as in equations 3 and 4.
(Equation 3)
Where ci is the concentration of the ith component, zi is the charge on the ion in question, and
5
(Equation 4)
Several factors can contribute to errors associated with glass electrode pH measurements:5
1. The accuracy of pH standards limit sample accuracy by ±0.01 pH units; pH measurement cannot be more accurate than the standards.
2. Junction potential (the porous plug near the bottom of the electrode) contributes uncertainty of at least ~0.01 pH unit due to the change of the junction potential because the ionic composition of the analyte solution within the electrode (~ 3 mol/kg) is different from that of the standard buffer (typically < 0.1 mol/kg); even if the pH of the two solutions is the same, the junction potential will change as shown in Figure 2.
3. Junction potential drift is often caused by two factors. Drift could be initiated if the Ag(s) precipitates due to the presence of a reducing agent in the analyte solution. Junction potential drift could also be an issue when the potassium chloride (KCl) filling solution is diluted causing AgCl to precipitate onto the porous plug. This occurs because most combination electrodes have an Ag|AgCl reference electrode containing saturated KCl solution (around 3 mol kg-1). In both of these cases, the junction potential change will cause a slow drift in the pH reading. This error can be compensated by recalibrating the electrode every two hours.
4. Alkaline or sodium error occurs when [H+] is much lower than [Na+] leading to lower measured pH than the actual one.
5. Acid error is evident if the apparent pH is higher than the true one due to the saturation of the glass with H+ which prevents any further protonation.
6. Equilibrium time impacts a measurement with even in a well-buffered solution taking ~30 s with appropriate stirring to reach equilibrium with an electrode. The time increases for a poorly buffered solution which may require several minutes.
7. Hydration of glass should be maintained by soaking a dry electrode for several hours in order to correctly respond to H+ in a given medium.
8. Temperature must be stabilized such that the calibration of the pH meter should be carried out at the same temperature at which the measurement will be carried.
9. Cleanliness of the electrode can cause incorrect measurements whereby the reading of an improperly cleaned electrode can drift for hours while it is re-equilibrating with aqueous
6
Figure 2 - Development of the junction potential caused by unequal mobility of Na+ and Cl-
1.4. Certification of NIST pH SRMs
To help control the impact of error associated with glass electrode pH measurements, the proper use of standards to calibrate the electrode is required. NIST along with other National Metrology Institutes (NMI‘s), issues seven primary pH standards as SRM‘s as illustrated in Table 1. These SRM‘s are used by chemical manufacturers to provide traceability of pH measurements for routine analysis.
The primary measurement of pH is carried out with a cell without transference (liquid junction) using the hydrogen gas electrode, known as the Harned cell (see Figure 3). It is used for certifying the seven standard pH reference materials as it has high reproducibility and low uncertainty. The Harned cells fulfill all the essential features to be considered as a primary method of measurement: they function according to a precise measurement equation where all the variables can be experimentally determined in terms of the International System of units (SI). The Harned cell is a cell without liquid junction, defined as Pt | H2 | buffer S, Cl- | AgCl Ag,
which means there is no separation between reference and sensing electrode. The Harned cell contains standard buffer (S) and potassium and sodium chloride as a source of chloride ions. Both solutions are added in order to use Ag|AgCl reference electrode.1
Na+ Cl -NaCl Solution Water Region rich in Na+ Region rich in Cl -+ + + - - - NaCl Solution Water
7
8
pH Standard name Approximate
pH
SRM series
Structure Year first
issued
Average unit sold per year
Potassium Tetroxalate Dihydrate 1.7 189 1964 26
Potassium Hydrogen Tartrate 3.5 188 N/A 6
Potassium Hydrogen Phthalate (KHP) 4.0 185 1967 67
(1) Potassium Dihydrogen Phosphate (2) Disodium Hydrogen Phosphate
2 formulations 6.9 (1:1) 7.4 (1:3.5)
186 1965 65
Sodium Tetraborate Decahydrate (Borax) 9.2 187 1970 50 (1) Sodium Bicarbonate (2) Sodium Carbonate 10.0 191 1968 34
Calcium Carbonate (used as saturated calcium hydroxide solution)
9
According to the NIST definitions of Terms and Modes6, a Certified Reference Material (CRM) is a reference material, accompanied by a documentation body providing one or more of specified property values with associated uncertainty at a stated level of confidence and traceability using valid procedures while a Standard Reference Material® (SRM®) is a CRM issued by NIST that meets additional specific certification criteria required by NIST. SRMs are supplied with Certificates of Analysis that state the results of their characterizations and provide information about the proper use of the material. Normally, NIST does not produce or manufacture the materials from which SRMs are fabricated. Rather, materials are provided by industry, scientific companies, or groups that meet NIST specifications as shown in Figure 4. For the pH SRM‘s, the raw materials are purchased from a chemical manufacturer. After receiving the material, NIST scientists perform acceptance testing then the NIST Office of Reference Materials (ORM) bottles the material for distribution. The bottled material is subsequently tested for homogeneity (heterogeneity) and NIST scientists conduct value assignment on the material with Harned cell measurements. After the value assignment is conducted, the Statistical and Engineering Department (SED) at NIST provides determinations of the overall uncertainty of the values according to the Joint Committee for Guides in Metrology Guide to the Expression of Uncertainty in Measurement.7 For primary pH SRMs, the following conditions are required for certification:6
1. Homogeneity assessment for each pH SRM by inter-comparison of randomly selected aliquots of candidate material(s) normalized to the former issuance of the corresponding pH SRM using a glass electrode.
2. Internal control measures require that if there is a significant difference between the mean pH value of the current candidate material and the certified pH of the preceding SRM issue, the candidate material is rejected.
3. Each pH SRM is certified using Harned cells at each temperature of interest using at least three independently prepared buffer solutions of composite samples of the candidate SRM.
4. The combined uncertainty with the certified value involves the uncertainty in potential Harned cell, standard potential of Ag|AgCl reference electrodes, theoretical uncertainty,
pH Standard name Approximate
pH
SRM series
Structure Year first
issued
Average unit sold per year
Potassium Tetroxalate Dihydrate 1.7 189 1964 26
Potassium Hydrogen Tartrate 3.5 188 N/A 6
Potassium Hydrogen Phthalate (KHP) 4.0 185 1967 67
(1) Potassium Dihydrogen Phosphate (2) Disodium Hydrogen Phosphate
2 formulations 6.9 (1:1) 7.4 (1:3.5)
186 1965 65
Sodium Tetraborate Decahydrate (Borax) 9.2 187 1970 50 (1) Sodium Bicarbonate (2) Sodium Carbonate 10.0 191 1968 34
Calcium Carbonate (used as saturated calcium hydroxide solution)
12.5 2193 N/A 12
10
Figure 4 - Schematic Outline of the main steps in producing a pH Standard Reference Material
NIST Specifications for SRM
Acquisition of candidate pH buffer materials
Preparation of liquid buffer solution
Inter-comparison of the new batch to the former one
NO Accepted?
YES
Value assignment, homogeneity and uncertainty
Certificate of Analysis
Number of years
Stability Study
11
At NIST, there are several modes to be applied in the value assignment of any SRM for chemical measurement. The choice of mode is based on different factors such as previous experiences and knowledge of the specific matrix, analyte(s) of interest, current measurement capabilities, the quality of the analytical methods results, and the intended use of the material.6 NIST follows the ISO/Guide 35:2017 Reference materials — Guidance for characterization and assessment of homogeneity and stability for the acceptance testing.8 For the accepting testing of the raw materials for the primary pH standards, NIST makes liquid buffer solutions from the buffer materials when they arrive from the supplier and each solution is measured using a glass electrode against a former batch of the same material used as a control. This acceptance process may take up to one to two weeks to complete depending on the pH SRM tested. Efforts to decrease the SRM production time are underway and methodologies to streamline the acceptance process will both reduce time and financial investment in the production of a new issue of the pH SRM‘s. Furthermore, the glass electrode is univariate technique (∆pHi) that does not provide an appropriate explanation if the material is deemed unsuitable for use. The currently used electrode method cannot assess the purity of the material or reasons for the variability between batches and/or bottles. This study investigates the use of nondestructive multivariate techniques for use in the acceptance testing of these materials.
1.5. Pharmaceutical case study
The pharmaceutical industry can be used as a solid case study for the streamlining of material acceptance as similar problems are experienced by regulatory bodies for pharmaceutical industry. Many regulatory bodies such as the United Sates Pharmacopeia and the European Pharmacopeia require inspection of every barrel in every shipment of raw materials for the pharmaceutical industry to prevent public health concerns resulting from contaminated or mislabeled materials. Laboratory based analytical techniques such as chromatography, wet chemistry and titrations are traditionally used for pharmaceutical raw material identification or verification of the packaging label. This common quality control practice is time consuming and of high cost, destructive in nature, and labor intensive which is considered challenging to handle an enormous number of analyses.9 Among the real-world application of this study is the possibility of routine testing of raw materials for acceptance directly in the warehouses. Raw substances for the pharmaceutical industry can be tested for identification and quality
12
conformance in minutes once a chemometrics model for a substance is developed. This procedure is highly convenient to be applied in pharmaceutical industry as an essential part of Process Analytical Technology (PAT).10 To address this problem, techniques that are non-destructive in nature with minimal manipulation or without sample preparation along with fast acquisition are required.
1.6. Non-destructive techniques
In this study, non-destructive pectroscopic methods such as Near infrared (NIR) spectroscopy and Raman spectroscopy were applied in combination with chemometrics approaches to provide a robust method for characterizing of several of the primary pH SRMs: calcium carbonate (CaCO3), sodium tetraborate decahydrate (borax) and potassium hydrogen phthalate (KHP).
Standard Reference Materials (SRMs) quality to streamline the production process along with
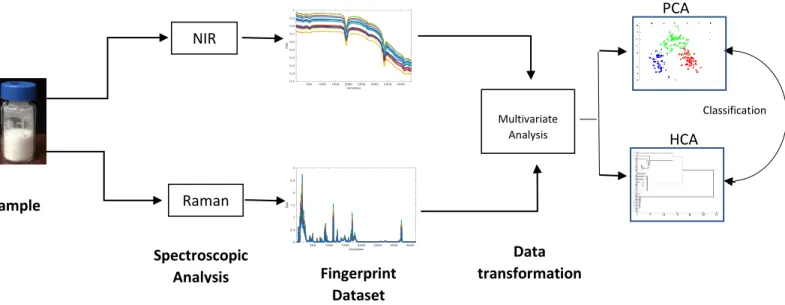
better understanding of batch to batch variability as shown in Figure 5. Near infrared (NIR) spectroscopy and Raman spectroscopy are widely used in quality control
and assessment of purity in diverse fields such as chemical manufacturing, food production, oil industry and agriculture because they can quickly characterized materials by their spectral properties. They are known as fast, low cost, non-destructive tools with no or minimal sample preparation.11,12 In near infrared (NIR) spectroscopy, changes in the molecular dipole moment influence the observed spectra and can provide information regarding the chemical and physical properties of the samples. A drawback to NIR is the technique has low sensitivity due to its high sensitivity to water bonds (this can be useful if the highest impurity of a molecule is water), and strong overlap can occur. In these cases, Raman spectroscopy is implemented as a complementary technique to infrared (IR) absorption spectroscopy.11,12 It is worth mentioning that the development of fiber optics technology and recent improvements made to the instruments have increased the interest and applicability of NIR.11 Raman spectroscopy is a phenomenon where the laser light is scattered by molecules creating vibrational transitions. The spectrum of scattered light reveals spectral bands which provide information related to the properties of the material, either directly or indirectly.13,14 The limitation in size and variation of sample database is one of the biggest challenges in applying such techniques and therefore, one goal of this study was to build a library for the qualitative analysis of three pH reference
13 Data transformation NIR Raman Sample Spectroscopic Analysis Fingerprint Dataset Multivariate Analysis PCA HCA Classification
materials (calcium carbonate (CaCO3), sodium tetraborate decahydrate (borax) and potassium
hydrogen phthalate (KHP)) by sampling materials from current and past issues of the SRMs and supplementing the dataset with materials from different manufacturers or sources.15,16 Chemometrics methods simplified the process of data interpretation.
Figure 5 - Workflow of the study design
1.7. Chemometrics
The International Chemometrics Society defines chemometrics as the science of linking measurements made on a chemical system or process to the state of the system through application of mathematical or statistical methods. In other words, chemometrics extract relevant information from complex multivariate data.14 There are two types of chemometrics classification techniques: the unsupervised method and the supervised method. Concerning qualitative analysis, we use the unsupervised method where samples are classified according to their spectra without any other prior knowledge. In this work, the principal component analysis (PCA) was applied as unsupervised classification method for multivariate data treatment. PCA is a mathematical method that reduces the number of correlated variables of multivariate data into lower dimensional uncorrelated variables expressed as Principal Components (PCs). The analysis of loadings (new variables) provided by PCA contribute to the understanding of the causes of variance, whether they are caused by instrumental, environmental, or sample
14
properties. Loadings are linear combinations of the original variables and can be interpreted like spectra while scores (samples) were plot to confirm statistical differences between different batches (SRM and commercial samples) forming different ellipses or clusters (groups).
On the other hand, the obtained classification was confirmed by the hierarchical cluster analysis (HCA) as this clustering method is characterized by successive divisions of the dataset resulting in a cluster sequence (dendrogram). The main advantage of HCA is the possibility to cluster the samples based on the similarities in terms of the distance and proximity of the samples.11,14,15
1.8. Methodology
Multivariate analysis by NIR and Raman spectroscopy was conducted on three pH reference materials: calcium carbonate (CaCO3), sodium tetraborate decahydrate (borax) and potassium
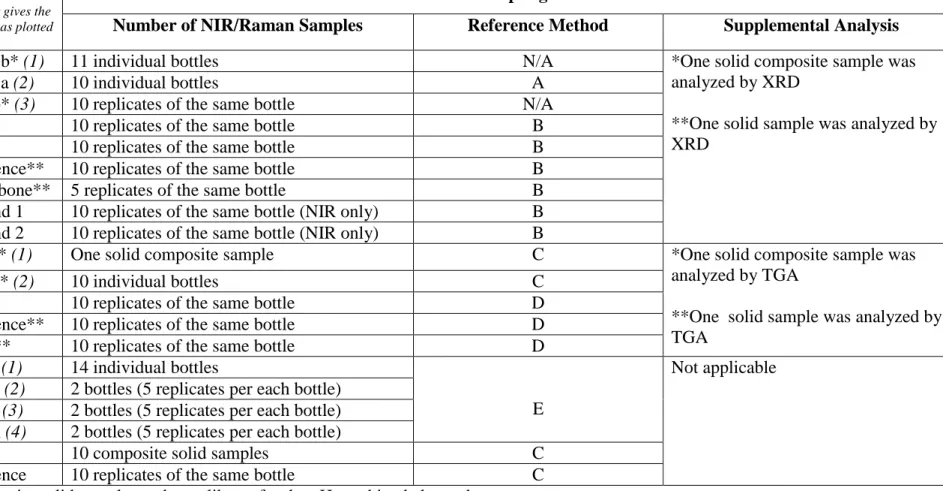
hydrogen phthalate (KHP) for chemometrics analysis. The results from the spectroscopic analysis were also compared to those obtained by the reference univariate electrochemical method. Additional investigations were conducted to examine the sources of variation between materials. Information on the samples used for the analysis is summarized in Table 2.
All data was imported to MATLAB R2018a and the principal component analysis (PCA) and the hierarchical cluster analysis (HCA) were performed using the PLS Toolbox.
Furthermore, rapid analytical techniques such as X-ray powder diffraction (XRD) and Thermogravimetric Analysis (TGA) were applied for further explanation and interpretation of the obtained results by chemometrics.
15
A: One composite solid sample used as calibrant for the pH combined electrode
B: One solid sample from which one solution was prepared and measured on two different days
C: One composite solid sample from which two solutions were prepared and each was measured in duplicate D: One solid sample from which two solutions were prepared and each was measured in duplicate
E: One composite solid sample from all SRMs where one part was not ground and from which one solution was prepared and each was measured in duplicate and another part was ground and from which two solutions were prepared and each was measured in duplicate.
Buffer material
Batch
(Italic number gives the batch number as plotted in the PCA)
Sampling
Number of NIR/Raman Samples Reference Method Supplemental Analysis
SRM 2193b* (1) 11 individual bottles N/A *One solid composite sample was
analyzed by XRD
**One solid sample was analyzed by XRD
SRM 2193a (2) 10 individual bottles A
SRM 915b* (3) 10 replicates of the same bottle N/A
Baker** 10 replicates of the same bottle B
Sigma** 10 replicates of the same bottle B
Home Science** 10 replicates of the same bottle B
Cuttlefish bone** 5 replicates of the same bottle B
Chalk brand 1 10 replicates of the same bottle (NIR only) B
Chalk brand 2 10 replicates of the same bottle (NIR only) B
SRM 187f* (1) One solid composite sample C *One solid composite sample was
analyzed by TGA
**One solid sample was analyzed by TGA
SRM 187e* (2) 10 individual bottles C
Merck** 10 replicates of the same bottle D
Home Science** 10 replicates of the same bottle D
Detergent** 10 replicates of the same bottle D
SRM 185i (1) 14 individual bottles
E
Not applicable SRM 185e (2) 2 bottles (5 replicates per each bottle)
SRM 185f (3) 2 bottles (5 replicates per each bottle) SRM 185h (4) 2 bottles (5 replicates per each bottle)
SRM 84L 10 composite solid samples C
Home Science 10 replicates of the same bottle C
Table 3 - Summary of pH Materials Examined by NIR, Raman, and Supplementary Analysis
Ca
CO
3bo
ra
x
K
H
P
16 2. MATERIALS AND METHODS
2.1. Samples and Reagents
Nine batches of calcium carbonate were examined using NIR Spectroscopy: three issues of calcium carbonate (SRM) 2193 from the National Institute of Standards and Technology (Gaithersburg, MD, USA); five commercial batches: Baker Analyzed Reagent (USA); Sigma chemical Co. (USA); Home Science Tools (USA); Tiza Chalk (USA) and UP&UP Chalk (USA); and 1 natural batch (Cuttlefish bone). Raman Spectroscopy was applied to all the batches except the two chalk batches.
Five batches of sodium tetraborate decahydrate (borax) and six batches of potassium hydrogen phthalate (KHP) were analyzed by NIR and Raman. For the borax, two were issued of the NIST SRM 187 (Gaithersburg, MD, USA), a three were commercial batches: Merck (Germany); Borax Detergent (USA) and Home Science Tools (USA).
For KHP, four batches were pH NIST SRMs (Gaithersburg, MD, USA), one high purity acidimetric NIST SRM 84L (Gaithersburg, MD, USA), and one commercial batch (Home Science Tools, USA).
The water used in the preparation of the buffer solutions was dispensed directly from a deionization-based point-of-use system (Milli-Q system) into the vessel used to prepare the buffer solutions (resistivity > 18 MΩ·cm, conductivity < 0.06 μS/cm). The prepared solutions were protected against evaporation and contamination.
2.2. Measurement of liquid buffers with glass pH electrode (Reference method)
Selected samples were analyzed by the reference method used by NIST to accept candidate pH SRM materials and to determine bottle to bottle heterogeneity of the batch of SRM> Liquid buffers were prepared according to the procedure outlined in the Certificates of Analysis (see section 2.2.1 – 2.2.3).
A Thermo Scientific Orion Micro combination pH electrode was connected to an electrometer (Keithley model 6514) to provide greater sensitivity to pH changes than routine pH meters (Figure 6). Two-point electrode calibrations were performed by bracketing the analysis pH with
17
SRM buffer solutions of known pH, as shown in Figure 7. The standard buffer solutions were given designated, pH values of pH(S1) and pH(S2) and the unknown designated as pH(X) (Table
3). The respective potential differences were measured as EV(S1), EV(S2), and EV(X), the pH
value of pH(X), was obtained by the following equations:1
(Equation 5)
Where the practical slope factor (k′) is defined as follows
(Equation 6)
Figure 6 - Keithley model 6514 electrometer connected to a Thermo Scientific Orion Micro combination pH electrode
18
Figure 7 - Two-point calibration or bracketing of a glass electrode Table 4 - pH values pH(S1) and pH(S2), were used to bracket the unknown pH(X)
pH(X) (unknown) pH(S1) at 25 ºC pH(S2) at 25 ºC
calcium carbonate sodium tetraborate decahydrate (borax), pH(S1) = 9.195
calcium carbonate, pH(S2) = 12.469
sodium tetraborate decahydrate (borax)
sodium tetraborate decahydrate (borax), pH(S1) = 9.195
calcium carbonate, pH(S2) = 12.469
potassium hydrogen phthalate (KHP)
potassium tetroxalate dihydrate pH(S1) = 1.677
potassium hydrogen phthalate (KHP), pH(S2) = 4.005
Two freshly prepared standard buffers were used to determine the pH electrode response (k′) for each set of sample buffers (Table 3). The pH electrode was kept in the standard buffer solution for 30 minutes prior to the start of the measurements to equilibrate. For each measurement, the sample solution was contained in 2 cm3 micro-centrifuge tube where the pH electrode was placed and the sample solution was stirred with the electrode for 30 seconds followed by an additional motionless 30 seconds, after which the glass electrode potential was measured.
The calibrant standard reference buffer solution (its pH is close to the sample pH) was measured using the equilibration protocol before and after each sample measurement as a control to
pH(S1) pH(S2)
E/V
19
account for electrode drift. The other standard buffer solution was measured at the start and end of each set of samples to determine the practical pH electrode response.
All buffer solutions (except calcium carbonate) were prepared gravimetrically by weighing the masses of the salts and adjusting for air buoyancy effects. The quality of prepared buffer solutions was maintained by minimizing atmospheric exposure.
2.2.1. Calcium Carbonate
A saturated calcium hydroxide (Ca(OH)2) solution was prepared from calcium carbonate. About
7.5 g of calcium carbonate was placed into a fused silica (Vycor®) crucible then was slowly heated in a muffle furnace to 950 °C to 1000 °C. The CaCO3 was ignited for one hour at this
temperature. Immediately, the obtained product (CaO) was transferred to a desiccator and was allowed to cool. Lumps were removed by gently crushing and 100 mL of carbon dioxide-free water from Milli-Q system was added while stirring to form a calcium hydroxide Ca(OH)2
suspension. This suspension was boiled for 15 minutes and cooled. The final produce was vacuum filtered on a sintered-glass funnel of medium porosity.
The solid Ca(OH)2 was dried in an oven for 2 h at 110 °C and later was crushed by mortar and
pestle to a fine powder. Approximately 1 kg carbon dioxide-free water was added to the dried Ca(OH)2 (approximately 5g) into a 1 L plastic bottle. This bottle was shaken for a week about
every 2 h and no less than four times per day while being maintained at 25 °C in a thermostated water bath between periods of shaking. The procedure yielded a saturated Ca(OH)2 solution
(0.0202 mol.kg-1) .
For the analysis, the saturated solution of Ca(OH)2 was filtered immediately before use with a
disposable syringe fitted with a 0.45 µm nylon in-line filter.
2.2.2. Sodium Tetraborate Decahydrate (Borax)
Solutions of 0.01 mol.kg-1 were prepared by weighing approximately 3.7 g of each borax sample by difference to an accuracy of 1 mg, into a clean, dry 1 L polyethylene bottle. The solution was prepared according to the certificate of analysis whereby the weighed mass was multiplied by a conversion factor of 261.841 to give the amount of CO2-free water needed to make the solution.
20
The water was weighted to an accuracy of 0.1 g and the solution was then shaken until the solid was totally dissolved. The borax samples were not dried prior to the preparation of the solution.
2.2.3. Potassium Hydrogen Phthalate (KHP)
A solution of the 0.05 mol/kg was prepared by weighing approximately 9.8 g of the material by difference to an accuracy of 1 mg, into a clean, dry 1 L polyethylene bottle. The mass of KHP was multiplied by 97.887, according to the certificate of analysis, to determine the amount of CO2-free water needed to prepare the solution. The water was weighed to an accuracy of 0.1 g
and the bottle was thoroughly shaken until the solid was totally dissolved. The KHP samples were not dried prior to the preparation of the solution.
2.3. NIR and Raman measurement
Acquisition of NIR spectra was done using a Bruker® Vertex 70 FT-IR spectrometer equipped with a Quart-Tungsten Halogen (QTH) lamp and thermo-electrically cooled InGaAS detector as shown in Figure 8. Data were collected and processed using OPUS software. The fiberoptic reflectance was used to record reflectance spectra at 8 cm-1 resolution in the spectral range 3500-12500 cm-1. Samples were held in 2 mL vials from Agilent made of Type 1 borosilicate glass because they have invisible reflectance in the NIR region. To collect the background, a piece of Spectralon (polytetrafluoroethylene, PTFE) disc was cut into to fit inside the sample vial. The measurement was carried out by putting the fiberoptic reflectance probe close to the sample. During each measurement, 64 scans were averaged. Three spectra were obtained for each sample. The sample vial was rotated in three different positions with the NIR light being directed through the glass vial where reflected signals being recorded, and the measuring locations distributed as consistently as possible. A white reference standard consisting of Spectralon was used for calibration after every 15 measurements.
Raman spectra were collected with a Bruker® Vertex 70 FT-IR with RAM II module (near-infrared dispersive Raman spectroscopy technique) using a 785-nm (NIR) diode laser for excitation, over a 0– 3500 cm-1 spectral range, with a resolution of 4 cm-1 (Figure 9). The laser power at the sample was ~500 mW (varied according to sample), and a LN-Ge Diode detector (liquid-nitrogen cooled Ge-diode detector). Samples were held the same 2 mL glass vials used
21
for the NIR measurements. Each sample collected consisted of two spectra at 5 kHz velocity, each spectrum consisting of 32 scans. Naphthalene was used to collect the background prior to the first measurement and after each 20 measurements. For both techniques, samples were subjected to drying and/or grinding conditions according to the certificate of analysis supplied by NIST (Appendix A).
Figure 8 - Bruker® Vertex 70 FT-IR spectrometer and Spectralon (polytetrafluoroethylene, PTFE) fitted inside the HPLC vial
Figure 9 - Bruker® Vertex 70 FT-IR with RAM II module (near-infrared dispersive Raman spectroscopy technique)
22 2.3.1. Calcium Carbonate
The samples were dried at 200 °C to 210 °C for 4 h and stored in a desiccator over anhydrous magnesium perchlorate before use according to instructions in the certificate of analysis for SRM 915b (See Appendix A). Note that the calcium carbonate for the spectral methods do not require the conversion of CaCO3 to Ca(OH)2.
2.3.2. Sodium Tetraborate Decahydrate (borax)
The samples were used without further preparation as they were not dried in an oven nor stored in a desiccator before use according to the preparation instructions in the certificate of analysis (See Appendix A).
2.3.3. Potassium Hydrogen Phthalate (KHP)
The pH Standards and commercial sample were dried for 2 h at 110 °C and stored in a desiccator over anhydrous magnesium perchlorate before use according to the instructions provided in the certificate of analysis for SRM 185i (See Appendix A).
The acidimetric primary standard (SRM 84L) was ground by hand for a period of 60 s to 90 s in an agate mortar to obtain a fine powder. This preparation step helped to break down larger crystals so that occluded water could be sufficiently released during the drying procedure. The powder was dried at 120 ºC for 2 h and stored over anhydrous magnesium perchlorate in a desiccator.
2.4. X-ray powder diffraction (XRD)
Representative samples for CaCO3 were used as received without any further treatment. Analysis
of the samples was carried out by the National Institute of Metrology, Standardization and Industrial Quality in Brazil (INMETRO).
2.5. Thermogravimetric Analysis (TGA)
The thermogravimetric analysis of the sodium tetraborate decahydrate (borax) was performed on an Instrument Specialists Incorporated TGA i1000 to examine weight changes due to the loss of
23
water and other volatiles loosely bound to the samples and to observe sample degradation as function of time and temperature. TGA data was used to predict the decomposition of borate hydrates. The TGA was calibrated using an approximately 10 mg weight whose mass had been verified with a Mettler Toledo XPR2U balance to provide traceability. The oven of the TGA was purged with dry nitrogen gas running at a flow rate of 20 mL/min. The temperature program for the analysis was as follows: the TGA oven was allowed to equilibrate at 25 ᵒC then the temperature was increased at a heating rate of 10 ᵒC per minute up to 900 ᵒC.
Before each sample was measured, a baseline run was performed on an empty platinum pan to correct for apparent fluctuations in mass from buoyancy variations in the sample chamber caused by changes in the temperature of the oven and purge gas. After a smooth baseline was obtained, a sample of the sodium tetraborate decahydrate (borax) was weighed into a platinum crucible (open pan) using an analytical microbalance with a resolution of 0.1 µg. The sample was then run on the TGA using the same temperature program and conditions as the baseline. The baseline was then smoothed and subtracted from the sample runs to give the overall mass versus temperature profile of the sample.
3. DATA ANALYSIS
NIR and Raman provide distinctive and complex fingerprints for each material examined. NIR is associated with the vibration of chemical bonds. Raman is good as a fingerprinting technique because it is dependent on chemical bonds and the local environment of the molecules. Each molecule has a unique spectrum. Therefore, PCA combined with HCA are used as a dimension reduction data analysis tool to explain variation between spectra with as few variables as possible. The data analysis procedure involved two steps. First, a discrimination stage of analysis for the NIR and Raman data using PCA uncovered sources of spectral interferences and differences between NIST SRM‘s and commercial samples. The cluster analysis on this analysis was carried out with Ward‘s linkage type combined with the obtained PCs from the PCA analysis.
The second stage consisted assessing some of the differences attributed to properties and characteristics of the materials using either XRD or TGA techniques.
24 3.1. Data reduction
Each NIR and Raman spectrum is represented by 4407 and 3682 variables, respectively (figures 10 and 11). All spectra were imported to MATLAB R2018a (The MathWorks, Inc.). Firstly, NIR spectra were imported as a function of Reflectance and wavenumber (cm-1). Then, they were converted to Kubelka-Munk (KM) units because the obtained analytical signal is highly complex function that is influenced not only by both physical and chemical properties of the sample but also by the scattering, stray light and inconsistency in the instrument response. Griffiths17 states in the handbook of near-infrared analysis that the choice of converting the recorded data (spectra) into absorbance values (equation 7) or KM units (equation 8) depends on the type of sample and the spectral region. He also claims that whenever KM units are used, the baseline is irreproducible and the band intensities vary with it. However, Dahm and Dahm17 do not share the same opinion of Griffiths that log (1/R) plots are more linear in practice than those of KM. The key is the light scatter depends on the physical features related to the particle properties of the sample such as particle size, particle shape and particle size distribution: the more the scatter, the lesser the light will penetrate the sample which impact on the amount of light absorbed by the sample.17
(Equation 7)
Where A is absorbance, R is reflectance
(Equation 8)
ƒ(R) is KM function where R is diffuse reflectance, k is constant coefficient of absorption and s is scattering coefficient.
However, Kubelka-Munk is the most general and widely validated theory. It assumes three easy and clear assumptions:18
1- The scattered light is identically distributed;
2- The particles are randomly distributed in the layer and smaller than the layer thickness; 3- The layer is affected by the diffuse reflectance only.
25
After the conversion of all NIR spectra, averaging of the duplicate measurements of each sample was carried out where X is the data matrix (samples x variables); X1 is calcium carbonate data matrix (87 x 4407), X2 is sodium tetraborate decahydrate (Borax) data matrix (52 x 4407), and X3 is potassium hydrogen phthalate (KHP) data matrix (63x 4407).
Raman spectra were imported to MATLAB R2018a in function of intensity (a.u.) and wavelength known as Raman shift (cm-1) for preliminary spectra assessment and manual removal cosmic ray removal. Each sample was collected in triplicate and the average was calculated where X` is the data matrix (samples x variables); X1` is calcium carbonate data matrix (66 x 3682), X2` is sodium tetraborate decahydrate (Borax) data matrix (52 x 3682), and X3` is potassium hydrogen phthalate (KHP) data matrix (63x 3682). Then, the laser light peak was excluded from the spectra and the regions with no or little information were eliminated as well before any further preprocessing.
Figure 10 - NIR Raw Spectra. (a) calcium carbonate N=87; (b) borax N=52 and (c) KHP N=63. Subplots (d), (e), and (f) show representative spectra from each batch for CaCO3, borax, and KHP, respectively
26
Figure 11 - Raman Raw Spectra. (a) calcium carbonate N=87; (b) borax N=52 and (c) KHP N=63. Subplots (d), (e), and (f) show representative spectra from each batch for CaCO3, borax, and KHP, respectively
3.2. Spectral Pretreatment
Combinations of various data pretreatment methods were investigated for both NIR and Raman spectra. Many spectra pretreatment combinations were investigated to provide a satisfactory level of group separation or discrimination between SRM‘s and other samples. For NIR spectra, the best results were obtained using first derivative (polynomial order: 2, filter width: 21) followed by Standard Normal Variate (SNV). As shown in Figure 10, the raw spectra of the different materials from each batch displayed broad bands and variability in shape, intensity, and baseline over the whole spectral range. This variability may be caused by uncontrollable physical effects such as non-homogeneous distribution of the particles, changes in refractive index, sample packing/density variability, and sample morphology. In order to minimize or eliminate unwanted variability, spectral pretreatment is necessary. The key is to minimize or eliminate variability unrelated to the key spectral features for classification because some spectral features related to physical properties are significant in differentiating compounds long with chemical
27
differences. Thus, moderate pretreatment is necessary. The key is to minimize or eliminate variability unrelated to the key spectral features for classification thereby differentiating between spectral features related to physical properties which are significant in differentiating compounds from chemical differences. To accomplish this objective, moderate pretreatment was selected. The first derivative was used to obtain more resolvable peaks and to minimize the baseline drift while SNV corrected for both additive and multiplicative effects present in the spectra.9 The crystalline forms as well as variations of optical path-length and the particle sizes of the sample can affect the NIR spectra. These effects this cannot only be overcome by a well-defined sample preparation procedure but also by applying mathematical pretreatments11 (Figure 12).
Raman Spectra of each sample was pre-processed before calculating the PCA model. The raw spectra of all compounds and representative spectra from each batch are shown in Figure 11. The first derivative (polynomial order: 2, filter width: 21), normalizing (2-Norm, length = 1) and mean centering were applied to both calcium carbonate and KHP raw Raman spectra while baseline (Automatic Weighted Least Squares, order=2) followed by smoothing (polynomial order: 1, filter width: 15), SNV, and finally mean centering were applied to borax raw Raman spectra.
Mean center is the last preprocessing technique applied in each combination before calculation to reduce data scatter for NIR and Raman data matrix.
Generally, spectral differences are enhanced by the first derivative and the mean centering is applied to track changes in the distribution or to compare the distributions of different types of features as it is the average x and y. This combination of pre-processing diminishes any deviations during measurements such as small temperature variations and other sources of difference impacting the intensity of the peaks.19 As shown in Figure 12, Raman pre-processed spectral data provides more detailed information about the sample by resolving the previously overlapped bands and by minimizing the baseline drift in the raw spectra.19
28
Figure 12 - NIR preprocessed Spectra. (a) calcium carbonate; (b) borax and (c) KHP. Subplots (d), (e), and (f) show Raman preprocessed Spectra for CaCO3, borax, and KHP, respectively
4. RESULTS AND DISCUSSION
4.1. PCA and HCA
4.1.1. Calcium carbonate
The principal component analysis on the calcium carbonate NIR and Raman data matrix are presented in Figure 13. We observe six different ellipses when plotting the first two principal components of NIR data accounting for respectively 72 % and 19% of the total variance. Two overlapped ellipses correspond to NIST SRM‘s and one of the candidate materials (Sigma). Close to them falls another ellipse that corresponds to the Baker candidate material. Other groups are noticeably distinguishable from the SRM cluster. These outlier materials include the chalk, Home Science batch and the fishbone.
Raman data was not collected for chalk samples because they were dark in color after the drying procedure. The PCA of the CaCO3 Raman samples is differentiated into three distinct groups
29
using PC1 (94%) and PC2 (6%). One group has the SRM batches along with all candidate materials, another corresponds to the natural batch ‗cuttlefish bone‘ and the third group includes the commercial batch ‗Home Science‘.
Figure 14 shows the loadings plots of PC1 and PC2 for NIR and Raman data. Calcite is characterized by features at 5405, 5000, 4255 and 4000 cm-1 in NIR spectra.20 In our study, all features can be seen in the spectra of our dried SRM samples, Sigma and Baker batches as well. The interpretation of the loadings plot of Raman spectra provides further interpretation of the variables responsible for the obtained discrimination. The first PC mainly separates according the presence or the absence of calcite; which represent SRM, Baker and Sigma batches. Samples are negatively affected by the first PC due to presence of the calcite peak. The second PC is responsible for the separation according to the dolomite peak.
We plotted representative raw Raman spectra among each batch against those of the SRM and the peaks of calcite, dolomite and aragonite and vaterite were found to be in good agreement with previous literature.21,22 As shown in Figure 15, both Baker and Sigma are characterized by the presence of calcite peak at 711 cm-1 in perfect agreement with the three batches of SRM. It was proven that Home Science batch is dolomite in nature when we plotted its spectrum against the spectra of SRM batches. Home science is characterized by the presence of dolomite peak at 725 cm-1. According to Kontoyannis21, aragonite is characterized with a peak at 700 cm-1. The spectrum of the cuttlefish bone indicates the presence of the aragonite peak at 704 cm-1.22 It is worth mentioning that the absence of vaterite peak at 750cm-1 proves that none of our samples is in this phase of crystallization.21
One difference to notice is that the NIR method provides more information about the Baker batch as its ellipse in the score plot of NIR shows clear separation away from the ellipse of the SRM‘s and the Sigma batch. In contrast, the Baker fingerprint based PCA was not satisfactory in the score plot of Raman, in which the Baker ellipse is overlapping and misclassified along with the SRM‘s and Sigma ellipse. This illustrates the fact that NIR technique may be more preferable in the case of calcium carbonate.
30
The results of the hierarchical cluster analysis are presented in Figure 16 for both NIR and Raman data matrices. The obtained pattern is the same separation obtained by the PCA where the Baker sample stands out as a separate group on the NIR while it shares some similarities with Sigma and SRM‘s batches on the Raman data. This confirms that NIR is the most useful technique in the case of calcium carbonate.
31
32
33
Figure 15 - Raw Raman spectra of SRM batches versus (a) Baker and Sigma and (b) Home Science and Fishbone
34